Home > Comparison > Financial Services > V vs MA
The strategic rivalry between Visa Inc. and Mastercard Incorporated shapes the financial services sector’s evolution. Visa operates a vast, global payment processing network emphasizing scale and reliability. Mastercard pursues a broader technology-driven model, integrating analytics, cybersecurity, and open banking solutions. This head-to-head reflects a contest between network dominance and innovation-led growth. This analysis aims to determine which company’s trajectory offers superior risk-adjusted returns for a diversified portfolio in today’s dynamic payment landscape.

Table of contents
Companies Overview
Visa Inc. and Mastercard Incorporated dominate global digital payments with expansive networks and innovative solutions.
Visa Inc.: Global Payment Network Leader
Visa Inc. stands as a payments technology powerhouse, operating VisaNet to process authorization, clearing, and settlement of transactions worldwide. Its core revenue comes from transaction fees on card products and value-added services. In 2026, Visa focuses on expanding strategic partnerships like with Ooredoo to enhance payment experiences and solidify its network’s reach.
Mastercard Incorporated: Payment Solutions Innovator
Mastercard Incorporated excels as a technology-driven payment processor, facilitating transaction processing and offering diverse payment-related products. It generates revenue from integrated payment solutions, cyber intelligence, and data-driven insights. In 2026, Mastercard emphasizes open banking, digital identity platforms, and value-added services to deepen customer engagement and broaden global market penetration.
Strategic Collision: Similarities & Divergences
Both companies thrive on transaction processing networks, yet Visa adopts a broadly integrated ecosystem while Mastercard leans into open infrastructure and data analytics. Their primary battleground is global merchant and issuer partnerships. Visa projects stability with a vast network, whereas Mastercard pursues innovation-driven growth, offering distinct investment profiles rooted in scale versus technological differentiation.
Income Statement Comparison
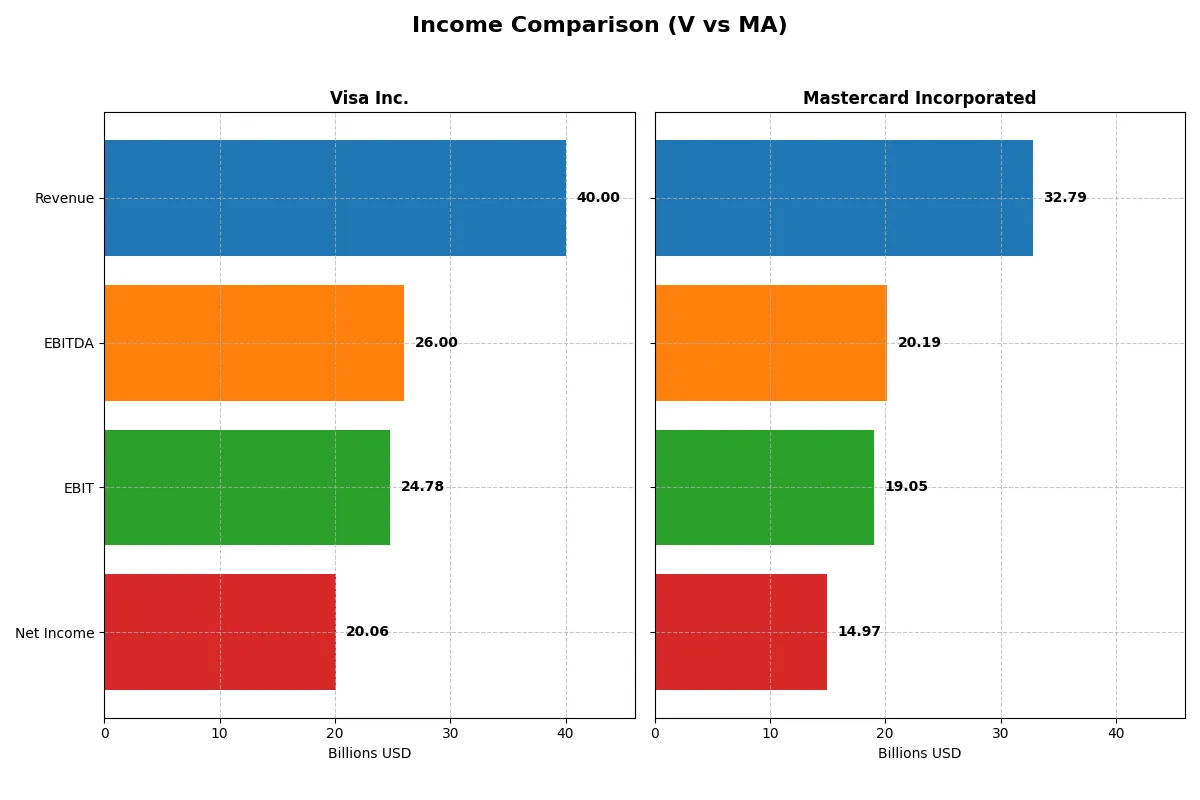
This data dissects the core profitability and scalability of both corporate engines to reveal who dominates the bottom line:
| Metric | Visa Inc. (V) | Mastercard Incorporated (MA) |
|---|---|---|
| Revenue | 40B | 32.8B |
| Cost of Revenue | 7.86B | 5.43B |
| Operating Expenses | 8.15B | 7.96B |
| Gross Profit | 32.15B | 27.36B |
| EBITDA | 26B | 20.2B |
| EBIT | 24.8B | 19.1B |
| Interest Expense | 589M | 722M |
| Net Income | 20.1B | 14.97B |
| EPS | 10.22 | 16.55 |
| Fiscal Year | 2025 | 2025 |
Income Statement Analysis: The Bottom-Line Duel
The income statement comparison reveals which company runs a more efficient and profitable corporate engine through its revenue and net income performance.
Visa Inc. Analysis
Visa’s revenue climbed steadily from 24.1B in 2021 to 40B in 2025, showcasing solid top-line momentum. Net income surged from 12.3B to nearly 20B, reflecting strong profitability. Visa maintains a robust gross margin above 80% and a net margin exceeding 50%, signaling exceptional cost control and operational efficiency. The slight dip in net margin growth last year contrasts with consistent EPS growth.
Mastercard Incorporated Analysis
Mastercard’s revenue expanded from 18.9B in 2021 to 32.8B in 2025, outpacing Visa’s growth rate. Net income rose impressively from 8.7B to 15B, supported by gross margins over 83%. Although its net margin trails Visa’s at around 45.6%, Mastercard’s EBIT and EPS growth rates demonstrate strong operational leverage. The company’s elevated operating expenses relative to revenue growth warrant attention.
Margin Power vs. Revenue Scale
Visa’s superior net margin and consistent profitability edge Mastercard, despite Mastercard’s faster revenue and EPS growth. Visa’s efficiency in converting revenue to profit stands out, making it the fundamental winner in income statement strength. For investors, Visa’s high margin profile offers a more attractive risk-adjusted earnings stability.
Financial Ratios Comparison
These vital ratios act as a diagnostic tool to expose the underlying fiscal health, valuation premiums, and capital efficiency of the companies compared below:
| Ratios | Visa Inc. (V) | Mastercard Inc. (MA) |
|---|---|---|
| ROE | 52.9% | 193.5% |
| ROIC | 28.4% | 48.6% |
| P/E | 33.1 | 34.2 |
| P/B | 17.5 | 66.2 |
| Current Ratio | 1.08 | 1.03 |
| Quick Ratio | 1.08 | 1.03 |
| D/E | 0.66 | 2.46 |
| Debt-to-Assets | 25.3% | 35.1% |
| Interest Coverage | 40.7 | 26.9 |
| Asset Turnover | 0.40 | 0.61 |
| Fixed Asset Turnover | 9.44 | 14.24 |
| Payout Ratio | 23.1% | 18.4% |
| Dividend Yield | 0.70% | 0.54% |
| Fiscal Year | 2025 | 2025 |
Efficiency & Valuation Duel: The Vital Signs
Financial ratios act as the company’s DNA, exposing hidden risks and operational excellence that shape investor confidence and valuation accuracy.
Visa Inc.
Visa displays robust profitability with a 52.91% ROE and a strong 50.14% net margin, signaling exceptional operational efficiency. Its valuation appears stretched with a P/E of 33.05 and P/B of 17.49, reflecting premium pricing. Visa returns modest dividends (0.7%) while focusing on solid capital allocation to sustain growth and shareholder value.
Mastercard Incorporated
Mastercard boasts an extraordinary 193.46% ROE and a 45.65% net margin, underscoring superior profitability and efficient capital use. The stock trades at a slightly higher P/E of 34.21 and a notably elevated P/B of 66.19, suggesting expensive valuation. Dividend yield stands low at 0.54%, with emphasis on reinvestment for future expansion and innovation.
Premium Valuation vs. Operational Safety
Visa balances high profitability with a more moderate valuation, offering steadier risk management. Mastercard’s exceptional returns come with higher leverage and valuation multiples, increasing risk. Investors seeking operational safety might prefer Visa, while those favoring aggressive growth may find Mastercard’s profile fitting.
Which one offers the Superior Shareholder Reward?
Visa delivers a more balanced distribution model with a 0.70% dividend yield and a 23% payout ratio, backed by strong free cash flow coverage near 94%. Its buyback program is steady, enhancing total returns sustainably. Mastercard offers a slightly lower dividend yield at 0.54%, with a more conservative 18% payout ratio but demonstrates aggressive buybacks supported by higher free cash flow per share (19.1 vs. Visa’s 11.1). However, Mastercard’s elevated financial leverage (debt-to-equity above 2.4) raises sustainability concerns. I see Visa’s disciplined capital allocation and lower leverage as superior for long-term shareholder reward in 2026.
Comparative Score Analysis: The Strategic Profile
The radar chart reveals the fundamental DNA and trade-offs of Visa Inc. and Mastercard Incorporated, highlighting their financial strengths and valuation challenges:
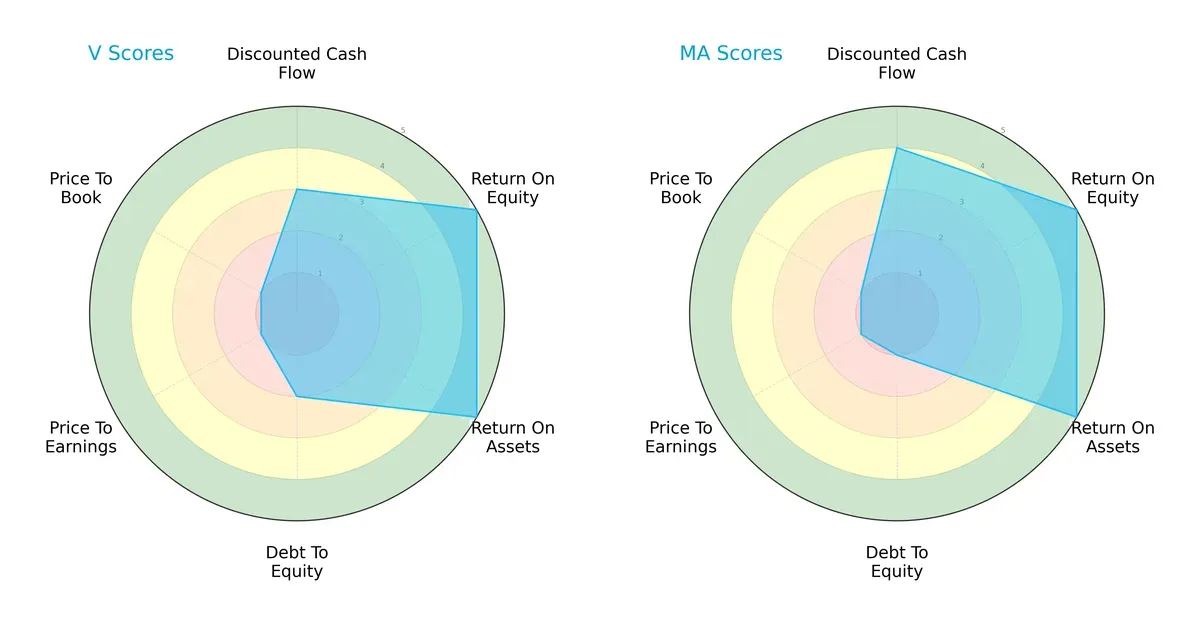
Visa and Mastercard share strong profitability with top ROE and ROA scores of 5 each, reflecting efficient capital and asset use. Mastercard edges Visa on discounted cash flow (4 vs. 3), indicating a slightly better valuation outlook. Visa’s higher debt-to-equity score (2 vs. 1) suggests moderate leverage risk, while both firms face very unfavorable price-to-earnings and price-to-book valuations. Mastercard shows a more balanced risk profile, whereas Visa relies more on operational efficiency.
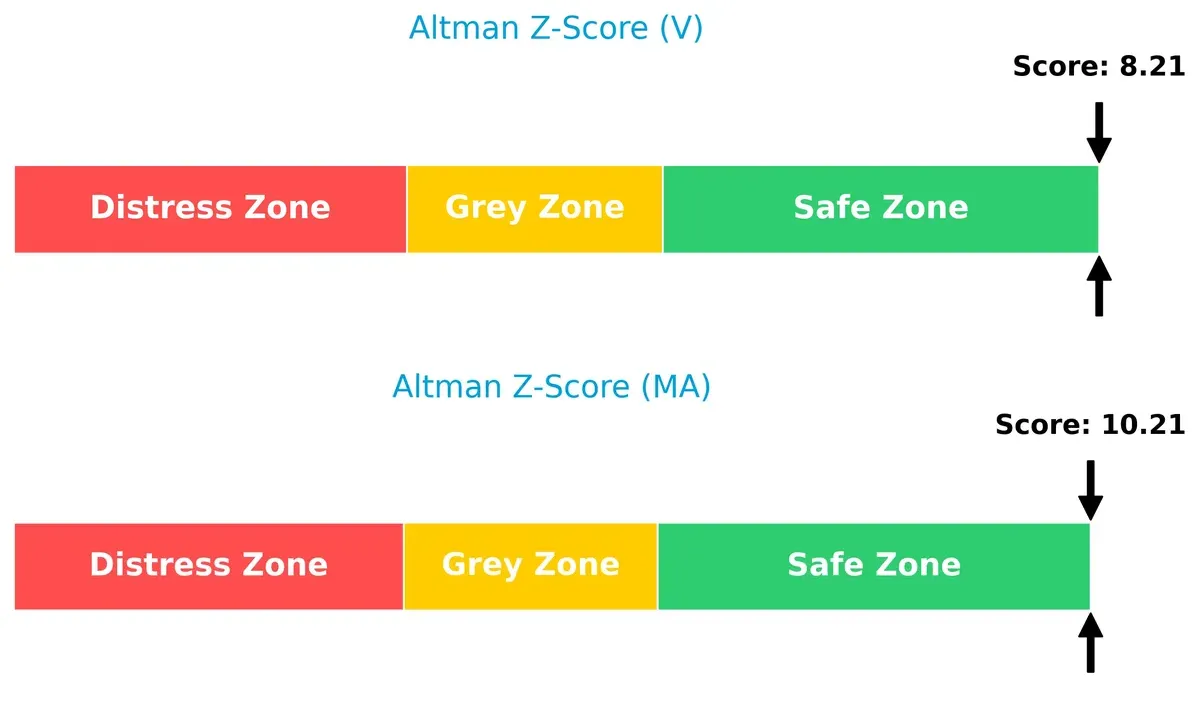
Bankruptcy Risk: Solvency Showdown
The Altman Z-Scores place both Visa (8.2) and Mastercard (10.2) firmly in the safe zone, signaling strong solvency and low bankruptcy risk in the current economic cycle:
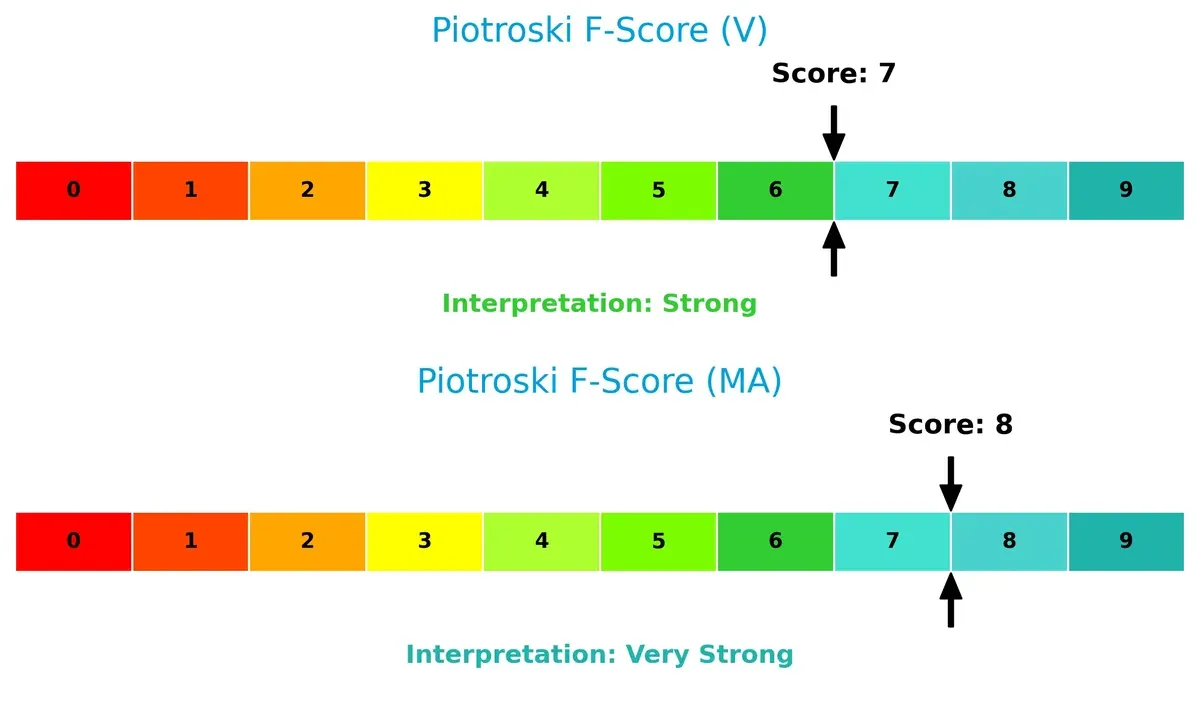
Financial Health: Quality of Operations
Mastercard’s Piotroski F-Score of 8 indicates very strong financial health, surpassing Visa’s strong score of 7. This suggests Mastercard maintains superior internal financial controls and operational efficiency:
How are the two companies positioned?
This section dissects Visa and Mastercard’s operational DNA by comparing revenue distribution and internal strengths and weaknesses. The goal is to confront their economic moats to reveal which model offers the most resilient, sustainable advantage today.
Revenue Segmentation: The Strategic Mix
This visual comparison dissects how Visa Inc. and Mastercard Inc. diversify their income streams and where their primary sector bets lie:
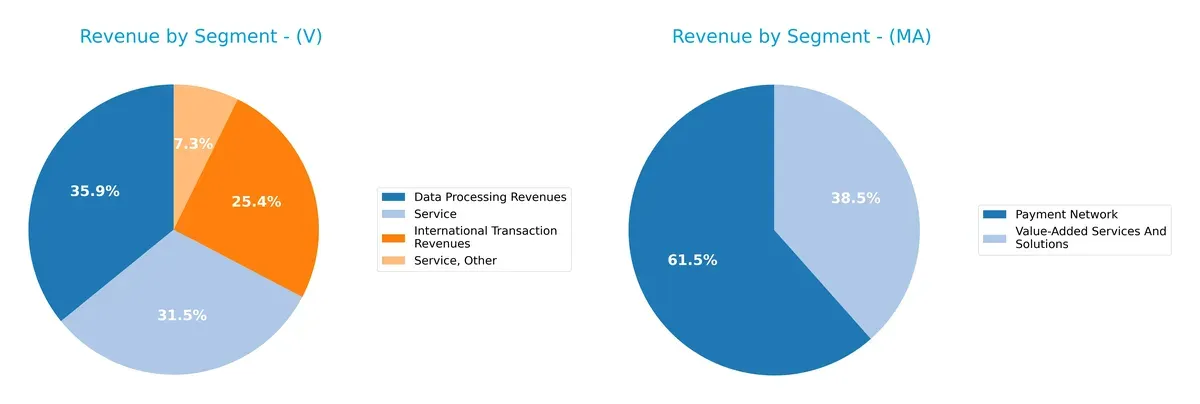
Visa’s revenue pivots around Data Processing ($20B) and Service segments ($18B), showing a moderate diversification. Mastercard relies heavily on its Payment Network segment ($17.3B) and Value-Added Services ($10.8B), indicating a more concentrated but focused model. Visa’s broader base mitigates concentration risk, while Mastercard’s dominance in payment networks anchors its ecosystem lock-in and infrastructure strength.
Strengths and Weaknesses Comparison
This table compares the Strengths and Weaknesses of Visa and Mastercard:
Visa Strengths
- Strong profitability with 50.14% net margin
- High ROE at 52.91%
- Favorable ROIC of 28.36%
- Solid global presence with $24.4B non-US revenue
- Diverse revenue streams including data processing and international transactions
- Favorable fixed asset turnover at 9.44
Mastercard Strengths
- Exceptional ROE of 193.46%
- Higher ROIC at 48.63%
- Strong global presence with $15.8B international revenue
- Diverse revenue from payment network and value-added services
- Favorable fixed asset turnover of 14.24
- Solid net margin at 45.65%
Visa Weaknesses
- Unfavorable P/E of 33.05 and P/B of 17.49 indicating premium valuation
- Asset turnover low at 0.4
- Dividend yield low at 0.7%
- Moderate debt-to-equity at 0.66 (neutral)
- P/B ratio signals possible overvaluation
Mastercard Weaknesses
- Unfavorable P/E of 34.21 and very high P/B of 66.19
- High debt-to-equity ratio at 2.46 raises leverage concerns
- Asset turnover neutral at 0.61
- Low dividend yield at 0.54%
- Higher debt-to-assets at 35.08% (neutral)
Visa shows a balanced financial profile with strong profitability and global reach but faces valuation and efficiency challenges. Mastercard exhibits outstanding returns and asset efficiency but carries higher leverage and valuation risks. These factors shape each company’s strategic focus on growth and risk management.
The Moat Duel: Analyzing Competitive Defensibility
A structural moat is the sole barrier protecting long-term profits from relentless competitive erosion. Let’s dissect how Visa and Mastercard defend their turf:
Visa Inc.: Network Effects Powerhouse
Visa’s moat stems from its massive network effects, driving high 61.96% EBIT margins and 50.14% net margins. Its growing ROIC (+59.6%) signals durable profitability. Expansion into emerging markets in 2026 could deepen this advantage.
Mastercard Incorporated: Technology-Driven Scale
Mastercard leverages advanced technology and global scale, reflected in a superior 41.1% ROIC premium over WACC and 58.1% EBIT margin. It outpaces Visa in revenue growth (16.4% vs. 11.3%). Innovations in digital identity and open banking may accelerate its moat.
Network Effects vs. Tech-Driven Scale: Who Defends Better?
Both firms show very favorable moats with growing ROIC trends. Mastercard’s wider ROIC margin and faster growth suggest a deeper moat. I see Mastercard better positioned to defend and expand its market share in 2026.
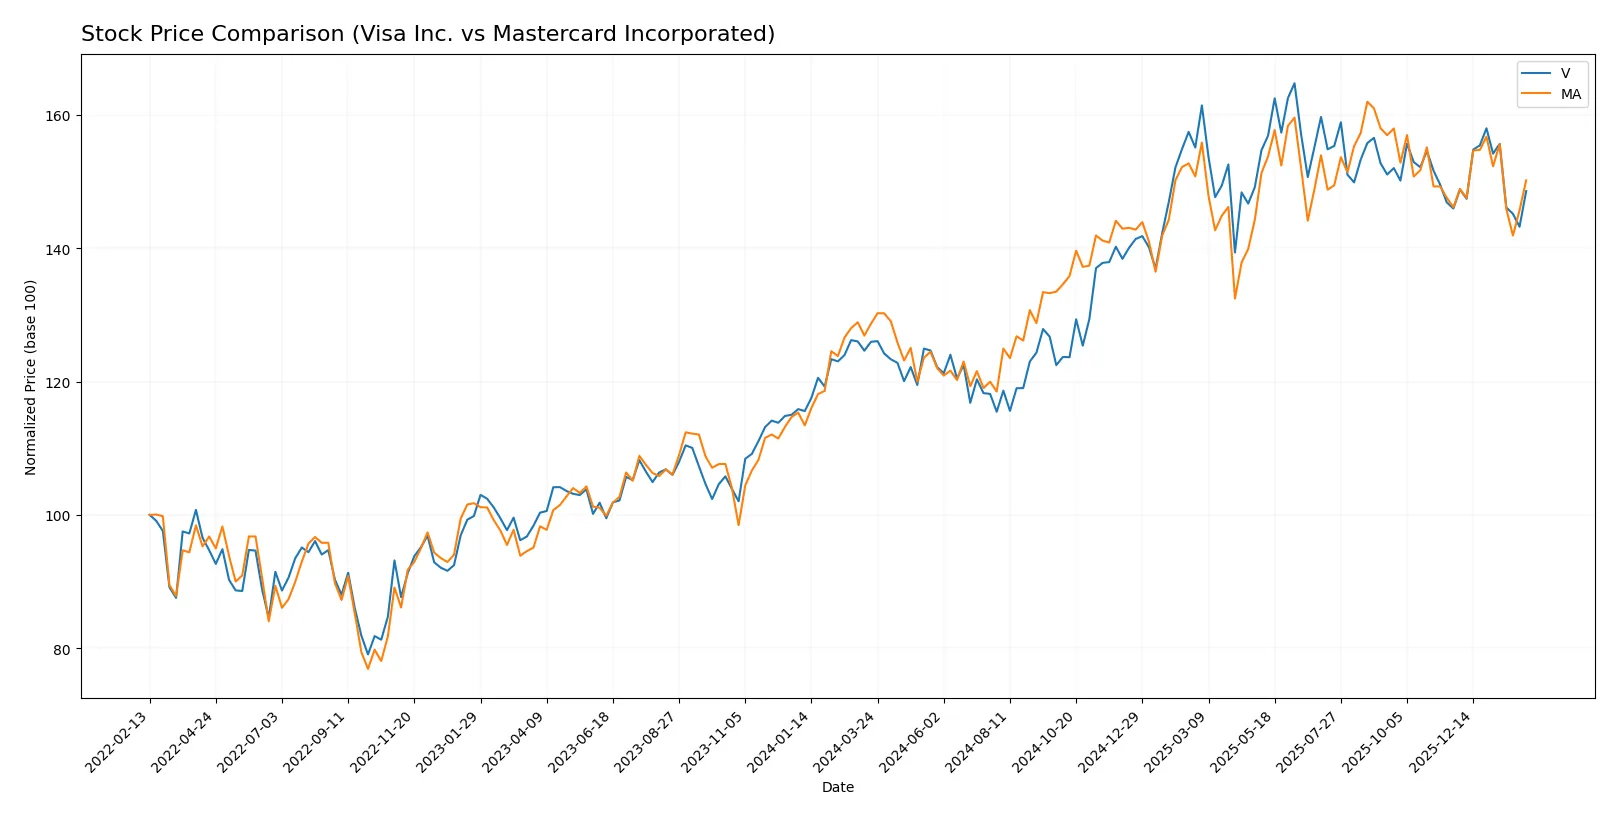
Which stock offers better returns?
The past year shows Visa and Mastercard posting solid gains with slowing momentum. Both stocks reached notable highs while recent months reveal diverging short-term trends.
Trend Comparison
Visa Inc.’s stock rose 17.95% over the last 12 months, marking a bullish trend with decelerating growth. The price ranged from 259.46 to 370.22, showing elevated volatility (std dev 32.81).
Mastercard Incorporated’s stock increased 16.72% over the same period, also bullish but with decelerating acceleration. It traded between 438.18 and 598.96, exhibiting higher volatility (std dev 45.79).
Visa’s recent 2.8-month trend is neutral with a 1.79% gain and slight slope decline. Mastercard’s recent trend is bullish at 2.77% growth but also decelerates. Visa outperformed Mastercard over the full year.
Target Prices
Analysts present a bullish consensus for Visa Inc. and Mastercard Incorporated, reflecting confidence in their growth trajectories.
| Company | Target Low | Target High | Consensus |
|---|---|---|---|
| Visa Inc. | 160 | 425 | 378 |
| Mastercard Inc. | 609 | 739 | 667 |
Visa’s consensus target of 378 is roughly 13% above its current price (334), signaling upside potential. Mastercard’s consensus target at 667 implies about 20% upside from today’s 555.

Don’t Let Luck Decide Your Entry Point
Optimize your entry points with our advanced ProRealTime indicators. You’ll get efficient buy signals with precise price targets for maximum performance. Start outperforming now!
How do institutions grade them?
Visa Inc. Grades
The following table summarizes recent institutional grades for Visa Inc.:
| Grading Company | Action | New Grade | Date |
|---|---|---|---|
| RBC Capital | maintain | Outperform | 2026-01-30 |
| Macquarie | maintain | Outperform | 2026-01-30 |
| Morgan Stanley | maintain | Overweight | 2026-01-30 |
| Cantor Fitzgerald | maintain | Overweight | 2026-01-30 |
| B of A Securities | upgrade | Buy | 2025-12-11 |
| HSBC | upgrade | Buy | 2025-12-08 |
| Macquarie | maintain | Outperform | 2025-10-29 |
| Raymond James | maintain | Outperform | 2025-10-29 |
| UBS | maintain | Buy | 2025-10-29 |
| Baird | maintain | Outperform | 2025-10-06 |
Mastercard Incorporated Grades
The following table summarizes recent institutional grades for Mastercard Incorporated:
| Grading Company | Action | New Grade | Date |
|---|---|---|---|
| Wells Fargo | maintain | Overweight | 2026-01-30 |
| Macquarie | maintain | Outperform | 2026-01-30 |
| JP Morgan | maintain | Overweight | 2026-01-30 |
| TD Cowen | maintain | Buy | 2026-01-30 |
| Raymond James | maintain | Outperform | 2026-01-30 |
| RBC Capital | maintain | Outperform | 2026-01-30 |
| Morgan Stanley | maintain | Overweight | 2026-01-30 |
| Compass Point | upgrade | Buy | 2026-01-13 |
| HSBC | upgrade | Buy | 2025-12-08 |
| Tigress Financial | maintain | Strong Buy | 2025-11-06 |
Which company has the best grades?
Mastercard holds slightly stronger ratings, including a “Strong Buy” from Tigress Financial, compared to Visa’s “Outperform” and “Buy” consensus. This may indicate higher analyst confidence in Mastercard’s near-term growth potential.
Risks specific to each company
The following categories identify the critical pressure points and systemic threats facing both firms in the 2026 market environment:
1. Market & Competition
Visa Inc.
- Dominates payments with VisaNet but faces rising fintech disruption risks.
Mastercard Incorporated
- Strong in integrated payment services, challenged by evolving digital platforms.
2. Capital Structure & Debt
Visa Inc.
- Maintains moderate leverage (D/E 0.66) with solid interest coverage (42.08).
Mastercard Incorporated
- Higher leverage (D/E 2.46) increases financial risk despite adequate coverage (26.39).
3. Stock Volatility
Visa Inc.
- Lower beta (0.78) suggests less sensitivity to market swings.
Mastercard Incorporated
- Slightly higher beta (0.82) indicates greater stock price volatility.
4. Regulatory & Legal
Visa Inc.
- Faces regulatory scrutiny globally on transaction fees and data privacy.
Mastercard Incorporated
- Similar regulatory pressures, especially regarding open banking and data services.
5. Supply Chain & Operations
Visa Inc.
- Relies on stable network infrastructure, low operational disruption risk.
Mastercard Incorporated
- Complex product suite adds operational complexity and integration risk.
6. ESG & Climate Transition
Visa Inc.
- Increasing focus on sustainable payments and carbon footprint reduction.
Mastercard Incorporated
- Aggressive ESG initiatives, but higher exposure through broader service portfolio.
7. Geopolitical Exposure
Visa Inc.
- Moderate exposure with strategic partnerships in emerging markets.
Mastercard Incorporated
- Extensive global footprint increases risk from geopolitical tensions.
Which company shows a better risk-adjusted profile?
Visa’s moderate leverage and lower stock volatility provide a more balanced risk profile. Mastercard’s higher debt levels and greater operational complexity elevate its financial and operational risks. However, Mastercard’s very strong Piotroski score and Altman Z-score indicate robust financial health despite these risks. Visa’s main risk lies in fintech disruption; Mastercard’s is its capital structure. Visa edges out slightly for prudent risk management in 2026.
Final Verdict: Which stock to choose?
Visa’s superpower lies in its unmatched capital efficiency and durable competitive advantage. Its strong ROIC comfortably exceeds its cost of capital, signaling consistent value creation. A point of vigilance is its high price-to-book ratio, which suggests a stretched valuation. Visa suits portfolios targeting steady, high-quality growth.
Mastercard commands a strategic moat through exceptional return on equity and a robust growth trajectory. It exhibits a slightly riskier leverage profile than Visa but compensates with stronger earnings growth and cash flow generation. Mastercard fits well with growth-at-a-reasonable-price (GARP) investors seeking dynamic exposure with a safety cushion.
If you prioritize capital efficiency and stable value creation, Visa is the compelling choice due to its proven durable moat and operational discipline. However, if you seek amplified growth potential with a tolerance for higher leverage, Mastercard offers better growth metrics and stronger earnings momentum. Both stocks carry premium valuations, requiring careful assessment of risk tolerance.
Disclaimer: Investment carries a risk of loss of initial capital. The past performance is not a reliable indicator of future results. Be sure to understand risks before making an investment decision.
Go Further
I encourage you to read the complete analyses of Visa Inc. and Mastercard Incorporated to enhance your investment decisions: