Home > Comparison > Financial Services > MA vs SYF
The strategic rivalry between Mastercard Incorporated and Synchrony Financial shapes the competitive landscape of the financial services sector. Mastercard operates as a technology-driven transaction processor with a global footprint, while Synchrony focuses on consumer credit products and retail partnerships. This head-to-head contrasts Mastercard’s scalable, low-capital model with Synchrony’s asset-heavy lending approach. This analysis will assess which business model delivers superior risk-adjusted returns for a diversified investment portfolio.

Table of contents
Companies Overview
Mastercard and Synchrony Financial stand as key players in the U.S. credit services sector, shaping consumer and commercial finance.
Mastercard Incorporated: Global Payment Technology Leader
Mastercard dominates as a technology-driven payment processor facilitating authorization, clearing, and settlement worldwide. Its core revenue arises from transaction fees and value-added services like cyber security and analytics. In 2026, Mastercard focuses on expanding its open banking and digital identity platforms to enhance seamless payment experiences.
Synchrony Financial: Consumer Credit Specialist
Synchrony Financial excels as a consumer finance company, generating revenue primarily through credit products including private label and co-branded cards, and installment loans. The 2026 strategy centers on deepening partnerships with retailers and healthcare providers, leveraging point-of-sale financing and deposit products to diversify its consumer offerings.
Strategic Collision: Similarities & Divergences
Both firms operate in credit services but diverge sharply in business models: Mastercard champions an open payments ecosystem, while Synchrony emphasizes closed partnerships with retailers. Their battleground lies in consumer credit access and financing innovation. Mastercard offers broad technology solutions; Synchrony delivers targeted credit products, reflecting distinct risk profiles and growth avenues.
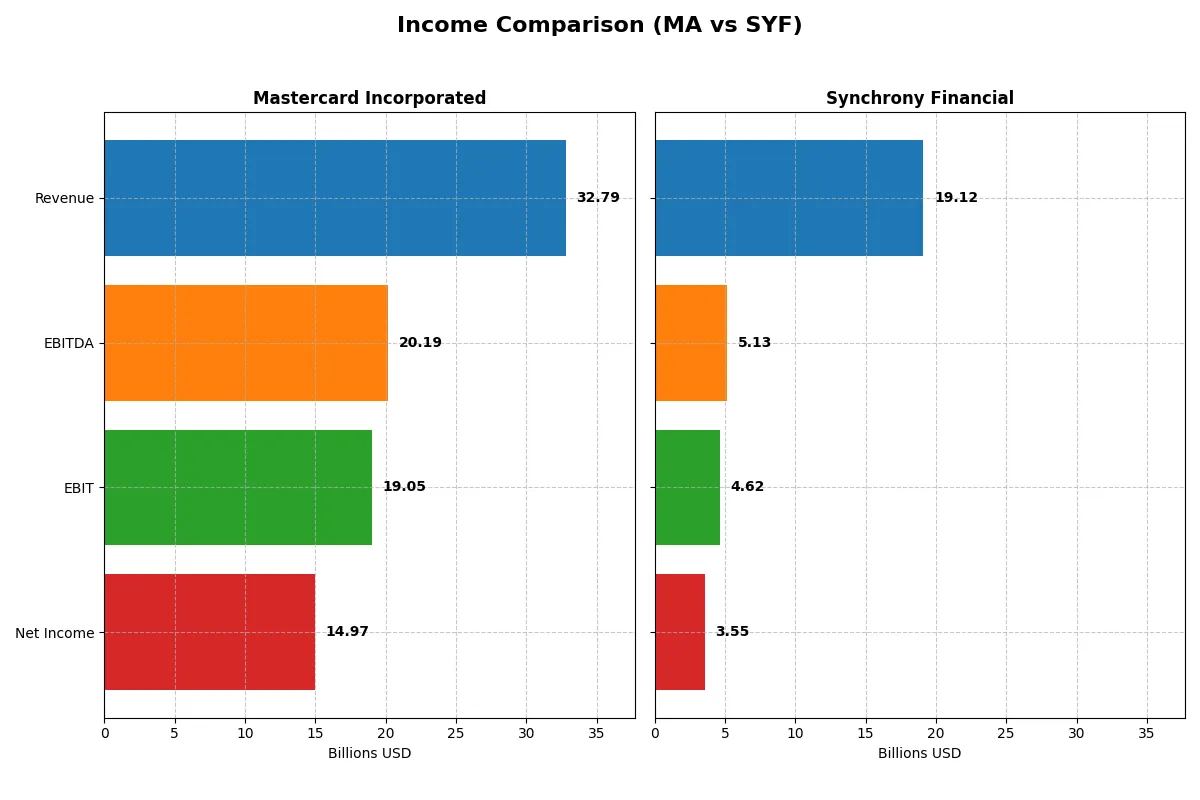
Income Statement Comparison
This data dissects the core profitability and scalability of both corporate engines to reveal who dominates the bottom line:
| Metric | Mastercard (MA) | Synchrony Financial (SYF) |
|---|---|---|
| Revenue | 32.8B | 19.1B |
| Cost of Revenue | 5.4B | 9.4B |
| Operating Expenses | 7.96B | 5.14B |
| Gross Profit | 27.4B | 9.8B |
| EBITDA | 20.2B | 5.14B |
| EBIT | 19.1B | 4.62B |
| Interest Expense | 722M | 4.14B |
| Net Income | 14.97B | 3.55B |
| EPS | 16.55 | 9.35 |
| Fiscal Year | 2025 | 2025 |
Income Statement Analysis: The Bottom-Line Duel
This income statement comparison reveals which company runs a more efficient and profitable operation in the current market environment.
Mastercard Incorporated Analysis
Mastercard’s revenue surged from 18.9B in 2021 to 32.8B in 2025, marking a robust growth trajectory. Net income climbed sharply to 14.97B in 2025, demonstrating strong bottom-line momentum. Its gross margin remains exceptionally healthy at 83.4%, and a net margin of 45.7% confirms superior profitability. Despite a slight dip in net margin growth, Mastercard’s operational efficiency and expanding earnings per share reflect sustained strength.
Synchrony Financial Analysis
Synchrony’s revenue grew from 11.2B in 2021 to a peak of 20.8B in 2024 but then declined 7.9% to 19.1B in 2025. Net income fell to 3.55B in 2025, down from earlier highs, indicating pressure on profitability. Gross margin stands at a moderate 51%, with net margin at 18.6%, both modest compared to Mastercard. Interest expense weighs heavily at 21.6%, dampening net profits. While EPS improved 8.6% last year, overall income growth is uneven and less efficient.
Margin Dominance vs. Revenue Fluctuations
Mastercard outperforms Synchrony with superior margins and consistent net income growth, reflecting a more efficient business model. Synchrony struggles with higher interest costs and recent revenue declines, limiting profitability gains. For investors prioritizing stable margins and earnings quality, Mastercard’s profile offers clearer fundamental strength and resilience.
Financial Ratios Comparison
These vital ratios act as a diagnostic tool to expose the underlying fiscal health, valuation premiums, and capital efficiency of these companies:
| Ratios | Mastercard (MA) | Synchrony Financial (SYF) |
|---|---|---|
| ROE | 193% | 21% |
| ROIC | 49% | 9% |
| P/E | 34.2 | 8.4 |
| P/B | 66.2 | 1.78 |
| Current Ratio | 1.03 | 0.21 |
| Quick Ratio | 1.03 | 0.21 |
| D/E | 2.46 | 0.91 |
| Debt-to-Assets | 35.1% | 12.7% |
| Interest Coverage | 26.9 | 1.12 |
| Asset Turnover | 0.61 | 0.16 |
| Fixed Asset Turnover | 14.2 | N/A |
| Payout Ratio | 18.4% | 14.4% |
| Dividend Yield | 0.54% | 1.71% |
| Fiscal Year | 2025 | 2025 |
Efficiency & Valuation Duel: The Vital Signs
Ratios act as a company’s DNA, revealing hidden risks and operational strengths that raw numbers often mask.
Mastercard Incorporated
Mastercard impresses with a stellar ROE of 193% and a high net margin of 45.65%, signaling exceptional profitability. However, its P/E ratio at 34.21 suggests the stock trades at a premium. Dividend yield is modest at 0.54%, indicating capital is mostly reinvested or returned through buybacks to sustain growth and maintain its operational edge.
Synchrony Financial
Synchrony posts a much lower ROE of 21.19% and a net margin of 18.58%, reflecting moderate profitability. The P/E ratio of 8.41 points to an attractively valued stock. Dividend yield at 1.71% offers some income, while reinvestment appears focused on steady operational improvements rather than aggressive growth.
Premium Valuation vs. Operational Safety
Mastercard commands a premium valuation justified by strong returns and efficient asset use, while Synchrony offers a more conservative profile with lower profitability but attractive valuation. Investors seeking growth and operational excellence lean toward Mastercard; those prioritizing value and income might prefer Synchrony.
Which one offers the Superior Shareholder Reward?
I compare Mastercard (MA) and Synchrony Financial (SYF) on dividends, payout ratios, and buybacks. Mastercard yields ~0.54% with a 18% payout ratio, supported by strong free cash flow (FCF) coverage near 97%. Synchrony offers a higher yield of ~1.7%, but with a lower payout ratio around 14%, reflecting a conservative distribution amid weaker cash flow ratios. Mastercard’s buyback program is aggressive, enhancing total return sustainably through robust margins and capital allocation. Synchrony’s buybacks, though present, are less intensive and challenged by leverage and low liquidity ratios. I conclude Mastercard’s balance of dividends and buybacks delivers a superior, sustainable shareholder reward in 2026.
Comparative Score Analysis: The Strategic Profile
The radar chart reveals the fundamental DNA and trade-offs of Mastercard and Synchrony Financial, highlighting their distinct competitive advantages and valuation nuances:
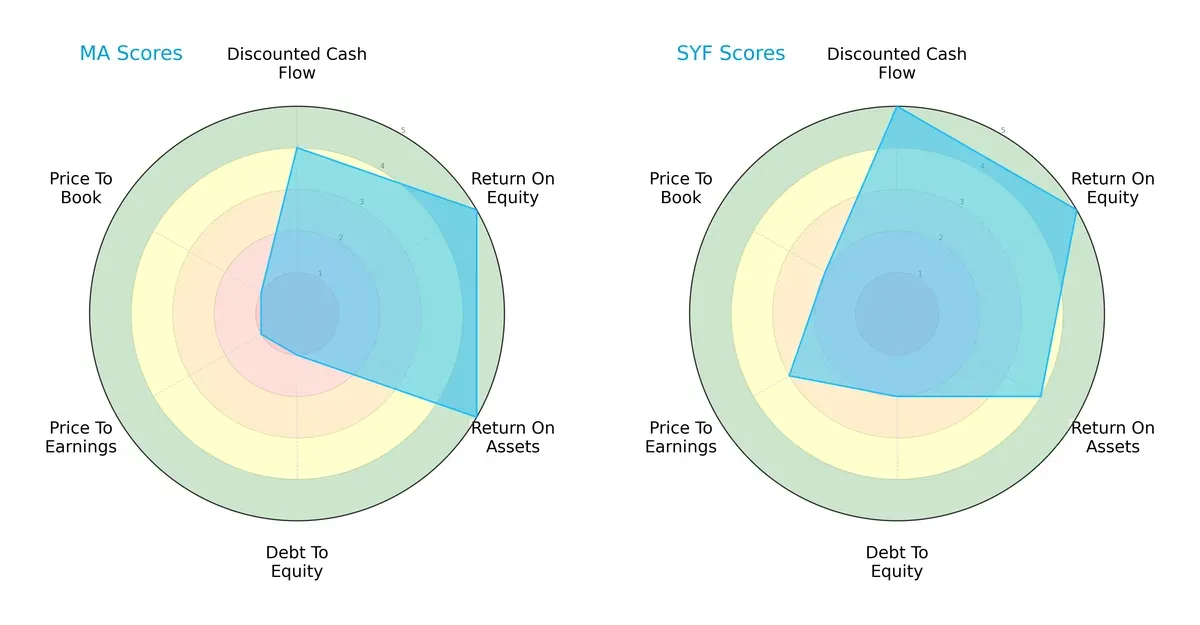
Mastercard shows strength in ROE and ROA with top scores of 5, but suffers from very unfavorable debt-to-equity and valuation metrics (scores of 1). Synchrony balances a slightly lower ROA (4) with better debt management (score 2) and more moderate valuation scores (P/E at 3, P/B at 2). Synchrony presents a more balanced profile, while Mastercard relies heavily on operational efficiency but appears overvalued and highly leveraged.
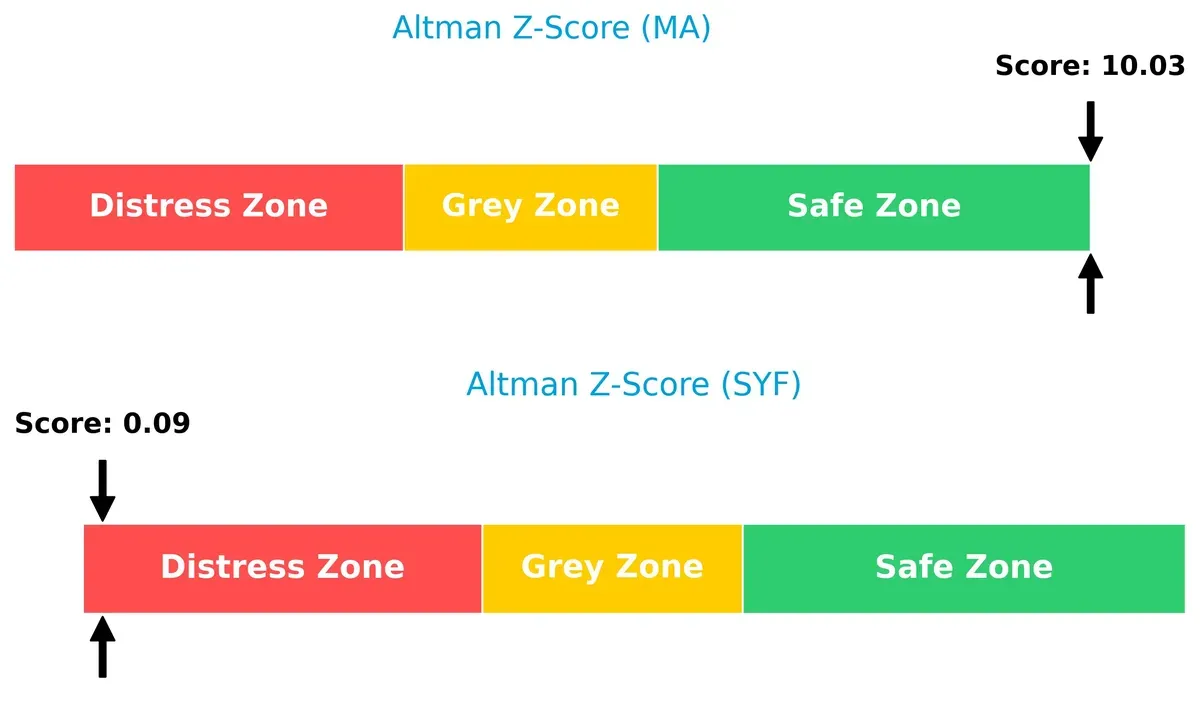
Bankruptcy Risk: Solvency Showdown
Mastercard’s Altman Z-Score of 10.03 places it firmly in the safe zone, signaling robust financial health. Synchrony’s 0.09 score lands in the distress zone, raising red flags about its long-term survival in the current economic cycle:
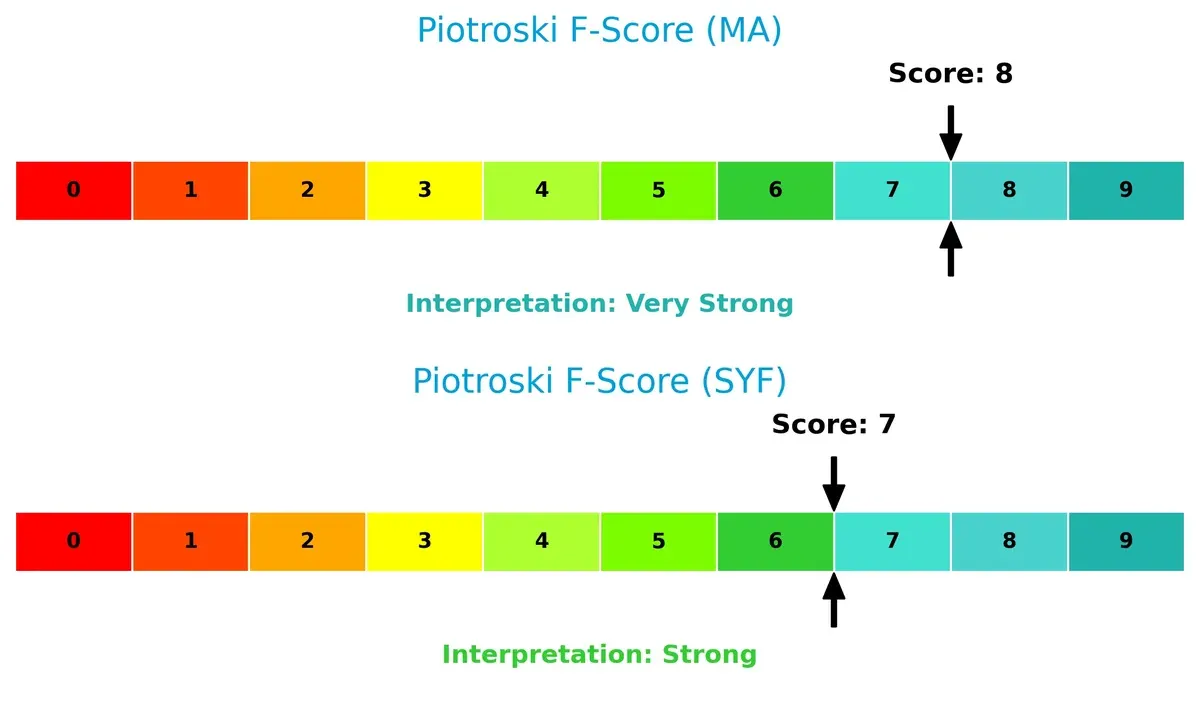
Financial Health: Quality of Operations
Mastercard’s Piotroski F-Score of 8 signals very strong financial health and operational quality. Synchrony’s score of 7 is strong but indicates minor concerns relative to Mastercard’s near-peak internal metrics:
How are the two companies positioned?
This section dissects the operational DNA of Mastercard and Synchrony by comparing their revenue distribution and internal dynamics. The goal is to confront their economic moats to identify the most resilient and sustainable competitive advantage in today’s financial services landscape.
Revenue Segmentation: The Strategic Mix
This visual comparison dissects how Mastercard Incorporated and Synchrony Financial diversify income streams and where their primary sector bets lie:
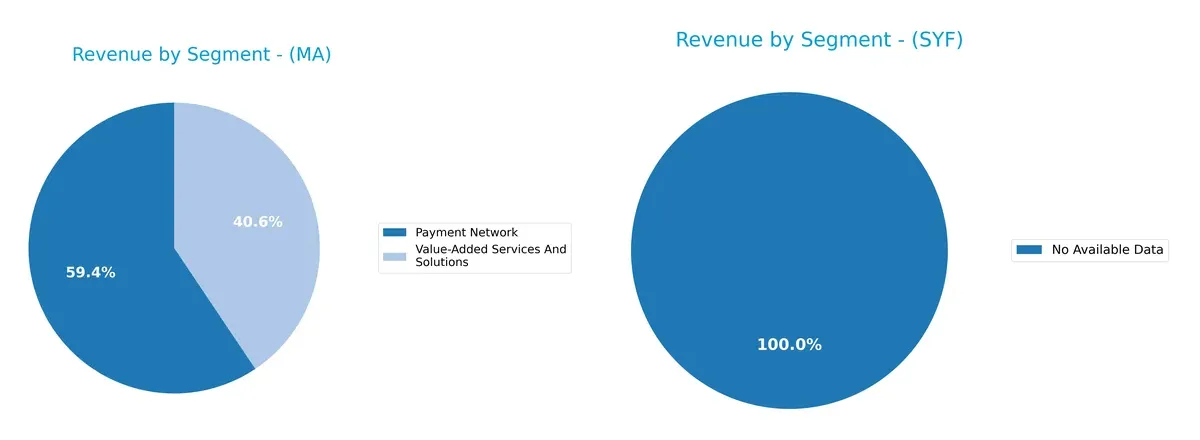
Mastercard anchors revenue heavily in Payment Network at $19.5B, with Value-Added Services adding $13.3B, showing a balanced yet network-centric mix. Synchrony Financial lacks available segment data, preventing direct comparison. Mastercard’s dual focus supports ecosystem lock-in and infrastructure dominance, reducing concentration risk. This diversification fuels resilience, contrasting sharply with firms reliant on single-source revenue.
Strengths and Weaknesses Comparison
This table compares the strengths and weaknesses of Mastercard and Synchrony Financial:
Mastercard Strengths
- High profitability with net margin 45.65% and ROE 193.46%
- Strong ROIC 48.63% well above WACC 7.32%
- Diverse revenue from Payment Network and Value-Added Services
- Significant global presence with $18.7B in international markets
- Favorable liquidity with quick ratio 1.03
- High asset efficiency with fixed asset turnover 14.24
Synchrony Financial Strengths
- Favorable net margin 18.58% and ROE 21.19%
- Attractive valuation with P/E 8.41 and neutral P/B 1.78
- Low debt to assets 12.75% supports financial stability
- Dividend yield 1.71% provides income potential
Mastercard Weaknesses
- High valuation multiples with P/E 34.21 and P/B 66.19
- Elevated debt to equity 2.46 introduces leverage risk
- Low dividend yield 0.54% may deter income investors
- Neutral current ratio 1.03 limits short-term liquidity cushion
Synchrony Financial Weaknesses
- Low current and quick ratios 0.21 highlight liquidity concerns
- Interest coverage 1.12 barely covers debt cost
- Weak asset turnover 0.16 and zero fixed asset turnover show inefficiency
- Higher WACC 14.2% signals costly capital
Mastercard’s strengths lie in robust profitability, global reach, and efficient asset use, offset by high valuation and leverage. Synchrony shows decent profitability and valuation but faces liquidity and operational efficiency challenges. These factors define each company’s strategic positioning in their markets.
The Moat Duel: Analyzing Competitive Defensibility
A structural moat is the only reliable shield protecting long-term profits from relentless competition erosion:
Mastercard Incorporated: Network Effects Powerhouse
Mastercard’s dominant network effects deliver sky-high ROIC (41%+ above WACC) and margin stability. Its expanding international footprint and digital innovation deepen this moat in 2026.
Synchrony Financial: Capital Intensity Challenge
Synchrony relies on credit product specialization but suffers from declining ROIC and rising interest costs. Its shrinking economic moat limits growth and heightens vulnerability to market disruptions.
Network Effects vs. Capital Efficiency: The Core Moat Battle
Mastercard’s robust, growing network effects create a far wider and deeper moat than Synchrony’s capital-heavy model. Mastercard stands better equipped to defend and expand its market share.
Which stock offers better returns?
The past year shows Mastercard’s price rising 7.62%, then declining recently, while Synchrony Financial gained 71.79% with a milder recent pullback.
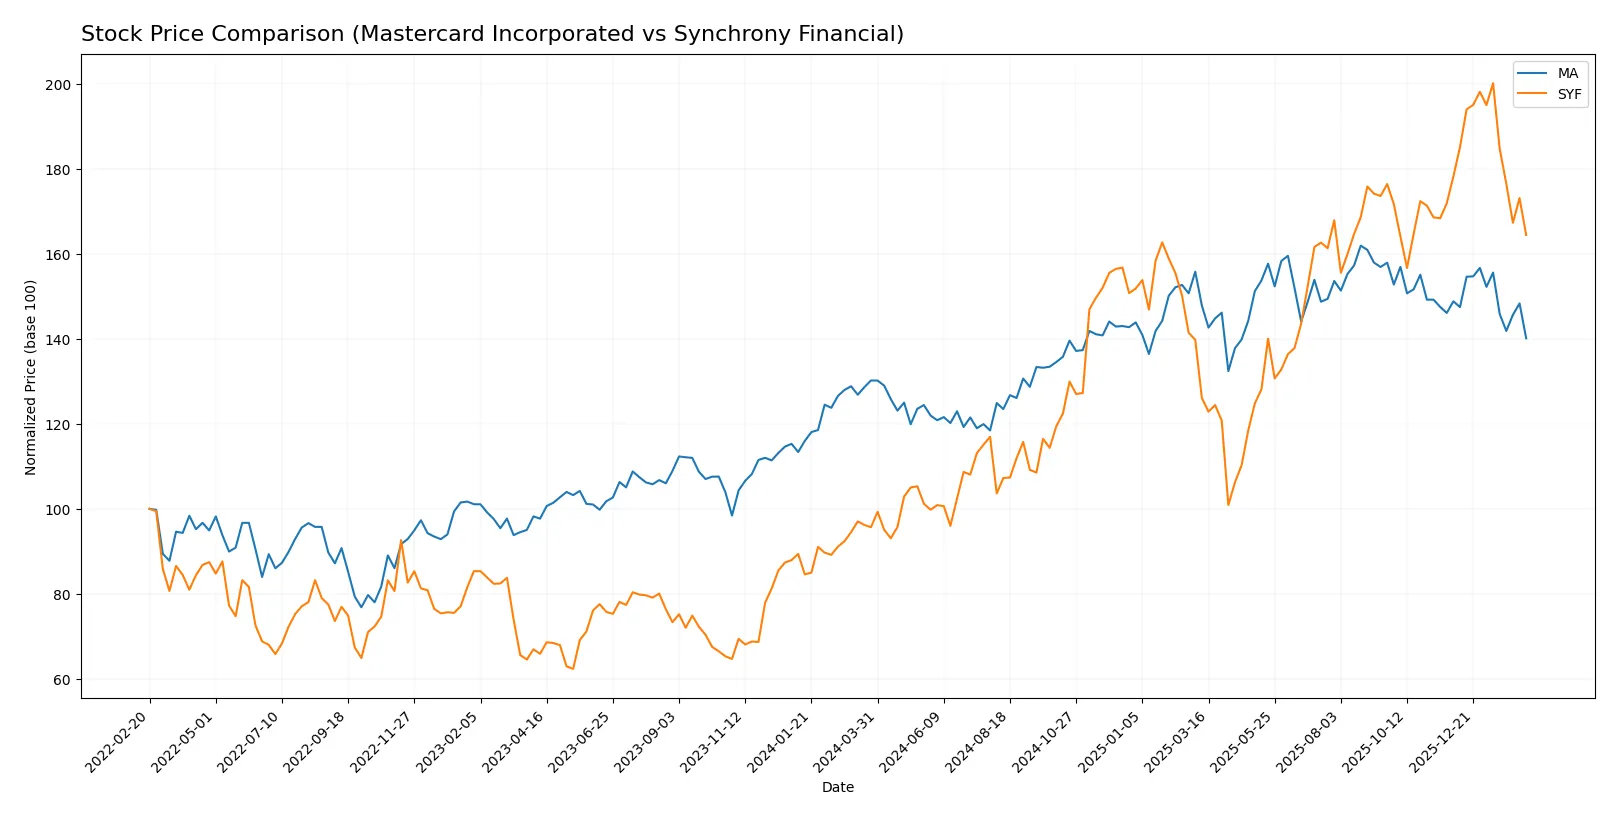
Trend Comparison
Mastercard’s stock gained 7.62% over 12 months, marking a bullish trend with decelerating momentum and a high volatility of 45.5. It recently declined by 5.84%.
Synchrony Financial surged 71.79% over the same period, also bullish but with lower volatility at 12.78. Its recent drop was 7.73%, showing deceleration.
Synchrony Financial outperformed Mastercard significantly in market returns despite both showing recent declines and slower acceleration trends.
Target Prices
Analysts project strong upside potential for Mastercard and Synchrony Financial based on consensus targets.
| Company | Target Low | Target High | Consensus |
|---|---|---|---|
| Mastercard Incorporated | 610 | 739 | 667 |
| Synchrony Financial | 81 | 100 | 90.08 |
Mastercard’s consensus target of 667 suggests a 29% upside from the current 518 price, signaling robust growth expectations. Synchrony’s target near 90 also implies a notable 26% gain, indicating market confidence despite its higher beta risk.

Don’t Let Luck Decide Your Entry Point
Optimize your entry points with our advanced ProRealTime indicators. You’ll get efficient buy signals with precise price targets for maximum performance. Start outperforming now!
How do institutions grade them?
This section compares the recent institutional grades assigned to Mastercard Incorporated and Synchrony Financial:
Mastercard Incorporated Grades
Below are the latest grades from recognized financial institutions for Mastercard Incorporated.
| Grading Company | Action | New Grade | Date |
|---|---|---|---|
| TD Cowen | Maintain | Buy | 2026-01-30 |
| Wells Fargo | Maintain | Overweight | 2026-01-30 |
| JP Morgan | Maintain | Overweight | 2026-01-30 |
| Raymond James | Maintain | Outperform | 2026-01-30 |
| Morgan Stanley | Maintain | Overweight | 2026-01-30 |
| RBC Capital | Maintain | Outperform | 2026-01-30 |
| Macquarie | Maintain | Outperform | 2026-01-30 |
| Compass Point | Upgrade | Buy | 2026-01-13 |
| HSBC | Upgrade | Buy | 2025-12-08 |
| Tigress Financial | Maintain | Strong Buy | 2025-11-06 |
Synchrony Financial Grades
The following table lists recent grades from reputable firms for Synchrony Financial.
| Grading Company | Action | New Grade | Date |
|---|---|---|---|
| Baird | Upgrade | Outperform | 2026-02-13 |
| Truist Securities | Maintain | Hold | 2026-01-29 |
| RBC Capital | Maintain | Sector Perform | 2026-01-28 |
| JP Morgan | Maintain | Neutral | 2026-01-28 |
| BTIG | Maintain | Buy | 2026-01-28 |
| Barclays | Maintain | Overweight | 2026-01-28 |
| JP Morgan | Maintain | Neutral | 2026-01-12 |
| TD Cowen | Maintain | Buy | 2026-01-08 |
| Barclays | Maintain | Overweight | 2026-01-06 |
| Wells Fargo | Maintain | Overweight | 2026-01-05 |
Which company has the best grades?
Mastercard holds consistently higher grades, including multiple “Outperform” and “Strong Buy” ratings. Synchrony’s grades cluster around “Buy” and “Outperform” but include several “Neutral” and “Hold” stances. This suggests Mastercard receives stronger institutional conviction, potentially influencing investor confidence and valuation.
Risks specific to each company
The following categories identify the critical pressure points and systemic threats facing both firms in the 2026 market environment:
1. Market & Competition
Mastercard Incorporated
- Operates globally with strong brand moat; faces intense competition from fintech disruptors.
Synchrony Financial
- Primarily US-focused with niche retail partnerships; exposed to credit risk from consumer defaults.
2. Capital Structure & Debt
Mastercard Incorporated
- Higher debt-to-equity ratio (2.46) signals leveraged balance sheet but strong interest coverage (26.39).
Synchrony Financial
- Lower leverage (0.91) but concerning interest coverage (1.12) and weak current ratio (0.21) imply liquidity risk.
3. Stock Volatility
Mastercard Incorporated
- Beta of 0.82 shows relative stability versus market; large market cap supports liquidity.
Synchrony Financial
- Beta of 1.40 indicates higher volatility; smaller market cap may exacerbate price swings.
4. Regulatory & Legal
Mastercard Incorporated
- Subject to global payment regulations and data privacy laws; proactive compliance mitigates risks.
Synchrony Financial
- Faces stringent US consumer credit regulations; rising regulatory scrutiny on lending practices.
5. Supply Chain & Operations
Mastercard Incorporated
- Relies on robust technology infrastructure; potential cyber risk but diversified service offerings.
Synchrony Financial
- Dependent on retail partners and credit underwriting; operational risk tied to consumer credit performance.
6. ESG & Climate Transition
Mastercard Incorporated
- Advanced ESG initiatives, digital identity, and open banking platforms support climate resilience.
Synchrony Financial
- ESG efforts less visible; potential exposure to credit risk from climate-affected sectors.
7. Geopolitical Exposure
Mastercard Incorporated
- Global footprint exposes it to currency and geopolitical tensions but also diversification benefits.
Synchrony Financial
- US-centric operations limit geopolitical risk but increase vulnerability to domestic policy shifts.
Which company shows a better risk-adjusted profile?
Mastercard’s dominant market position and strong financial health cushion it against competitive and operational risks. Synchrony faces higher liquidity and credit risks, as reflected in its weak current ratios and distress-level Altman Z-score. Mastercard’s stable beta and safe-zone bankruptcy score underscore a superior risk-adjusted profile in 2026.
Final Verdict: Which stock to choose?
Mastercard’s superpower lies in its unmatched efficiency and robust economic moat, driven by a soaring ROIC well above its cost of capital. This cash-generating machine commands premium valuation multiples, signaling market confidence but also a point of vigilance for valuation risk. It suits portfolios focused on aggressive growth and durable competitive advantages.
Synchrony Financial’s strategic moat is rooted in its value proposition as a high free cash flow yield play with a compelling valuation. While it lacks Mastercard’s fortress-like profitability, its lower multiples and strong free cash flow appeal to investors seeking income and value. It fits well within GARP (Growth at a Reasonable Price) portfolios with a tolerance for operational and liquidity risk.
If you prioritize sustainable competitive advantages and superior capital efficiency, Mastercard outshines due to its consistent value creation and premium growth profile. However, if you seek better stability from valuation and cash flow yield, Synchrony offers an attractive analytical scenario despite its challenges in profitability and liquidity metrics. Each stock caters to distinct investor avatars balancing growth versus value trade-offs.
Disclaimer: Investment carries a risk of loss of initial capital. The past performance is not a reliable indicator of future results. Be sure to understand risks before making an investment decision.
Go Further
I encourage you to read the complete analyses of Mastercard Incorporated and Synchrony Financial to enhance your investment decisions: