Home > Comparison > Industrials > TT vs MAS
The strategic rivalry between Trane Technologies plc and Masco Corporation shapes the Industrials sector’s future. Trane Technologies operates as a capital-intensive provider of HVAC and refrigeration solutions, while Masco Corporation excels as a diversified manufacturer of home improvement and building products. This analysis pits Trane’s industrial innovation against Masco’s broad consumer reach, aiming to identify which path offers superior risk-adjusted returns for a well-diversified portfolio in today’s complex market environment.
Table of contents
Companies Overview
Trane Technologies and Masco Corporation both hold significant footprints in the industrial construction market.
Trane Technologies plc: Global Climate Control Leader
Trane Technologies dominates the heating, ventilation, and air conditioning (HVAC) sector. It generates revenue through designing, manufacturing, selling, and servicing HVAC and transport refrigeration solutions globally. In 2026, it focuses strategically on innovation in energy-efficient systems and expanding its sustainable product portfolio to meet rising environmental standards.
Masco Corporation: Home Improvement Powerhouse
Masco Corporation leads in home improvement and building products, specializing in plumbing and decorative architectural segments. It earns through manufacturing and distributing faucets, paint, hardware, and lighting under multiple well-known brands. In 2026, Masco prioritizes expanding its connected water products and broadening its reach in North American and international markets.
Strategic Collision: Similarities & Divergences
Both companies emphasize industrial construction markets but diverge in approach: Trane Technologies invests heavily in climate control innovation and sustainability, while Masco excels in consumer-focused home improvement solutions. Their battleground lies in energy efficiency and smart home integration. Trane appeals as a technology-driven industrial play; Masco offers exposure to consumer staples within the building sector.
Income Statement Comparison
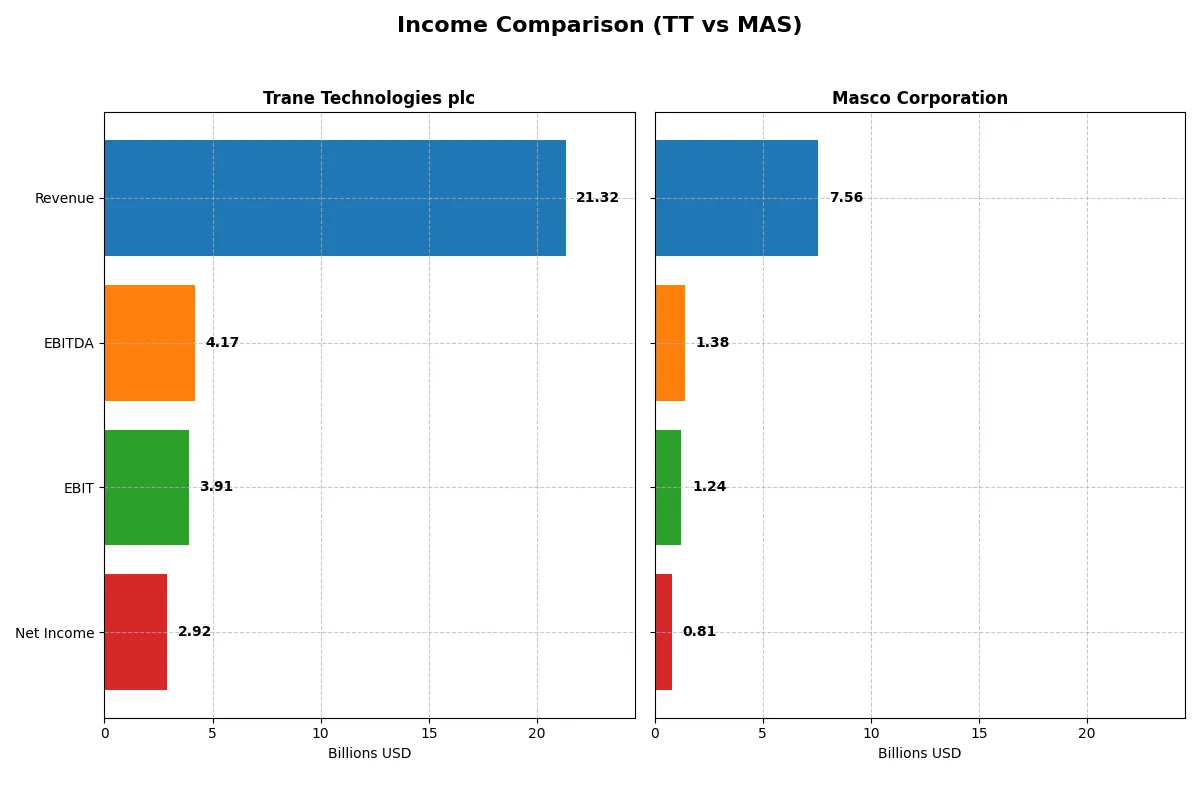
This data dissects the core profitability and scalability of both corporate engines, revealing who dominates the bottom line in the latest fiscal year:
| Metric | Trane Technologies plc (TT) | Masco Corporation (MAS) |
|---|---|---|
| Revenue | 21.3B | 7.56B |
| Cost of Revenue | 13.6B | 4.88B |
| Operating Expenses | 3.74B | 1.42B |
| Gross Profit | 7.71B | 2.69B |
| EBITDA | 4.17B | 1.38B |
| EBIT | 3.91B | 1.24B |
| Interest Expense | 228M | 101M |
| Net Income | 2.92B | 810M |
| EPS | 13.09 | 3.88 |
| Fiscal Year | 2025 | 2025 |
Income Statement Analysis: The Bottom-Line Duel
This income statement comparison reveals which company operates its business more efficiently and converts sales into profits with greater effectiveness.
Trane Technologies plc Analysis
Trane Technologies shows strong revenue growth, climbing from 14.1B in 2021 to 21.3B in 2025. Net income more than doubles over the period, reaching 2.9B in 2025. Margins remain robust, with a gross margin above 36% and net margin near 14%. In 2025, EBIT margin expands to 18.3%, signaling improved operational efficiency and solid momentum.
Masco Corporation Analysis
Masco’s revenue declines over five years, falling from 8.4B in 2021 to 7.6B in 2025, reflecting a challenging top line. Despite this, net income nearly doubles, hitting 810M in 2025. Margins remain stable with a gross margin around 35.5% and net margin at 10.7%. EBIT margin stands at 16.3% in 2025, indicating cost control offsetting revenue softness but limited growth momentum.
Margin Dominance vs. Revenue Expansion
Trane Technologies dominates with a superior revenue growth trajectory and higher margins, delivering significant bottom-line expansion. Masco shows resilience by boosting profits despite shrinking revenue, but its slower growth and lower margins lag behind. Investors seeking growth and efficiency may favor Trane’s profile, while Masco suits those prioritizing steady profitability amid headwinds.
Financial Ratios Comparison
These vital ratios act as a diagnostic tool to expose the underlying fiscal health, valuation premiums, and capital efficiency of each company:
| Ratios | Trane Technologies plc (TT) | Masco Corporation (MAS) |
|---|---|---|
| ROE | 33.9% | -435.5% |
| ROIC | 20.3% | 26.2% |
| P/E | 29.8 | 16.4 |
| P/B | 10.1 | -71.3 |
| Current Ratio | 1.25 | 1.81 |
| Quick Ratio | 0.92 | 1.14 |
| D/E | 0.54 | -18.5 |
| Debt-to-Assets | 21.5% | 66.1% |
| Interest Coverage | 17.4 | 12.6 |
| Asset Turnover | 1.00 | 1.45 |
| Fixed Asset Turnover | 9.47 | 5.30 |
| Payout ratio | 28.7% | 32.2% |
| Dividend yield | 0.96% | 1.97% |
| Fiscal Year | 2025 | 2025 |
Efficiency & Valuation Duel: The Vital Signs
Financial ratios serve as the company’s DNA, unveiling hidden risks and operational strengths critical for investment decisions.
Trane Technologies plc
Trane Technologies reports a robust 33.9% ROE and a strong 13.7% net margin, showcasing operational efficiency. However, its valuation looks stretched with a P/E near 30 and a P/B over 10. Dividend yield lags at 0.96%, indicating modest shareholder returns amid reinvestment in growth and R&D.
Masco Corporation
Masco posts a solid 10.7% net margin and an impressive 26.2% ROIC, reflecting efficient capital use. Its P/E of 16.4 suggests a reasonable valuation. Despite a negative ROE, Masco offers a higher dividend yield near 2%, balancing profitability concerns with consistent shareholder payouts.
Valuation Stretched vs. Capital Efficiency: Risk-Reward Balance
Trane excels operationally but at a premium valuation, while Masco offers stronger capital efficiency with a more moderate price. Investors seeking growth with some yield may prefer Masco’s profile, whereas those prioritizing operational robustness face a costlier entry with Trane.
Which one offers the Superior Shareholder Reward?
Trane Technologies (TT) delivers a modest 0.96% dividend yield with a conservative 29% payout ratio, supported by robust free cash flow coverage (2.6x). Its steady buyback program enhances shareholder returns sustainably. Masco Corporation (MAS) offers a higher 1.97% yield and a similar 32% payout, but with much lighter buybacks. MAS’s yield is attractive but relies more heavily on dividends, while TT balances dividends and buybacks for durable value. I view TT’s distribution mix as the superior total return engine for 2026 investors.
Comparative Score Analysis: The Strategic Profile
The radar chart reveals the fundamental DNA and trade-offs of Trane Technologies plc and Masco Corporation, highlighting their distinct financial strengths and weaknesses:
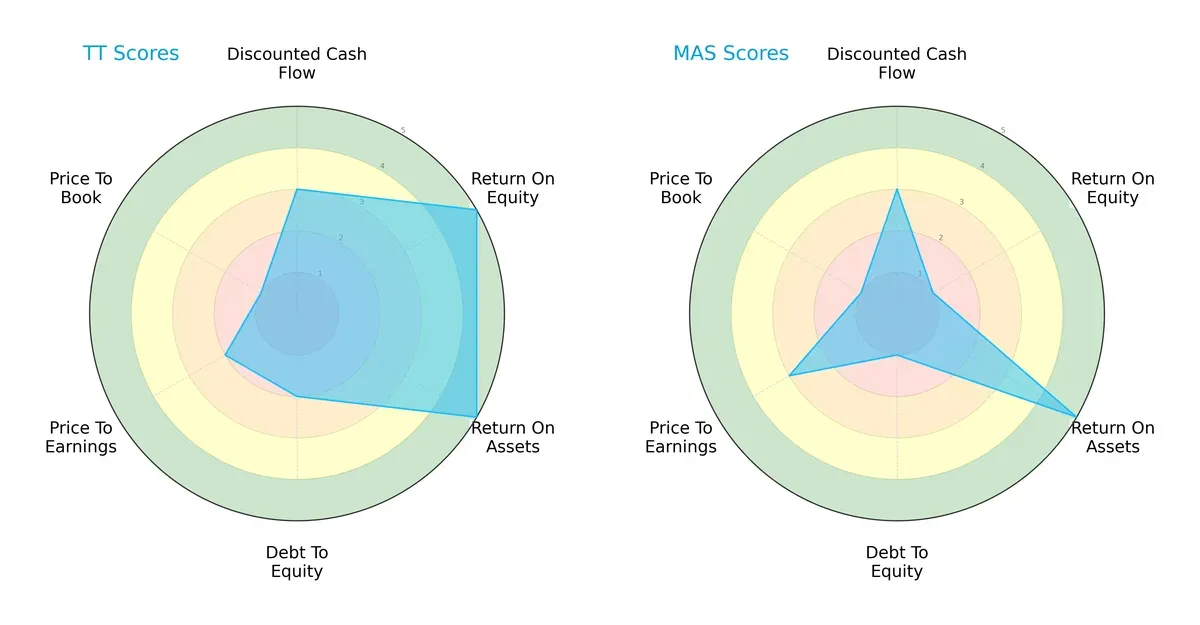
Trane Technologies shows a balanced profile with strong returns on equity (5) and assets (5), but weaker debt management (2) and valuation metrics (PE 2, PB 1). Masco relies heavily on asset efficiency (ROA 5) but suffers from poor equity returns (ROE 1) and high financial risk (debt/equity 1). Overall, Trane’s diverse strengths offer a more stable investment foundation, while Masco depends on a niche operational edge.
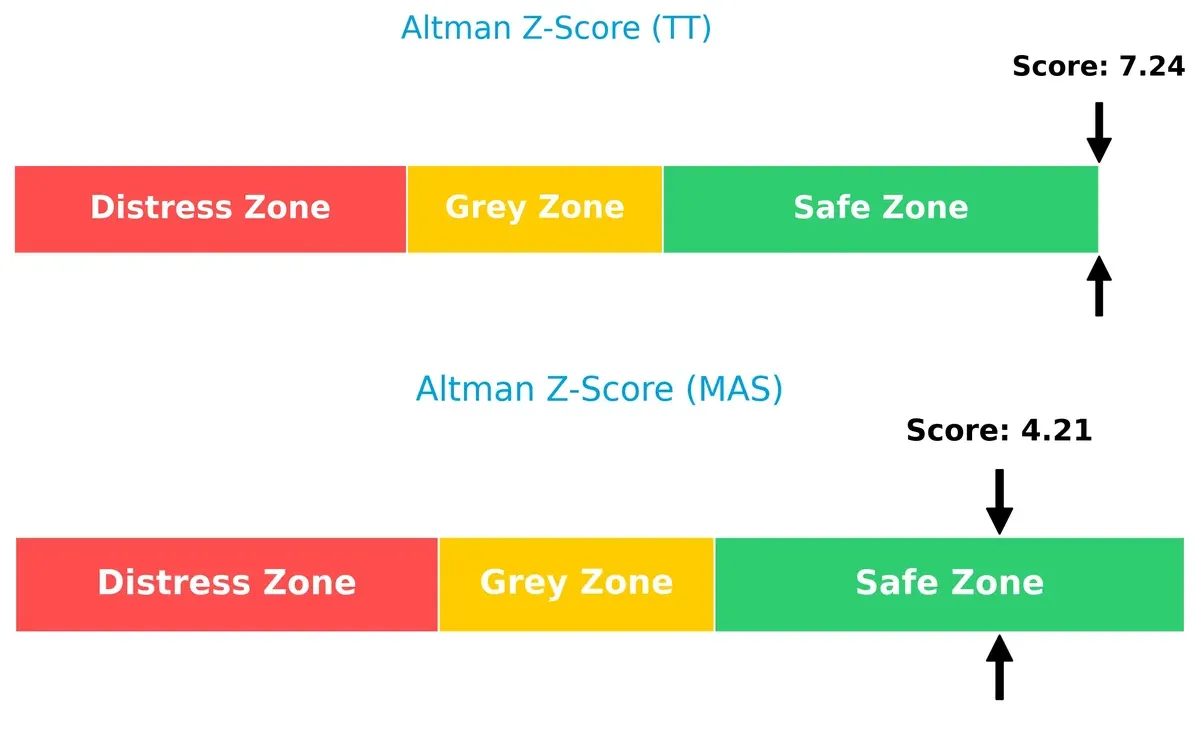
Bankruptcy Risk: Solvency Showdown
Trane’s Altman Z-Score of 7.24 significantly outpaces Masco’s 4.21, indicating a stronger buffer against financial distress in this cycle:
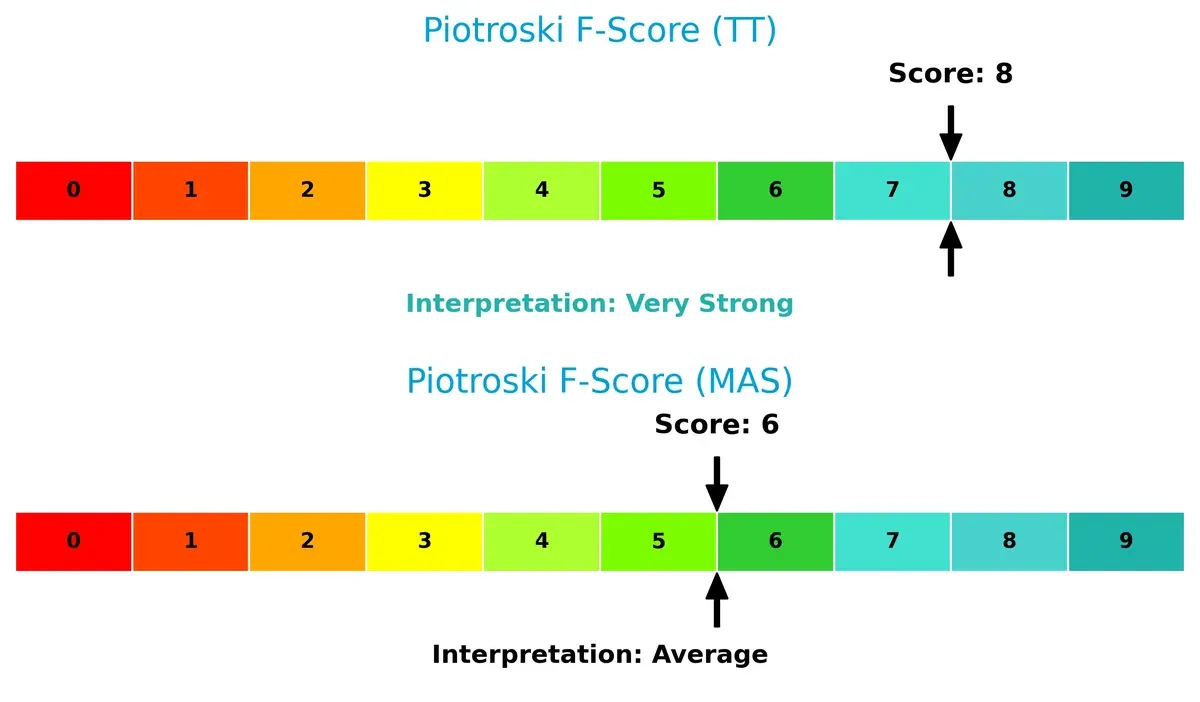
Financial Health: Quality of Operations
Trane scores an 8 on the Piotroski scale, signaling robust financial health, while Masco’s 6 suggests moderate strength but potential internal risks:
How are the two companies positioned?
This section dissects the operational DNA of TT and MAS by comparing their revenue distribution and internal dynamics. The goal is to confront their economic moats and identify which model offers the most resilient competitive advantage today.
Revenue Segmentation: The Strategic Mix
This visual comparison dissects how Trane Technologies plc and Masco Corporation diversify their income streams and where their primary sector bets lie:
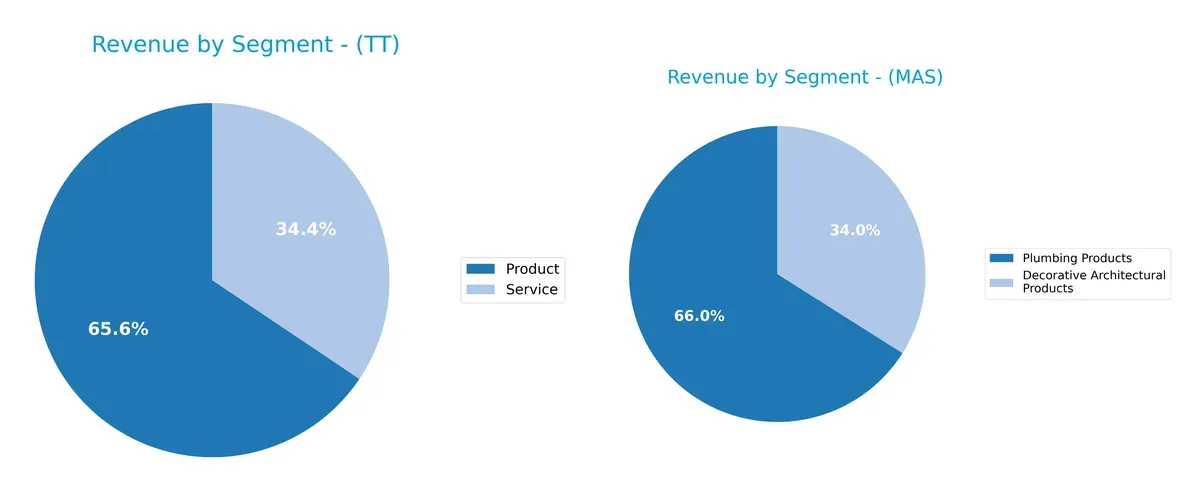
Trane Technologies pivots on two main streams: $14B in Product and $7.3B in Service, showing moderate diversification. Masco leans heavily on Plumbing Products at $5B, with Decorative Architectural Products trailing at $2.57B. Masco’s concentration in Plumbing risks overexposure, while Trane’s balanced product-service mix anchors resilience and ecosystem lock-in, critical in industrial cycles and service-driven expansion.
Strengths and Weaknesses Comparison
This table compares the Strengths and Weaknesses of Trane Technologies (TT) and Masco Corporation (MAS):
TT Strengths
- Strong profitability with 13.7% net margin
- High ROE at 33.9%
- Favorable debt-to-assets at 21.6%
- Solid interest coverage at 17.2
- Diverse revenue split between products and services
- Significant Americas and EMEA presence
MAS Strengths
- Favorable ROIC at 26.2%
- Strong current and quick ratios above 1.1
- Favorable debt-to-equity and interest coverage
- Higher asset turnover at 1.45
- Broad product diversification including plumbing and decorative products
- North America focus with stable foreign revenue
TT Weaknesses
- High PE and PB ratios indicating possible overvaluation
- Dividend yield below 1%
- Neutral current and quick ratios suggest liquidity risk
- Moderate debt-to-equity ratio at 0.54
- Asset turnover at 1.0 lags MAS
MAS Weaknesses
- Negative ROE at -435% signals profitability issues
- High debt-to-assets at 66.1% increases financial risk
- PE and PB ratios present valuation challenges
- Dividend yield moderate but not outstanding
- Geographic concentration in North America limits global exposure
Both companies demonstrate strong operational strengths in profitability and capital efficiency. TT excels in profitability and global diversification, while MAS shows robust liquidity and asset turnover but faces profitability and leverage concerns. These factors will influence each firm’s strategic focus on balancing growth, risk, and capital allocation.
The Moat Duel: Analyzing Competitive Defensibility
A structural moat is the only barrier protecting long-term profits from relentless competitive erosion in any industry:
Trane Technologies plc: Durable Innovation and Scale Advantage
Trane’s moat stems from intangible assets and scale in HVAC and refrigeration, driving a robust 18% EBIT margin and 68% rising ROIC trend. Expanding into energy-efficient solutions deepens its moat in 2026.
Masco Corporation: Brand-Driven Market Niche
Masco’s competitive edge lies in strong brand recognition and distribution in home improvement, reflected in a solid 17.7% ROIC but a 4.4% declining trend. Opportunities in connected water products offer modest moat expansion.
Verdict: Innovation Scale vs. Brand Stability
Trane wields a deeper, more sustainable moat through innovation and scale, outperforming Masco’s narrowing profitability. Trane is better positioned to defend its market share amid evolving industry demands.
Which stock offers better returns?
The past year shows Trane Technologies with a strong upward trajectory, while Masco Corporation trends slightly down despite a recent surge in buyer dominance.
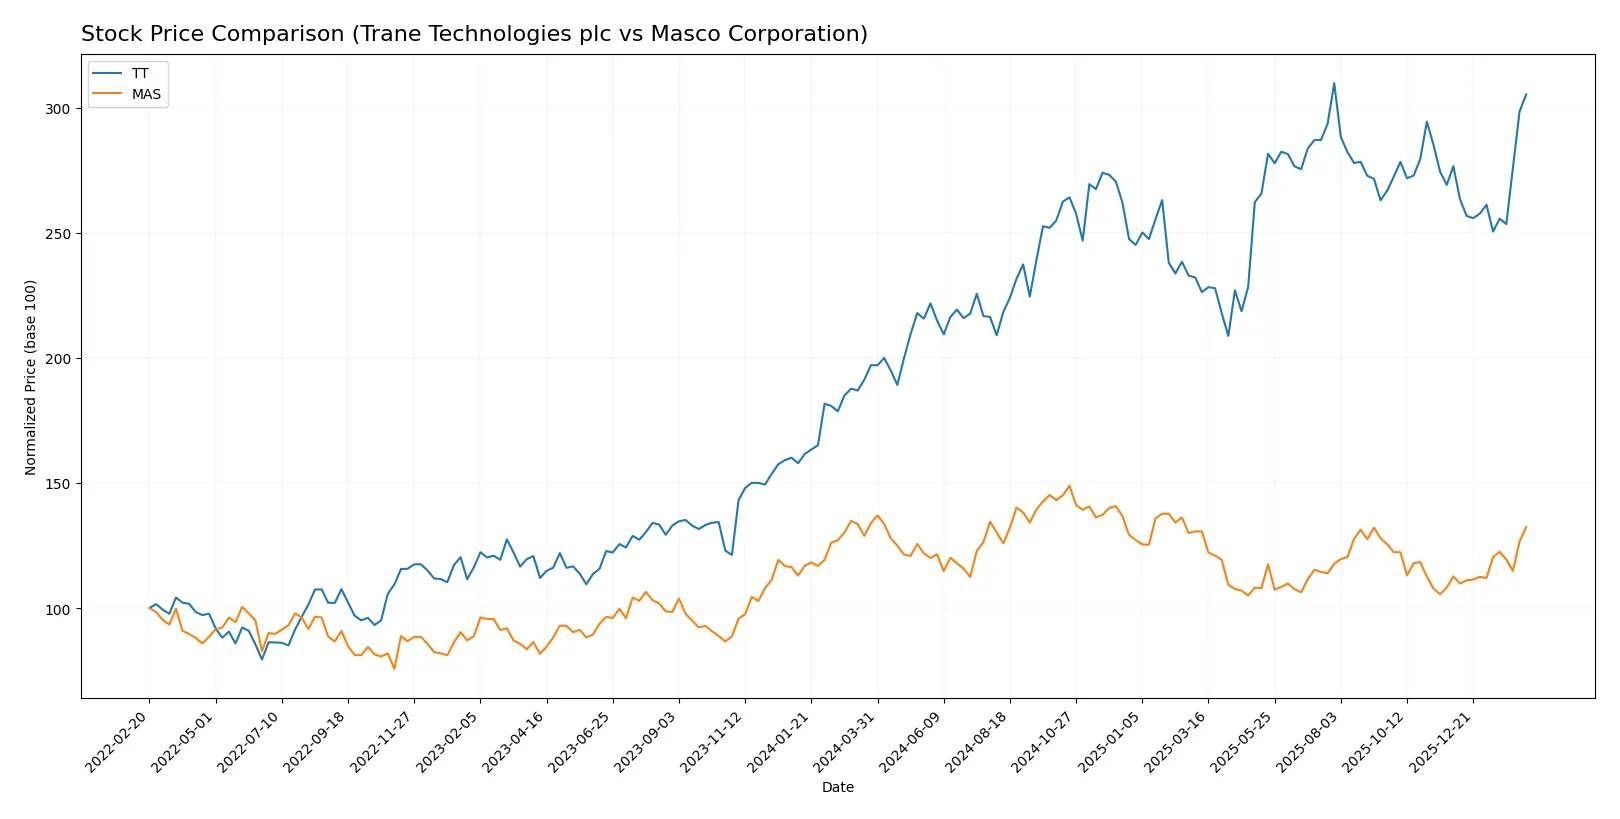
Trend Comparison
Trane Technologies’ stock rose 54.94% over 12 months, signaling a bullish trend with accelerating momentum and high volatility, peaking at 472.07 and bottoming at 288.27.
Masco Corporation’s stock declined 1.18% over the same period, marking a bearish trend despite acceleration; volatility remained low, with prices ranging between 60.42 and 85.71.
Overall, Trane Technologies delivered the highest market performance, outperforming Masco Corporation by a significant margin over the past year.
Target Prices
Analysts present a confident target consensus for Trane Technologies plc and Masco Corporation, reflecting steady growth expectations.
| Company | Target Low | Target High | Consensus |
|---|---|---|---|
| Trane Technologies plc | 370 | 520 | 471.88 |
| Masco Corporation | 67 | 88 | 78.89 |
The target consensus for Trane Technologies sits slightly above the current price of 465.27, signaling moderate upside potential. Masco’s consensus target of 78.89 also exceeds its current price of 76.19, indicating cautious optimism among analysts.

Don’t Let Luck Decide Your Entry Point
Optimize your entry points with our advanced ProRealTime indicators. You’ll get efficient buy signals with precise price targets for maximum performance. Start outperforming now!
How do institutions grade them?
Trane Technologies plc Grades
Here are the latest institutional grades assigned to Trane Technologies plc:
| Grading Company | Action | New Grade | Date |
|---|---|---|---|
| Citigroup | maintain | Buy | 2026-01-30 |
| Wells Fargo | maintain | Underweight | 2026-01-30 |
| Barclays | maintain | Overweight | 2026-01-30 |
| RBC Capital | maintain | Sector Perform | 2026-01-30 |
| Oppenheimer | maintain | Outperform | 2026-01-30 |
| JP Morgan | maintain | Neutral | 2026-01-30 |
| Oppenheimer | upgrade | Outperform | 2026-01-20 |
| Morgan Stanley | maintain | Overweight | 2026-01-13 |
| Barclays | maintain | Overweight | 2026-01-07 |
| UBS | maintain | Buy | 2026-01-05 |
Masco Corporation Grades
Here are the latest institutional grades assigned to Masco Corporation:
| Grading Company | Action | New Grade | Date |
|---|---|---|---|
| Citigroup | maintain | Neutral | 2026-02-12 |
| Wells Fargo | maintain | Overweight | 2026-02-11 |
| Evercore ISI Group | maintain | In Line | 2026-02-11 |
| RBC Capital | maintain | Sector Perform | 2026-02-11 |
| Wells Fargo | maintain | Overweight | 2026-01-14 |
| Citigroup | maintain | Neutral | 2026-01-08 |
| Wells Fargo | upgrade | Overweight | 2025-12-15 |
| Barclays | downgrade | Equal Weight | 2025-12-08 |
| Argus Research | maintain | Buy | 2025-11-05 |
| Barclays | maintain | Overweight | 2025-10-30 |
Which company has the best grades?
Trane Technologies holds a broader range of positive grades, including multiple “Buy” and “Outperform” ratings. Masco’s grades trend more conservatively, clustered around “Neutral” and “Overweight.” Investors may interpret Trane as receiving stronger institutional conviction.
Risks specific to each company
The following categories identify critical pressure points and systemic threats facing Trane Technologies plc and Masco Corporation in the challenging 2026 market environment:
1. Market & Competition
Trane Technologies plc
- Faces intense competition in HVAC and refrigeration with technology-driven innovation demands.
Masco Corporation
- Competes in diverse home improvement markets with pressure from DIY trends and e-commerce disruptors.
2. Capital Structure & Debt
Trane Technologies plc
- Maintains moderate leverage (D/E 0.54) with strong interest coverage (17.17x), ensuring manageable debt risk.
Masco Corporation
- Exhibits concerning capital structure with negative D/E (-18.47) and high debt-to-assets (66%), increasing financial risk.
3. Stock Volatility
Trane Technologies plc
- Beta at 1.21 indicates moderate sensitivity to market swings, typical for industrials.
Masco Corporation
- Slightly higher beta of 1.29 suggests somewhat greater stock price volatility and risk.
4. Regulatory & Legal
Trane Technologies plc
- Faces stringent environmental regulations due to refrigerants and energy efficiency standards.
Masco Corporation
- Encounters regulations on chemical use, product safety, and environmental impact in multiple jurisdictions.
5. Supply Chain & Operations
Trane Technologies plc
- Global supply chain exposed to raw material price volatility and logistics disruptions.
Masco Corporation
- Relies heavily on North American supply chains, vulnerable to inflation and freight cost increases.
6. ESG & Climate Transition
Trane Technologies plc
- Strong focus on energy-efficient products aligns with climate transition, but requires ongoing innovation investment.
Masco Corporation
- ESG efforts improving but lag behind peers; climate transition poses moderate risk to legacy product lines.
7. Geopolitical Exposure
Trane Technologies plc
- Headquarters in Ireland exposes it to EU and Brexit-related trade uncertainties.
Masco Corporation
- US-based with domestic focus, but global sourcing subjects it to tariffs and trade tensions.
Which company shows a better risk-adjusted profile?
Trane Technologies’ manageable debt and strong profitability mitigate market and regulatory risks effectively. Masco’s high leverage and weak equity returns raise red flags despite favorable asset turnover. Trane’s Altman Z-score (7.24) and Piotroski score (8) confirm superior financial health. Masco’s lower scores (4.21 and 6) signal elevated risk. The most impactful risk for Trane is regulatory compliance in climate-sensitive markets. For Masco, capital structure instability dominates. Thus, Trane Technologies offers a better risk-adjusted investment profile in 2026.
Final Verdict: Which stock to choose?
Trane Technologies excels as a cash-generating powerhouse with a very favorable moat, driven by a rising ROIC well above its cost of capital. Its efficiency and strong profitability make it ideal for growth-focused portfolios. The point of vigilance remains its elevated valuation metrics, which could pressure returns if growth slows.
Masco Corporation’s strategic moat lies in its robust capital returns and asset turnover, supporting solid free cash flow generation. It offers a more defensive profile with a higher current ratio and moderate valuation, fitting well in GARP portfolios. However, its declining ROIC trend and negative equity return warrant caution.
If you prioritize sustained value creation and growth momentum, Trane Technologies outshines due to its expanding profitability and operational efficiency. However, if you seek better balance sheet safety and reasonable valuation in a more conservative framework, Masco offers better stability despite some erosion in profitability. Each choice reflects distinct risk-return profiles aligned with specific investor strategies.
Disclaimer: Investment carries a risk of loss of initial capital. The past performance is not a reliable indicator of future results. Be sure to understand risks before making an investment decision.
Go Further
I encourage you to read the complete analyses of Trane Technologies plc and Masco Corporation to enhance your investment decisions: