In the dynamic semiconductor industry, Marvell Technology, Inc. (MRVL) and Tower Semiconductor Ltd. (TSEM) stand out as innovative players with distinct approaches. Marvell focuses on integrated circuits and storage solutions, while Tower specializes in analog mixed-signal foundry services. Both compete in overlapping markets driven by technology evolution and customization demands. This article will help you identify which company presents a more compelling opportunity for your investment portfolio.
Table of contents
Companies Overview
I will begin the comparison between Marvell Technology, Inc. and Tower Semiconductor Ltd. by providing an overview of these two companies and their main differences.
Marvell Technology Overview
Marvell Technology, Inc. designs, develops, and sells integrated circuits with a focus on analog, mixed-signal, and digital signal processing. The company offers Ethernet solutions, storage controllers, and application processors, serving global markets including the US, Asia, and Europe. Founded in 1995 and headquartered in Wilmington, Delaware, Marvell operates within the semiconductor industry and employs over 7,000 people.
Tower Semiconductor Overview
Tower Semiconductor Ltd. is an independent semiconductor foundry specializing in analog intensive mixed-signal devices and customizable process technologies such as SiGe, BiCMOS, and RF CMOS. Founded in 1993 and based in Migdal Haemek, Israel, it serves diverse markets including automotive, aerospace, and medical. Tower employs more than 5,600 staff members and provides wafer fabrication and design enablement services globally.
Key similarities and differences
Both companies operate in the semiconductor sector, focusing on analog and mixed-signal technologies. Marvell emphasizes integrated circuit design and product sales, while Tower primarily offers semiconductor foundry and fabrication services. Marvell has a larger market cap of approximately 69B USD compared to Tower’s 13.9B USD, and employs more personnel. Geographically, Marvell is US-based with extensive Asian operations, whereas Tower is headquartered in Israel with a broader presence in Europe and Asia.
Income Statement Comparison
The table below presents a side-by-side comparison of key income statement metrics for Marvell Technology, Inc. and Tower Semiconductor Ltd. for their most recent fiscal years.
| Metric | Marvell Technology, Inc. (MRVL) | Tower Semiconductor Ltd. (TSEM) |
|---|---|---|
| Market Cap | 69.3B | 13.9B |
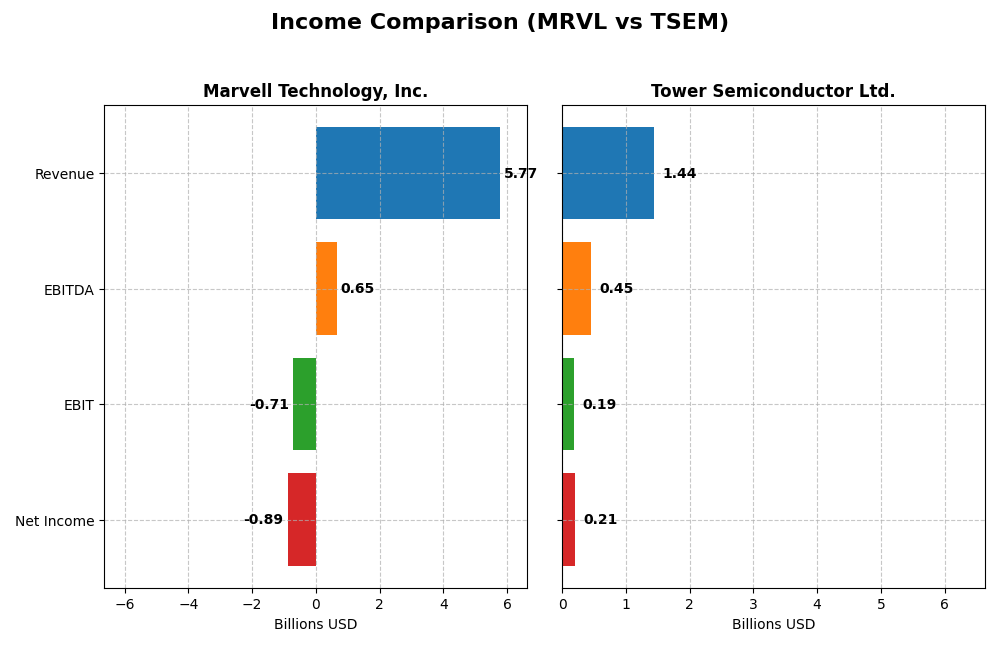
| Revenue | 5.77B | 1.44B |
| EBITDA | 652M | 451M |
| EBIT | -705M | 185M |
| Net Income | -885M | 208M |
| EPS | -1.02 | 1.87 |
| Fiscal Year | 2025 | 2024 |
Income Statement Interpretations
Marvell Technology, Inc.
Marvell Technology showed a strong revenue increase of 94.26% from 2021 to 2025, but net income declined by 219.15%, reflecting ongoing profitability struggles. Gross margins remained favorable at 41.31%, yet EBIT and net margins stayed negative, indicating cost pressures. In 2025, revenue growth slowed to 4.71%, with slight gross profit improvement but worsening EBIT and operating losses.
Tower Semiconductor Ltd.
Tower Semiconductor exhibited moderate revenue growth of 13.47% over 2020-2024, supported by a favorable gross margin of 23.64% and positive EBIT margin of 12.88%. Net income and margin growth were strong overall, though the latest year saw a small 0.94% revenue rise but significant declines in EBIT and net margin, suggesting margin compression despite solid fundamentals.
Which one has the stronger fundamentals?
Tower Semiconductor’s income statement shows more consistent profitability, positive EBIT and net margins, and favorable overall growth in net income and margins. Marvell Technology’s higher revenue growth contrasts with persistent net losses and negative margins. While both faced challenges in the most recent year, Tower’s stronger profitability and margin stability indicate comparatively stronger fundamental income metrics.
Financial Ratios Comparison
Below is a comparison of key financial ratios for Marvell Technology, Inc. (MRVL) and Tower Semiconductor Ltd. (TSEM) based on their most recent fiscal year data.
| Ratios | Marvell Technology, Inc. (2025) | Tower Semiconductor Ltd. (2024) |
|---|---|---|
| ROE | -6.59% | 7.83% |
| ROIC | -3.88% | 6.41% |
| P/E | -110.4 | 27.54 |
| P/B | 7.27 | 2.16 |
| Current Ratio | 1.54 | 6.18 |
| Quick Ratio | 1.03 | 5.23 |
| D/E | 0.32 | 0.07 |
| Debt-to-Assets | 21.5% | 5.9% |
| Interest Coverage | -3.80 | 32.64 |
| Asset Turnover | 0.29 | 0.47 |
| Fixed Asset Turnover | 5.56 | 1.11 |
| Payout ratio | -23.4% | 0% |
| Dividend yield | 0.21% | 0% |
Interpretation of the Ratios
Marvell Technology, Inc.
Marvell’s financial ratios reveal significant weaknesses, including negative net margin (-15.35%) and return on equity (-6.59%), indicating profitability challenges. The company shows solid liquidity with a current ratio of 1.54 and manageable debt levels. Dividend yield is low at 0.21%, suggesting limited shareholder returns, although dividends are paid. Coverage by free cash flow and risks of unsustainable payouts warrant attention.
Tower Semiconductor Ltd.
Tower Semiconductor exhibits generally stronger profitability with a positive net margin of 14.47% and moderate return on equity of 7.83%. It maintains a very high current ratio of 6.18, signaling strong liquidity but potentially inefficient asset use. The company does not pay dividends, likely focusing on reinvestment and growth. Its debt levels are low, and interest coverage is robust at 31.57, supporting financial stability.
Which one has the best ratios?
Comparing the two, Tower Semiconductor presents a more favorable overall ratio profile with positive profitability metrics, better interest coverage, and low debt burden. Marvell shows more unfavorable ratios, particularly in profitability and cash flow, despite reasonable liquidity. Tower’s slightly favorable global opinion contrasts with Marvell’s unfavorable rating, indicating stronger financial health for Tower in this context.
Strategic Positioning
This section compares the strategic positioning of Marvell Technology, Inc. and Tower Semiconductor Ltd., focusing on market position, key segments, and exposure to disruption:
Marvell Technology, Inc.
- Large market cap of 69B USD with high beta indicating volatility and strong competitive pressure
- Diversified segments including Data Center (4.16B), Enterprise Networking (626M), Automotive and Industrial (322M)
- Exposure to technological disruption through integrated circuits and Ethernet solutions innovation
Tower Semiconductor Ltd.
- Smaller market cap of 13.9B USD with lower beta, facing moderate competitive pressure
- Focused on semiconductor foundry services with analog mixed-signal technology for various industries
- Technological risk linked to foundry process technologies like SiGe, BiCMOS, and CMOS image sensors
Marvell Technology, Inc. vs Tower Semiconductor Ltd. Positioning
Marvell pursues a diversified strategy with multiple high-revenue segments, offering broad exposure but higher volatility. Tower Semiconductor concentrates on foundry services with specialized process technologies, providing focused market coverage but less diversification.
Which has the best competitive advantage?
Both companies are currently shedding value, but Tower Semiconductor shows a growing ROIC trend indicating improving profitability, while Marvell faces declining ROIC and a very unfavorable moat evaluation.
Stock Comparison
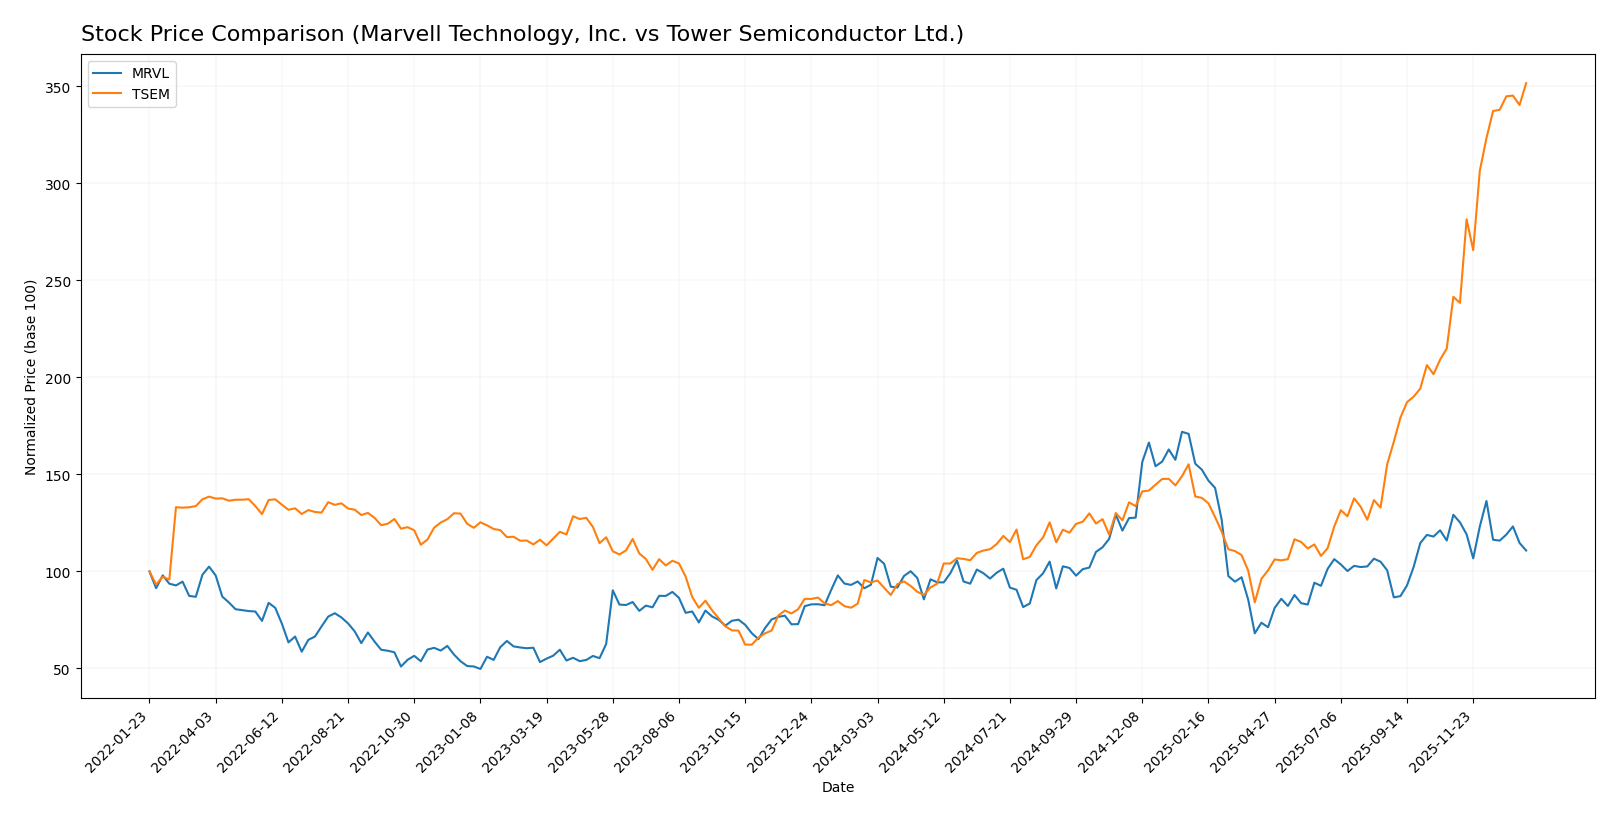
The stock price movements over the past year show significant bullish trends for both Marvell Technology, Inc. and Tower Semiconductor Ltd., with notable differences in performance dynamics and volume trends.
Trend Analysis
Marvell Technology, Inc. exhibited an 18.94% price increase over the past 12 months, indicating a bullish trend with deceleration. The stock fluctuated between 49.43 and 124.76, with high volatility reflected in a 16.46 standard deviation.
Tower Semiconductor Ltd. delivered a 272.71% price gain over the same period, showing a strong bullish trend with acceleration and greater volatility at 23.67 standard deviation. The stock ranged from 29.65 to 124.0.
Comparing both, Tower Semiconductor Ltd. achieved the highest market performance with a much stronger price appreciation and accelerating momentum relative to Marvell Technology, Inc.
Target Prices
The current analyst consensus for Marvell Technology, Inc. and Tower Semiconductor Ltd. reflects moderate upside potential with varied target ranges.
| Company | Target High | Target Low | Consensus |
|---|---|---|---|
| Marvell Technology, Inc. | 156 | 80 | 117 |
| Tower Semiconductor Ltd. | 125 | 66 | 96 |
Analysts expect Marvell Technology’s stock to trade significantly above its current price of $80.38, while Tower Semiconductor’s consensus target is slightly below its current price of $124, indicating mixed outlooks for these semiconductor companies.
Analyst Opinions Comparison
This section compares analysts’ ratings and grades for Marvell Technology, Inc. (MRVL) and Tower Semiconductor Ltd. (TSEM):
Rating Comparison
MRVL Rating
- Rating: B+, considered Very Favorable by analysts.
- Discounted Cash Flow Score: 3, indicating Moderate valuation based on future cash flows.
- ROE Score: 4, showing favorable efficiency in generating profit from equity.
- ROA Score: 5, very favorable utilization of assets to generate earnings.
- Debt To Equity Score: 2, moderate financial risk with some reliance on debt.
- Overall Score: 3, moderate overall financial standing.
TSEM Rating
- Rating: B+, also considered Very Favorable by analysts.
- Discounted Cash Flow Score: 3, indicating Moderate valuation based on future cash flows.
- ROE Score: 3, showing moderate efficiency in generating profit from equity.
- ROA Score: 4, favorable utilization of assets to generate earnings.
- Debt To Equity Score: 4, favorable low financial risk and stronger balance sheet.
- Overall Score: 3, moderate overall financial standing.
Which one is the best rated?
Both MRVL and TSEM share the same overall rating and discounted cash flow score. MRVL scores higher in return on equity and assets, while TSEM has a stronger debt-to-equity position. Overall, their ratings reflect moderate financial health with different strengths.
Scores Comparison
The following table compares the Altman Z-Score and Piotroski Score of Marvell Technology and Tower Semiconductor:
Marvell Technology Scores
- Altman Z-Score: 6.76, indicating a safe financial zone with low bankruptcy risk.
- Piotroski Score: 7, reflecting strong financial health and value potential.
Tower Semiconductor Scores
- Altman Z-Score: 21.06, indicating a safe financial zone with very low bankruptcy risk.
- Piotroski Score: 7, reflecting strong financial health and value potential.
Which company has the best scores?
Tower Semiconductor has a higher Altman Z-Score, indicating a stronger financial safety margin. Both companies share the same Piotroski Score, reflecting equivalent financial strength. Thus, Tower Semiconductor exhibits a superior score in bankruptcy risk assessment.
Grades Comparison
Here is a comparison of the recent grades and ratings issued by reputable grading companies for the two semiconductor firms:
Marvell Technology, Inc. Grades
The following table summarizes recent grades assigned by established grading firms to Marvell Technology, Inc.:
| Grading Company | Action | New Grade | Date |
|---|---|---|---|
| Rosenblatt | Maintain | Buy | 2026-01-07 |
| Melius Research | Upgrade | Buy | 2026-01-05 |
| Benchmark | Downgrade | Hold | 2025-12-08 |
| B. Riley Securities | Maintain | Buy | 2025-12-03 |
| JP Morgan | Maintain | Overweight | 2025-12-03 |
| Susquehanna | Maintain | Positive | 2025-12-03 |
| Benchmark | Maintain | Buy | 2025-12-03 |
| Oppenheimer | Maintain | Outperform | 2025-12-03 |
| Stifel | Maintain | Buy | 2025-12-03 |
| Rosenblatt | Maintain | Buy | 2025-12-03 |
Overall, Marvell’s grades predominantly indicate a Buy consensus, with a single recent Hold downgrade, reflecting generally positive sentiment from analysts.
Tower Semiconductor Ltd. Grades
The recent grades for Tower Semiconductor Ltd. by recognized firms are as follows:
| Grading Company | Action | New Grade | Date |
|---|---|---|---|
| Benchmark | Maintain | Buy | 2026-01-09 |
| Wedbush | Downgrade | Neutral | 2025-12-31 |
| Benchmark | Maintain | Buy | 2025-11-11 |
| Susquehanna | Maintain | Positive | 2025-11-11 |
| Wedbush | Maintain | Outperform | 2025-11-11 |
| Barclays | Maintain | Equal Weight | 2025-11-11 |
| Benchmark | Maintain | Buy | 2025-09-08 |
| Susquehanna | Maintain | Positive | 2025-08-05 |
| Benchmark | Maintain | Buy | 2025-08-05 |
| Benchmark | Maintain | Buy | 2025-08-04 |
Tower Semiconductor’s grades show a strong Buy presence with some Neutral and Equal Weight ratings, indicating a more mixed but generally positive analyst view.
Which company has the best grades?
Marvell Technology, Inc. has received more consistent Buy and Outperform grades, while Tower Semiconductor presents some Neutral and Equal Weight ratings alongside its Buys. This suggests Marvell may be viewed more favorably by analysts, potentially indicating stronger confidence in its near-term prospects for investors.
Strengths and Weaknesses
Below is a comparison of Marvell Technology, Inc. (MRVL) and Tower Semiconductor Ltd. (TSEM) based on key financial and strategic criteria as of the most recent fiscal years.
| Criterion | Marvell Technology, Inc. (MRVL) | Tower Semiconductor Ltd. (TSEM) |
|---|---|---|
| Diversification | Moderate: Revenue spread across Data Center (4.16B), Enterprise Networking (626M), Carrier Infrastructure (338M), Automotive & Industrial (322M), Consumer (316M) | Limited data on product segmentation, but focused semiconductor manufacturing |
| Profitability | Unfavorable: Negative net margin (-15.35%), negative ROIC (-3.88%), declining profitability | Mixed: Positive net margin (14.47%), moderate ROIC (6.41%), improving profitability trend |
| Innovation | Struggling: declining ROIC trend indicates challenges in maintaining competitive edge | Positive: Growing ROIC trend suggests improving innovation and operational efficiency |
| Global presence | Strong presence in multiple tech segments globally, especially data centers | Focused global niche in semiconductor manufacturing with growing capabilities |
| Market Share | Strong in data center and networking markets, but value destruction raises concerns | Smaller but growing market presence with improving financial metrics |
Key takeaways: Marvell shows strong market positions but suffers from declining profitability and value destruction, signaling caution. Tower Semiconductor demonstrates improving profitability and efficiency, suggesting a cautiously optimistic outlook despite a smaller scale. Investors should weigh Marvell’s scale against its financial risks and consider TSEM’s growth trajectory.
Risk Analysis
Below is a summary table highlighting key risk metrics for Marvell Technology, Inc. (MRVL) and Tower Semiconductor Ltd. (TSEM) as of the most recent fiscal years:
| Metric | Marvell Technology, Inc. (MRVL) | Tower Semiconductor Ltd. (TSEM) |
|---|---|---|
| Market Risk | High beta (1.945) indicates higher volatility | Moderate beta (0.876) indicates lower volatility |
| Debt level | Moderate debt-to-equity (0.32), debt-to-assets 21.5% | Low debt-to-equity (0.07), debt-to-assets 5.87% |
| Regulatory Risk | Exposure to multiple countries including US, China, and Asia; potential trade tensions | Operations in US, Japan, Israel, and Asia; geopolitical risks in Middle East |
| Operational Risk | Negative net margin (-15.35%) and ROE (-6.59%) suggest operational challenges | Positive net margin (14.47%) but moderate ROE (7.83%) |
| Environmental Risk | Industry-wide semiconductor manufacturing impacts, compliance with environmental standards | Similar semiconductor production risks, focus on clean technologies |
| Geopolitical Risk | Significant exposure to China and Asia-Pacific tensions | Headquarters in Israel, geopolitical tensions could impact operations |
The most impactful risks are Marvell’s operational challenges reflected in negative profitability metrics and high market volatility, which could affect stock stability. Tower Semiconductor benefits from lower debt and positive margins but faces geopolitical risks due to its Israeli base. Investors should weigh operational efficiency and geopolitical exposure carefully.
Which Stock to Choose?
Marvell Technology, Inc. (MRVL) shows moderate revenue growth of 4.71% in 2025 but suffers from unfavorable profitability ratios, including a -15.35% net margin and negative returns on equity and invested capital. Its debt ratios are favorable, with a current ratio of 1.54 and moderate leverage, but the company is rated as having an unfavorable overall financial position.
Tower Semiconductor Ltd. (TSEM) reports stable income with a 0.94% revenue growth in 2024, favorable net and EBIT margins, and positive returns on assets and equity. Its financial ratios are slightly favorable overall, supported by low debt levels and strong liquidity. The company holds a very favorable rating despite some neutral and unfavorable metrics.
Considering ratings and financial evaluations, MRVL’s moderate rating contrasts with its unfavorable income and ratio profiles, while TSEM’s slightly favorable ratios and favorable income suggest improving profitability. Investors with a risk-tolerant, growth-oriented approach might find TSEM’s accelerating trend and improving profitability more appealing, whereas those seeking stability could interpret MRVL’s stronger balance sheet ratios differently.
Disclaimer: Investment carries a risk of loss of initial capital. The past performance is not a reliable indicator of future results. Be sure to understand risks before making an investment decision.
Go Further
I encourage you to read the complete analyses of Marvell Technology, Inc. and Tower Semiconductor Ltd. to enhance your investment decisions: