Home > Comparison > Technology > TXN vs MRVL
The strategic rivalry between Texas Instruments Incorporated and Marvell Technology, Inc. defines the current trajectory of the semiconductor industry. Texas Instruments operates as a capital-intensive industrial giant focused on analog and embedded processing products. Marvell Technology, by contrast, emphasizes mixed-signal and digital processing integrated circuits with a strong presence in storage and networking. This analysis will determine which corporate model offers superior risk-adjusted returns for a diversified portfolio amid evolving sector dynamics.
Table of contents
Companies Overview
Texas Instruments and Marvell Technology stand as key players shaping the semiconductor industry’s evolution in 2026.
Texas Instruments Incorporated: Analog and Embedded Processing Leader
Texas Instruments dominates the semiconductor space with a stronghold in analog and embedded processing. Its revenue largely stems from power management and signal chain products, critical for diverse industries like automotive and industrial. In 2026, TI focuses strategically on expanding its analog product portfolio, reinforcing its competitive advantage in power efficiency and precision sensing technologies.
Marvell Technology, Inc.: Networking and Storage Innovator
Marvell Technology excels in designing integrated circuits that power networking and storage solutions. Its core revenue comes from Ethernet controllers, storage controllers, and application processors. For 2026, Marvell’s strategy emphasizes broadening its footprint in high-speed data infrastructure and cloud storage, leveraging mixed-signal and digital processing capabilities to capture growth in data-centric markets.
Strategic Collision: Similarities & Divergences
Both companies invest heavily in semiconductor innovation but diverge in focus; Texas Instruments prioritizes a closed ecosystem of analog and embedded products, while Marvell pursues an open infrastructure in networking and storage. The primary battleground lies in industrial and data infrastructure markets where precision and speed are paramount. Their investment profiles differ sharply: TI offers stability with mature product lines, whereas Marvell presents growth potential in evolving data technologies.
Income Statement Comparison
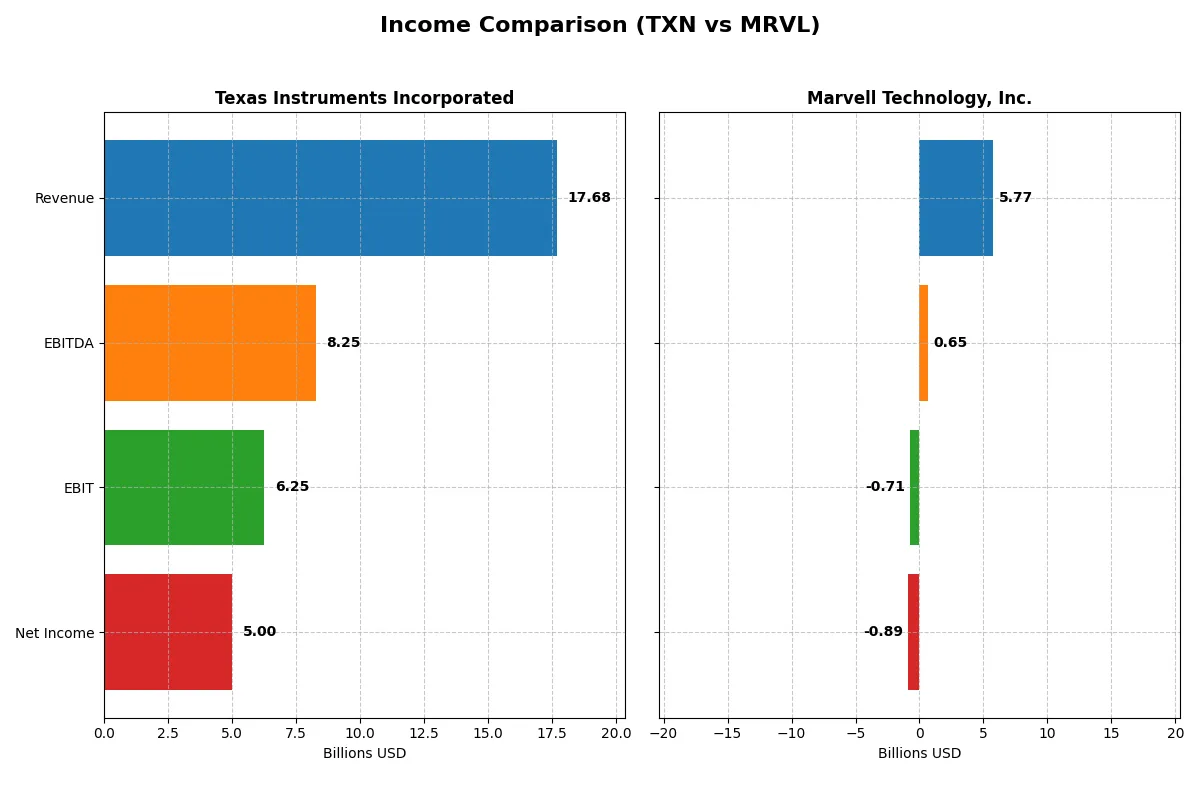
The following data dissects the core profitability and scalability of both corporate engines to reveal who dominates the bottom line:
| Metric | Texas Instruments (TXN) | Marvell Technology (MRVL) |
|---|---|---|
| Revenue | 17.7B | 5.77B |
| Cost of Revenue | 7.60B | 3.39B |
| Operating Expenses | 4.06B | 3.10B |
| Gross Profit | 10.1B | 2.38B |
| EBITDA | 8.25B | 652M |
| EBIT | 6.25B | -705M |
| Interest Expense | 543M | 189M |
| Net Income | 5.00B | -885M |
| EPS | 5.45 | -1.02 |
| Fiscal Year | 2025 | 2025 |
Income Statement Analysis: The Bottom-Line Duel
This income statement comparison reveals which company runs a more efficient and profitable corporate engine through recent fiscal data.
Texas Instruments Incorporated Analysis
Texas Instruments shows a mixed revenue trajectory, with 2025 revenue at $17.7B, up 13% from 2024 but down overall since 2021. Gross and net margins remain robust at 57% and 28%, respectively, reflecting strong cost control. Despite a 35% net income decline since 2021, 2025’s $5B net income and 4.8% EPS growth signal resilient operational efficiency.
Marvell Technology, Inc. Analysis
Marvell’s revenue climbed steadily to $5.8B in 2025, nearly doubling since 2021, but profitability lags. The 41% gross margin contrasts sharply with a negative 15% net margin, driven by elevated operating expenses. Marvell reported a $885M net loss in 2025 despite modest revenue growth, highlighting persistent challenges in converting sales to profits.
Verdict: Margin Power vs. Revenue Scale
Texas Instruments dominates on margin health and net income, delivering consistent profitability despite slower revenue growth. Marvell impresses with top-line expansion but struggles with losses and weak EBIT margins. For investors prioritizing sustainable earnings and margin discipline, Texas Instruments’ profile offers a clearer fundamental advantage.
Financial Ratios Comparison
These vital ratios act as a diagnostic tool to expose the underlying fiscal health, valuation premiums, and capital efficiency of the companies compared below:
| Ratios | Texas Instruments (TXN) | Marvell Technology (MRVL) |
|---|---|---|
| ROE | 30.7% | -6.6% |
| ROIC | 16.5% | -3.9% |
| P/E | 31.5 | -110.4 |
| P/B | 9.69 | 7.27 |
| Current Ratio | 4.35 | 1.54 |
| Quick Ratio | 2.83 | 1.03 |
| D/E (Debt-to-Equity) | 0.86 | 0.32 |
| Debt-to-Assets | 40.6% | 21.5% |
| Interest Coverage | 11.1 | -3.8 |
| Asset Turnover | 0.51 | 0.29 |
| Fixed Asset Turnover | 1.44 | 5.56 |
| Payout Ratio | 100% | -23% |
| Dividend yield | 3.17% | 0.21% |
| Fiscal Year | 2025 | 2025 |
Efficiency & Valuation Duel: The Vital Signs
Financial ratios act as a company’s DNA, revealing hidden risks and operational strengths that shape investment outcomes.
Texas Instruments Incorporated
Texas Instruments posts a robust 30.7% ROE and a strong 28.3% net margin, signaling efficient profitability. However, its P/E ratio at 31.5 and P/B near 9.7 mark the stock as expensive relative to typical benchmarks. The company offers a 3.17% dividend yield, rewarding shareholders with steady income alongside moderate growth reinvestment.
Marvell Technology, Inc.
Marvell delivers negative profitability metrics, including a -6.6% ROE and -15.4% net margin, reflecting operational challenges. Despite a favorable negative P/E ratio, its valuation remains stretched due to weak fundamentals. The low 0.21% dividend yield and negative interest coverage highlight financial strain and limited shareholder returns, with R&D investment driving future prospects.
Premium Valuation vs. Operational Safety
Texas Instruments balances operational efficiency and shareholder income despite a premium valuation. Marvell’s unfavorable profitability and stretched metrics heighten risk. Investors seeking stability and income find Texas Instruments’ profile more suitable, while Marvell’s profile fits those prioritizing growth potential amid volatility.
Which one offers the Superior Shareholder Reward?
Texas Instruments (TXN) delivers a more compelling shareholder reward than Marvell Technology (MRVL). TXN pays a generous 3.17% dividend yield with a near 100% payout ratio, fully covered by steady free cash flow of 2.9B in 2025, reflecting disciplined capital allocation. TXN also executes consistent buybacks, sustaining long-term value. In contrast, MRVL’s dividend yield is negligible at 0.21%, with a negative payout ratio signaling losses and limited dividend sustainability. MRVL’s reinvestment focuses on growth, but its weak profitability and high valuation (P/E negative, EV multiple above 150x) amplify risk. I see TXN’s balanced model—high dividend yield, strong cash flow, and buybacks—as more sustainable and attractive for total return in 2026.
Comparative Score Analysis: The Strategic Profile
The radar chart reveals the fundamental DNA and trade-offs of Texas Instruments and Marvell Technology, illustrating their key financial strengths and weaknesses:
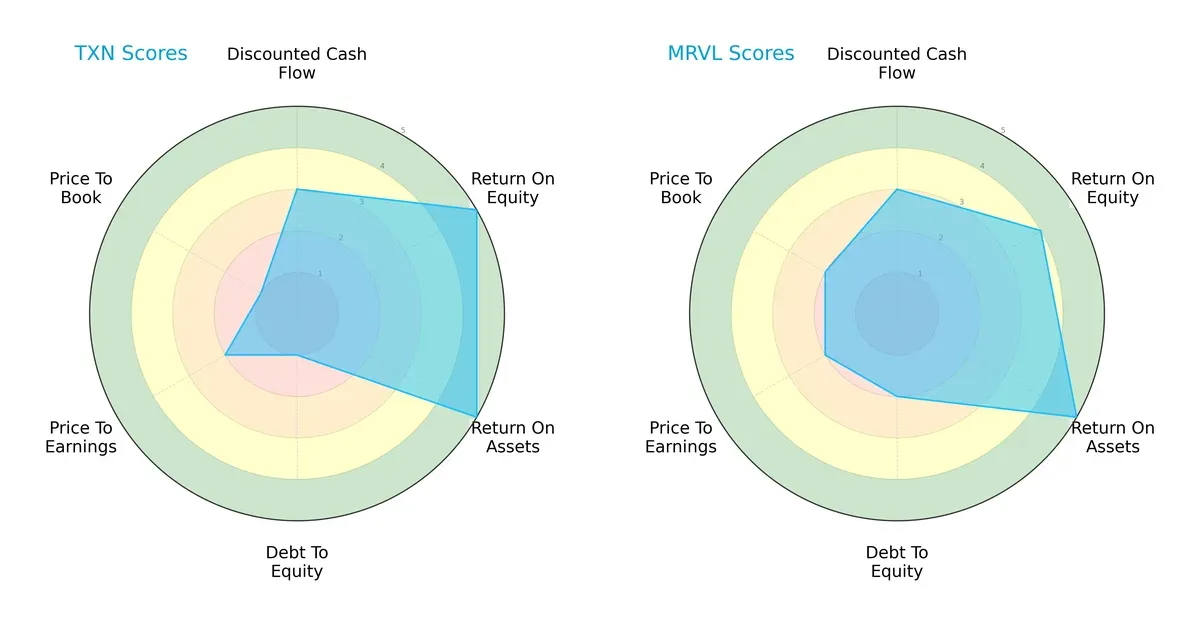
Texas Instruments excels with a superior ROE (5 vs. 4) and ROA (5 vs. 5), signaling efficient profit generation and asset use. However, it suffers from a weak debt-to-equity score (1 vs. 2), highlighting higher leverage risk. Marvell holds a more balanced valuation profile (P/E and P/B scores at 2 vs. 2 and 1), suggesting less market price distortion. Overall, Texas Instruments relies on operational efficiency, while Marvell presents a steadier financial risk and valuation balance.
Bankruptcy Risk: Solvency Showdown
Texas Instruments leads with an Altman Z-Score of 9.44 versus Marvell’s 6.80, indicating stronger solvency and a safer zone for long-term survival in this cycle:

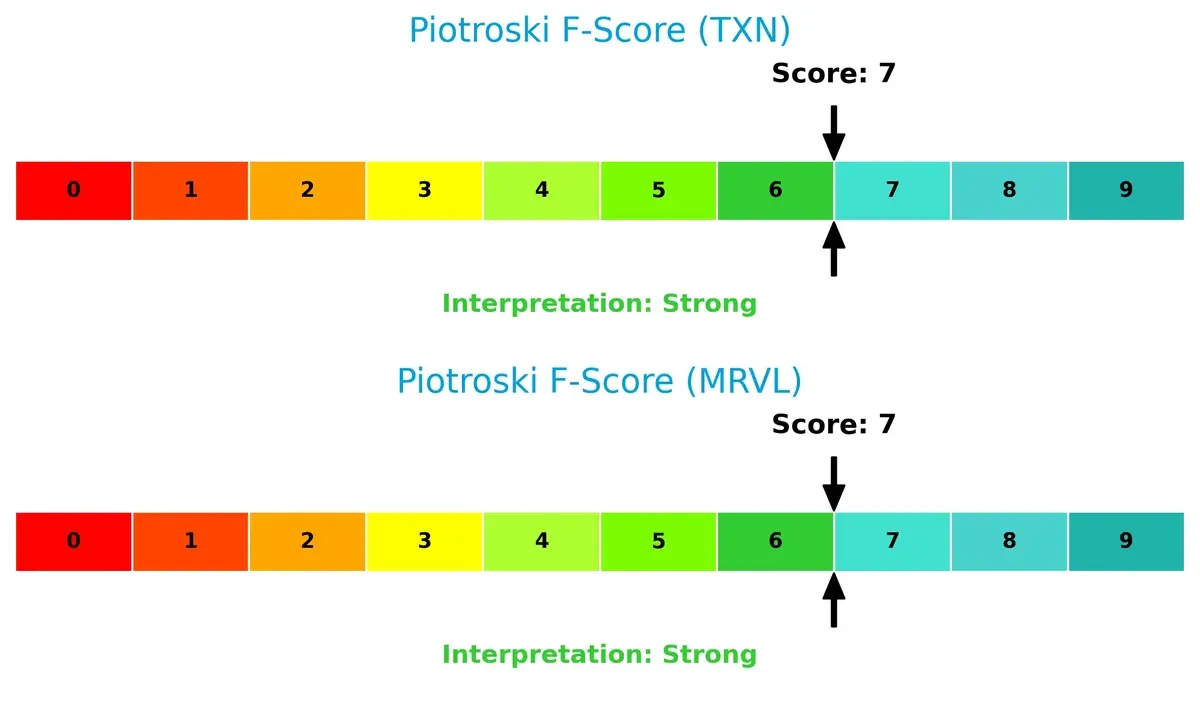
Financial Health: Quality of Operations
Both firms share a Piotroski F-Score of 7, reflecting strong financial health with no immediate red flags in operational quality:
How are the two companies positioned?
This section dissects TXN and MRVL’s operational DNA by comparing revenue distribution and internal dynamics. The goal is to confront their economic moats and identify the more resilient competitive advantage today.
Revenue Segmentation: The Strategic Mix
This visual comparison dissects how Texas Instruments and Marvell diversify their income streams and where their primary sector bets lie:
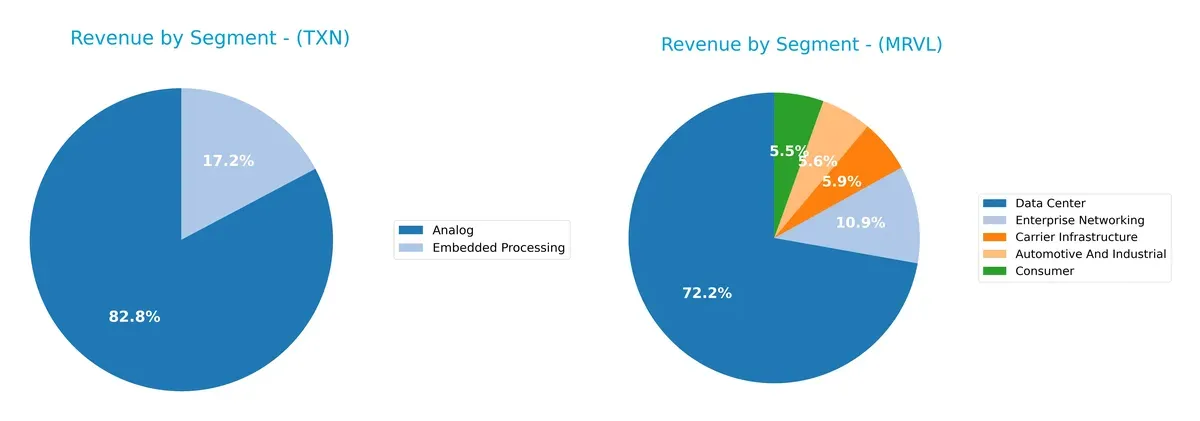
Texas Instruments anchors its revenue on Analog at $12.2B in 2024, with Embedded Processing contributing $2.5B. Its mix is less diversified, relying heavily on Analog’s ecosystem lock-in. Marvell shows a broader spread: Data Center leads at $4.16B, but Enterprise Networking, Carrier Infrastructure, and other segments each contribute substantial shares. This diversification reduces concentration risk and signals a strategic pivot toward infrastructure dominance in networking and cloud markets.
Strengths and Weaknesses Comparison
This table compares the Strengths and Weaknesses of Texas Instruments and Marvell Technology:
Texas Instruments Strengths
- High net margin at 28.28%
- Strong ROE of 30.73%
- Favorable quick ratio at 2.83
- Diversified revenue from Analog and Embedded Processing
- Significant global presence including US, China, and EMEA
Marvell Technology Strengths
- Favorable current and quick ratios at 1.54 and 1.03
- Low debt-to-equity at 0.32 and debt-to-assets at 21.5%
- Diverse revenue streams including Data Center and Enterprise Networking
- Strong fixed asset turnover at 5.56
- Broad geographic exposure with China and Southeast Asia
Texas Instruments Weaknesses
- Unfavorable high PE at 31.53 and PB at 9.69
- Overly high current ratio at 4.35 indicating potential inefficiency
- Neutral asset turnover at 0.51
- Moderate debt load with debt-to-assets at 40.62%
- Dividend yield exposes to payout risks
Marvell Technology Weaknesses
- Negative profitability with net margin at -15.35% and ROE at -6.59%
- Unfavorable WACC at 12.57% and interest coverage negative at -3.72
- Unfavorable asset turnover at 0.29
- Low dividend yield at 0.21%
- Unfavorable PB ratio at 7.27
Texas Instruments shows strong profitability and cash liquidity but faces valuation concerns and moderate leverage. Marvell Technology struggles with profitability and cost of capital despite solid liquidity and asset use efficiency. These contrasts highlight differing strategic and financial positions.
The Moat Duel: Analyzing Competitive Defensibility
A structural moat is the only reliable shield protecting long-term profits from relentless competition erosion:
Texas Instruments Incorporated: Analog Powerhouse with Enduring Cost Advantage
I see TI’s moat rooted in its cost advantage and broad analog portfolio. This yields high ROIC and stable 57% gross margins. New industrial and automotive markets in 2026 could deepen this advantage, though ROIC shows recent decline.
Marvell Technology, Inc.: Emerging Network Specialist Facing Profitability Challenges
Marvell’s moat leans on specialized Ethernet and storage solutions, differing from TI’s analog focus. Its ROIC is well below WACC, signaling value destruction. Expansion in data center chips offers upside, but profitability hurdles persist into 2026.
Cost Efficiency vs. Specialized Innovation: Who Defends Better?
TI’s wider moat stems from sustained cost leadership and robust margins, despite a declining ROIC trend. Marvell’s innovation is promising but undermined by persistent losses. TI stands better poised to defend market share in 2026.
Which stock offers better returns?
The past year shows Texas Instruments gaining strong momentum with a 30.43% price rise and accelerating trend. Marvell Technology also rose 17.63% but with deceleration in gains.
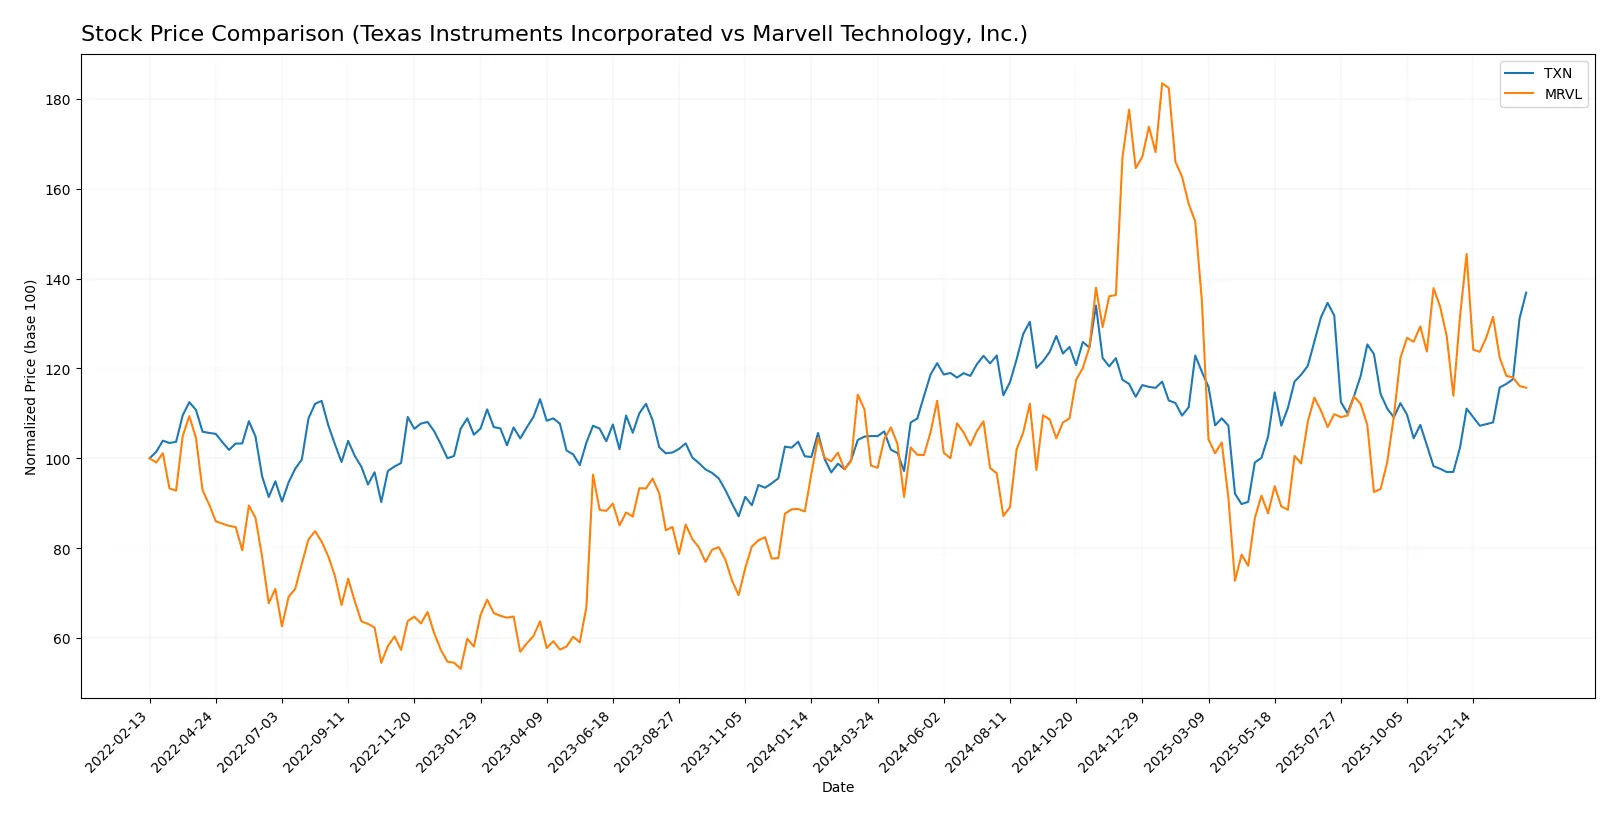
Trend Comparison
Texas Instruments recorded a bullish trend over 12 months with a 30.43% price increase, accelerating momentum, and a high volatility (16.28% std deviation). The stock hit a high of 225.01 and low of 147.6.
Marvell Technology showed a bullish but decelerating trend with a 17.63% gain over the year, similar volatility (16.41%) and price range between 49.43 and 124.76. Recent months show neutral trend signs.
Texas Instruments outperformed Marvell with higher overall returns and accelerating gains, while Marvell’s trend decelerated and showed near neutral performance recently.
Target Prices
Analysts present a mixed but generally optimistic target consensus for these semiconductor players.
| Company | Target Low | Target High | Consensus |
|---|---|---|---|
| Texas Instruments Incorporated | 160 | 260 | 205 |
| Marvell Technology, Inc. | 80 | 156 | 117 |
Texas Instruments trades near the upper end of its target range, indicating modest upside potential. Marvell’s consensus target suggests substantial upside from its current price near the low end of the range.

Don’t Let Luck Decide Your Entry Point
Optimize your entry points with our advanced ProRealTime indicators. You’ll get efficient buy signals with precise price targets for maximum performance. Start outperforming now!
How do institutions grade them?
Here is a summary of the recent institutional grades for Texas Instruments Incorporated and Marvell Technology, Inc.:
Texas Instruments Incorporated Grades
The following table shows recent grades assigned by established grading firms for Texas Instruments Incorporated.
| Grading Company | Action | New Grade | Date |
|---|---|---|---|
| Keybanc | Maintain | Overweight | 2026-01-28 |
| Deutsche Bank | Maintain | Hold | 2026-01-28 |
| Truist Securities | Maintain | Hold | 2026-01-28 |
| Cantor Fitzgerald | Maintain | Neutral | 2026-01-28 |
| Mizuho | Maintain | Underperform | 2026-01-28 |
| Stifel | Maintain | Hold | 2026-01-28 |
| UBS | Maintain | Buy | 2026-01-28 |
| Goldman Sachs | Maintain | Sell | 2026-01-28 |
| JP Morgan | Maintain | Overweight | 2026-01-28 |
| Jefferies | Maintain | Hold | 2026-01-28 |
Marvell Technology, Inc. Grades
Below are recent grades from recognized grading institutions for Marvell Technology, Inc.
| Grading Company | Action | New Grade | Date |
|---|---|---|---|
| Rosenblatt | Maintain | Buy | 2026-01-07 |
| Melius Research | Upgrade | Buy | 2026-01-05 |
| Benchmark | Downgrade | Hold | 2025-12-08 |
| JP Morgan | Maintain | Overweight | 2025-12-03 |
| Rosenblatt | Maintain | Buy | 2025-12-03 |
| Roth Capital | Maintain | Buy | 2025-12-03 |
| Oppenheimer | Maintain | Outperform | 2025-12-03 |
| B. Riley Securities | Maintain | Buy | 2025-12-03 |
| Wells Fargo | Maintain | Overweight | 2025-12-03 |
| Susquehanna | Maintain | Positive | 2025-12-03 |
Which company has the best grades?
Marvell Technology, Inc. generally holds more positive grades with multiple Buy and Outperform ratings. Texas Instruments shows a wider grade range, including Sell and Underperform. This divergence may influence investor sentiment and risk assessments differently.
Risks specific to each company
The following categories identify the critical pressure points and systemic threats facing both firms in the 2026 market environment:
1. Market & Competition
Texas Instruments Incorporated
- Large market cap of $204B supports strong competitive positioning in analog and embedded semiconductors.
Marvell Technology, Inc.
- Smaller $68B cap, faces intense competition in mixed-signal and storage markets with volatile margins.
2. Capital Structure & Debt
Texas Instruments Incorporated
- Debt-to-equity at 0.86 is moderate; interest coverage strong at 11.52x, indicating manageable leverage.
Marvell Technology, Inc.
- Lower debt-to-equity at 0.32 suggests conservative leverage but negative interest coverage (-3.72) signals distress.
3. Stock Volatility
Texas Instruments Incorporated
- Beta near 1 (0.995) implies stock moves roughly in line with market, reflecting stability.
Marvell Technology, Inc.
- Beta high at 1.978, indicating greater volatility and higher market risk.
4. Regulatory & Legal
Texas Instruments Incorporated
- Operates globally but benefits from longstanding US regulatory familiarity since 1930.
Marvell Technology, Inc.
- Exposure to multiple countries including China and Southeast Asia increases regulatory complexity and risk.
5. Supply Chain & Operations
Texas Instruments Incorporated
- Established supply chains with diversified products reduce operational disruption risk.
Marvell Technology, Inc.
- Complex supply chain across Asia and US may be vulnerable to geopolitical and logistical disruptions.
6. ESG & Climate Transition
Texas Instruments Incorporated
- Large industrial footprint requires ongoing ESG compliance; strong dividend yield reflects investor confidence.
Marvell Technology, Inc.
- Smaller scale may limit ESG program resources; low dividend yield could deter ESG-focused investors.
7. Geopolitical Exposure
Texas Instruments Incorporated
- US base with global sales offers moderate geopolitical risk but robust domestic support.
Marvell Technology, Inc.
- Extensive operations in Asia increase exposure to geopolitical tensions, particularly US-China relations.
Which company shows a better risk-adjusted profile?
Texas Instruments faces its largest risk in valuation metrics, with stretched P/E and P/B ratios despite strong fundamentals. Marvell’s critical risk lies in negative profitability and weak interest coverage, raising bankruptcy concerns. Given these factors, Texas Instruments shows a better risk-adjusted profile, supported by a robust Altman Z-Score of 9.44 versus Marvell’s 6.80. Marvell’s higher beta and operational complexity heighten risk, while Texas Instruments’ stable leverage and strong cash flow provide a safer investment foundation.
Final Verdict: Which stock to choose?
Texas Instruments shines as a cash-generating powerhouse with a strong economic moat rooted in efficient capital use. Its high current ratio signals liquidity strength but invites attention to inventory management. TXN suits portfolios targeting steady, slightly conservative growth with a margin of safety.
Marvell Technology’s strategic moat lies in its aggressive R&D and intangible assets, positioning it for innovation-driven growth. It carries higher financial risk and negative profitability, making it less stable than TXN. MRVL fits investors seeking high-reward, speculative opportunities with a focus on turnaround potential.
If you prioritize capital efficiency and stability, Texas Instruments outshines with consistent value creation and a robust balance sheet. However, if you seek growth fueled by innovation and can tolerate volatility, Marvell offers a speculative play with upside potential but higher risk. Each scenario reflects distinct investor risk profiles and strategic aims.
Disclaimer: Investment carries a risk of loss of initial capital. The past performance is not a reliable indicator of future results. Be sure to understand risks before making an investment decision.
Go Further
I encourage you to read the complete analyses of Texas Instruments Incorporated and Marvell Technology, Inc. to enhance your investment decisions: