Home > Comparison > Technology > MRVL vs TER
The strategic rivalry between Marvell Technology, Inc. and Teradyne, Inc. shapes the semiconductor industry’s evolution. Marvell operates as a diversified semiconductor designer, focusing on integrated circuits and storage solutions. Teradyne specializes in automated test equipment, supporting semiconductor manufacturing and industrial automation. This analysis unpacks their contrasting business models to identify which offers superior risk-adjusted returns and aligns best with a diversified investment portfolio amid ongoing technological shifts.
Table of contents
Companies Overview
Marvell Technology and Teradyne stand as pivotal players in the semiconductor industry, shaping key technology segments globally.
Marvell Technology, Inc.: Innovator in Integrated Circuits
Marvell dominates in designing and selling integrated circuits and Ethernet solutions. Its core revenue stems from storage controllers, network adapters, and embedded processors. In 2026, Marvell’s strategic focus remains on expanding its portfolio across data infrastructure and cloud markets, leveraging advanced ASICs and high-performance connectivity products.
Teradyne, Inc.: Leader in Automated Test Equipment
Teradyne excels in automated test equipment for semiconductor and wireless device manufacturers. Its revenue is driven by semiconductor test platforms, industrial automation robotics, and wireless testing solutions. The company’s 2026 strategy emphasizes growth in industrial automation and 5G wireless testing, targeting broad adoption across manufacturing and communications sectors.
Strategic Collision: Similarities & Divergences
Both firms anchor their business on semiconductor technology, yet Marvell pursues a product-centric, component manufacturing model while Teradyne emphasizes test systems and automation. Their primary battleground lies in serving semiconductor manufacturing value chains—Marvell through chip innovation, Teradyne via quality assurance and automation. These contrasting models offer distinct investment profiles: Marvell as a chip innovator and Teradyne as a technology enabler.
Income Statement Comparison
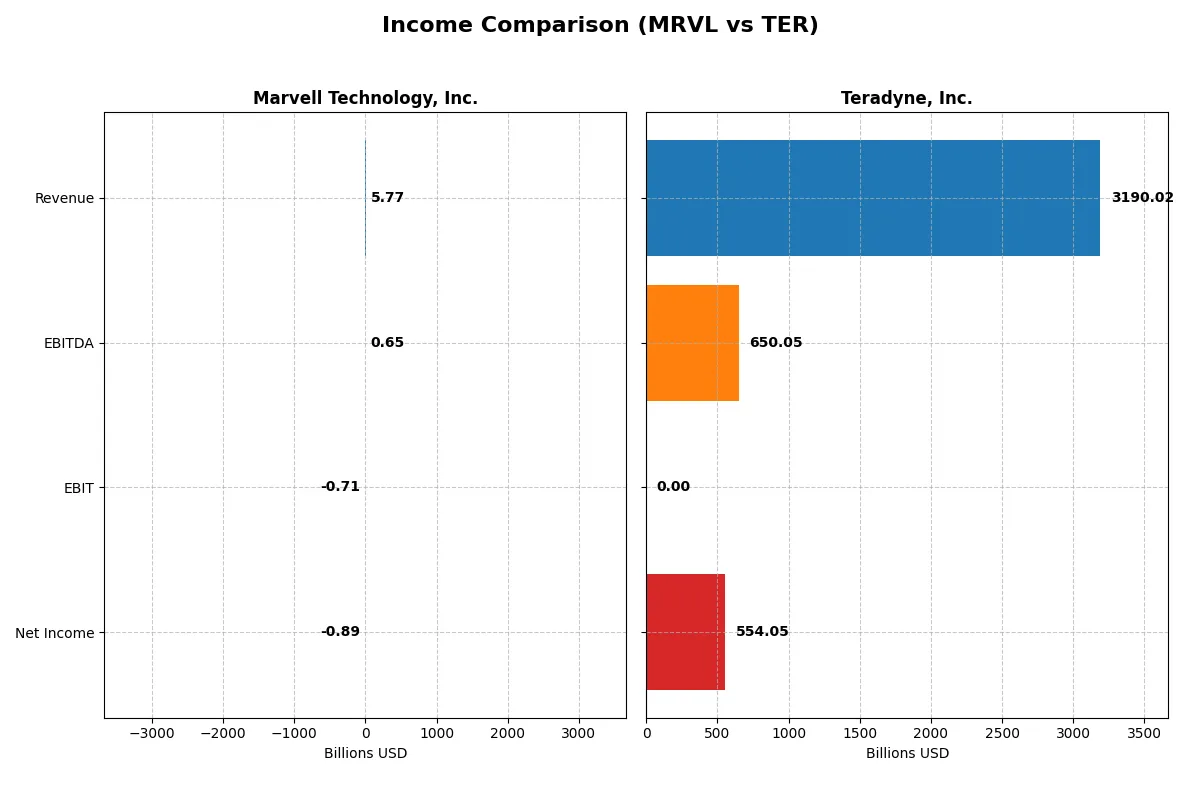
This data dissects the core profitability and scalability of both corporate engines to reveal who dominates the bottom line:
| Metric | Marvell Technology, Inc. (MRVL) | Teradyne, Inc. (TER) |
|---|---|---|
| Revenue | 5.77B | 3.19T |
| Cost of Revenue | 3.39B | 1.33T |
| Operating Expenses | 3.10B | 1.21T |
| Gross Profit | 2.38B | 1.86T |
| EBITDA | 652M | 650B |
| EBIT | -705M | 0 |
| Interest Expense | 189M | -3.21B |
| Net Income | -885M | 554B |
| EPS | -1.02 | 3.48 |
| Fiscal Year | 2025 | 2025 |
Income Statement Analysis: The Bottom-Line Duel
This income statement comparison exposes which company runs a more efficient and profitable business engine in the current market environment.
Marvell Technology, Inc. Analysis
Marvell’s revenue displays steady growth, reaching $5.77B in 2025, up 4.7% from 2024. However, net income remains negative at -$885M, reflecting ongoing profitability challenges. The gross margin holds favorably at 41.3%, but the net margin is deeply unfavorable at -15.4%, signaling high costs and operational inefficiencies that erode bottom-line results despite revenue momentum.
Teradyne, Inc. Analysis
Teradyne’s revenue surged dramatically to $3.19T in 2025, more than doubling from the prior year, while net income rose to a robust $554B. The company maintains a strong gross margin of 58.2% and a positive net margin of 17.4%, underscoring superior cost control and operational leverage. Despite an unusual zero EBIT margin reported, Teradyne’s scale and profitability dominate, suggesting effective capital allocation and market positioning.
Verdict: Scale Leadership vs. Margin Resilience
Teradyne clearly outperforms Marvell with massive revenue and positive net income, showcasing its dominant market position and efficient cost structure. Marvell’s improving revenue fails to offset persistent losses and margin pressure. For investors, Teradyne’s profile offers compelling profitability and scale, while Marvell’s remains a riskier turnaround story with weaker fundamental earnings quality.
Financial Ratios Comparison
These vital ratios act as a diagnostic tool to expose the underlying fiscal health, valuation premiums, and capital efficiency of the companies compared below:
| Ratios | Marvell Technology, Inc. (MRVL) | Teradyne, Inc. (TER) |
|---|---|---|
| ROE | -6.6% | 19.2% |
| ROIC | -3.9% | 17.2% |
| P/E | -110.4 (negative earnings) | 36.9 |
| P/B | 7.27 | 7.11 |
| Current Ratio | 1.54 | 2.91 |
| Quick Ratio | 1.03 | 1.84 |
| D/E (Debt-to-Equity) | 0.32 | 0.03 |
| Debt-to-Assets | 21.5% | 2.1% |
| Interest Coverage | -3.80 (negative) | 165.5 |
| Asset Turnover | 0.29 | 0.76 |
| Fixed Asset Turnover | 5.56 | 4.88 |
| Payout Ratio | -23.4% (negative) | 14.1% |
| Dividend Yield | 0.21% | 0.38% |
| Fiscal Year | 2025 | 2024 |
Efficiency & Valuation Duel: The Vital Signs
Financial ratios act as a company’s DNA, exposing hidden risks and revealing operational strengths critical for investment decisions.
Marvell Technology, Inc.
Marvell shows weak profitability with negative ROE at -6.59% and a steep net margin of -15.35%, signaling operational challenges. Despite a favorable P/E reflecting earnings losses, its valuation appears stretched with a high P/B of 7.27. The company returns modest dividends but primarily reinvests aggressively in R&D, aiming for growth amid current setbacks.
Teradyne, Inc.
Teradyne reports strong profitability with a 19.24% ROE and a solid net margin of 19.23%, reflecting efficient operations. Its P/E of 36.93 is expensive, paired with a high P/B of 7.11, indicating premium valuation. Teradyne maintains healthy liquidity and modest dividends, balancing shareholder returns with steady investment in innovation and operational excellence.
Profitability Strength vs. Valuation Stretch
Teradyne delivers superior profitability and operational efficiency, albeit at a premium price, while Marvell struggles with losses despite growth investments. Investors prioritizing stable returns may lean toward Teradyne, whereas those seeking turnaround potential might consider Marvell’s riskier profile.
Which one offers the Superior Shareholder Reward?
I see Marvell Technology (MRVL) and Teradyne (TER) both distribute returns via dividends and buybacks but differ sharply in strategy. MRVL pays a low dividend yield (~0.21%), with negative payout ratios signaling losses, but sustains moderate buyback activity, reflecting reinvestment focus amid margin pressure. TER yields ~0.38%, with a conservative payout ratio (~15%), strong free cash flow (~3B/share), and robust buybacks, supported by superior margins and cash flow. Historically, TER’s distribution is more sustainable and aligned with long-term value, while MRVL’s model carries risk due to negative earnings. I conclude TER offers a superior total shareholder reward in 2026, balancing yield, buybacks, and financial health.
Comparative Score Analysis: The Strategic Profile
The radar chart reveals the fundamental DNA and trade-offs of Marvell Technology and Teradyne, highlighting their financial strengths and valuation nuances:
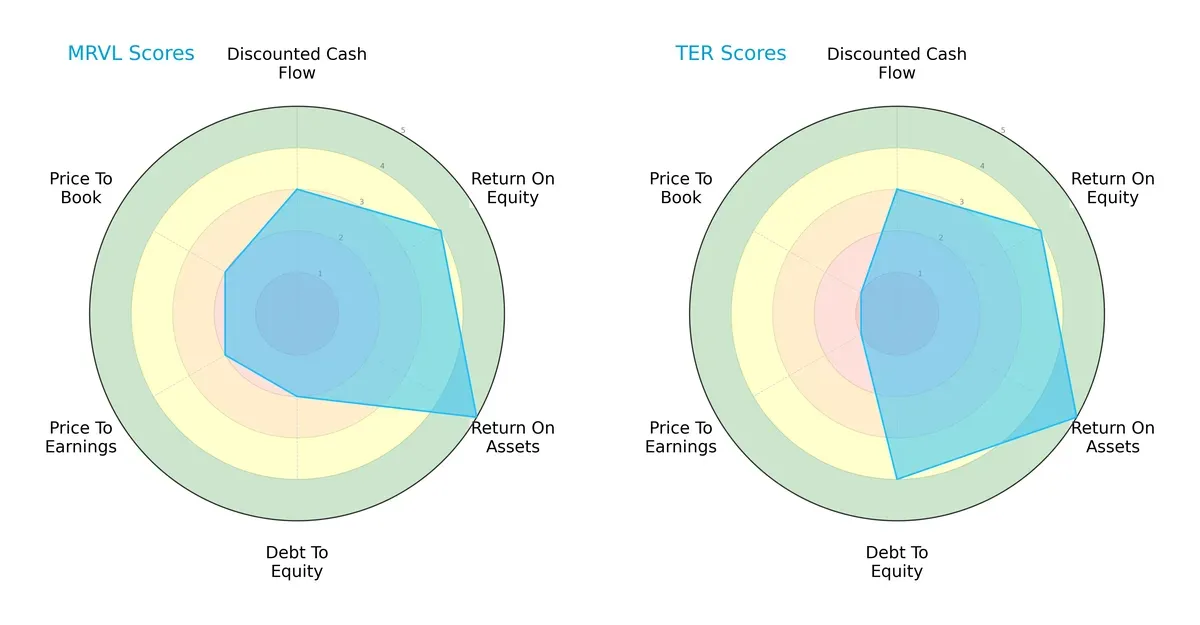
Both companies share identical overall and DCF scores, reflecting similar intrinsic valuation assessments. Marvell excels in asset efficiency with a top ROA score of 5, matched by Teradyne, while both present strong ROE scores of 4. However, Teradyne’s debt-to-equity score of 4 indicates a more conservative balance sheet compared to Marvell’s moderate 2, signaling lower financial risk. Valuation scores (P/E and P/B) favor Marvell slightly with moderate ratings, whereas Teradyne’s very unfavorable low scores suggest it may be overvalued or priced aggressively. Marvell exhibits a more balanced profile, while Teradyne relies more on its capital structure strength.
—
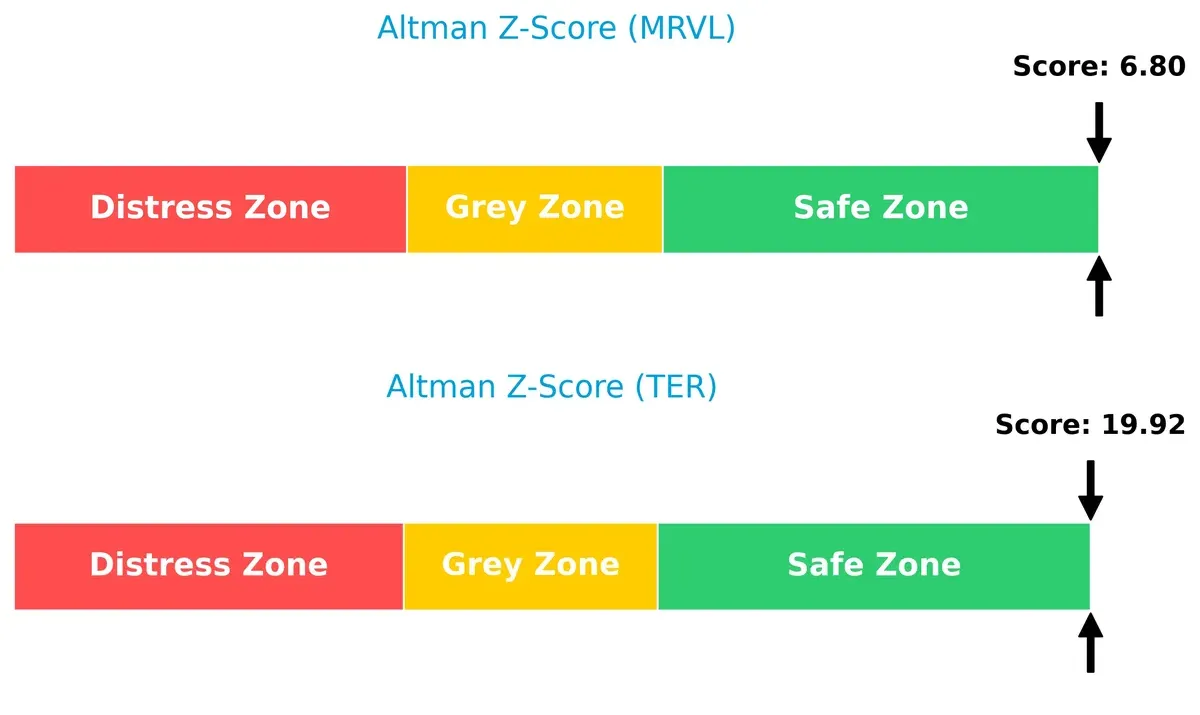
Bankruptcy Risk: Solvency Showdown
Teradyne’s Altman Z-Score of 19.9 far exceeds Marvell’s 6.8, placing both safely above distress thresholds; Teradyne displays exceptional solvency and margin for error in this cycle:
—
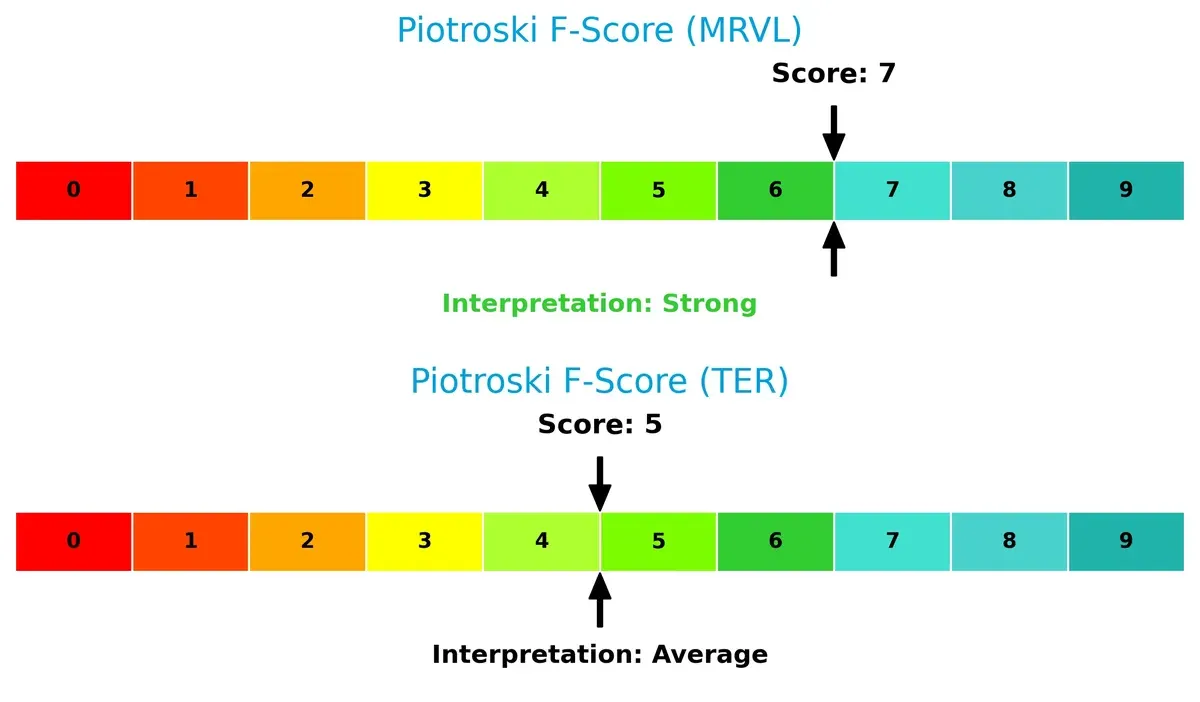
Financial Health: Quality of Operations
Marvell’s Piotroski F-Score of 7 outperforms Teradyne’s 5, signaling stronger internal financial health and operational quality. Teradyne’s average score warrants scrutiny as it may hide emerging red flags:
How are the two companies positioned?
This section dissects the operational DNA of Marvell Technology and Teradyne by comparing their revenue distribution and internal strengths and weaknesses. The goal is to confront their economic moats to reveal which model offers the most resilient competitive advantage today.
Revenue Segmentation: The Strategic Mix
This comparison dissects how Marvell Technology and Teradyne diversify their income streams and highlights where their primary sector bets lie:
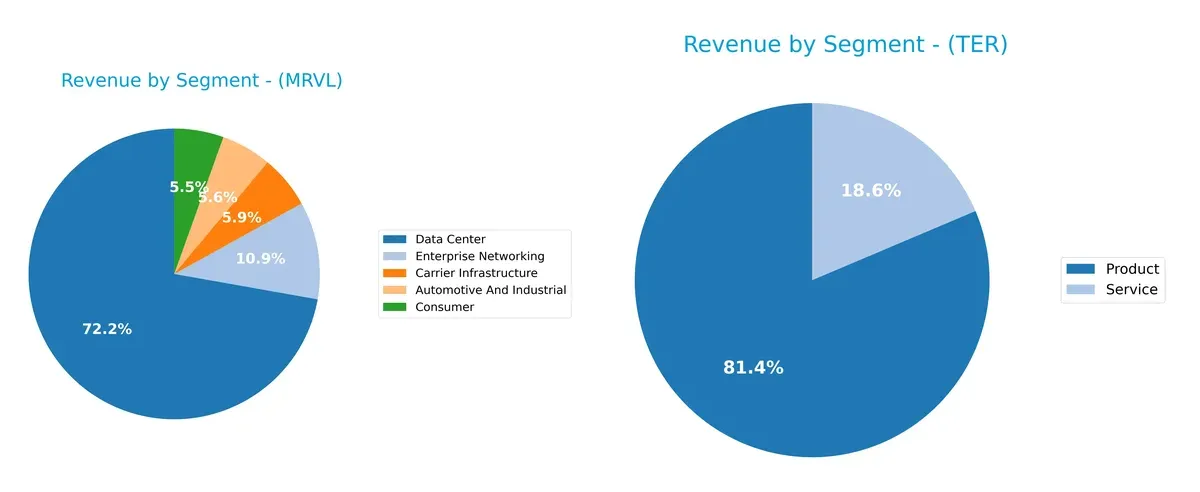
Marvell pivots heavily on Data Center at $4.16B, dwarfing its next largest segment, Enterprise Networking at $626M. This concentration anchors its strategy in infrastructure dominance but raises concentration risk. Teradyne’s revenue splits between Product at $2.29B and Service at $525M, reflecting a more balanced portfolio. Teradyne’s diversification cushions against market shifts, while Marvell’s heavy Data Center reliance bets on ecosystem lock-in.
Strengths and Weaknesses Comparison
This table compares the Strengths and Weaknesses of Marvell Technology, Inc. and Teradyne, Inc.:
Marvell Technology Strengths
- Diverse revenue streams including Data Center and Enterprise Networking
- Solid current and quick ratios above 1
- Low debt-to-assets ratio at 21.5%
- High fixed asset turnover at 5.56
Teradyne Strengths
- Strong profitability with net margin and ROE above 19%
- Excellent liquidity with current ratio near 3
- Minimal debt-to-assets at 2.07%
- Consistent fixed asset turnover near 4.88
Marvell Technology Weaknesses
- Negative profitability ratios: net margin, ROE, ROIC below zero
- High WACC at 12.57% against negative returns
- Weak interest coverage ratio negative at -3.72
- Asset turnover low at 0.29
- Elevated price-to-book ratio at 7.27
Teradyne Weaknesses
- Elevated price-to-earnings ratio at 36.93
- Interest coverage close to zero, signaling tight expense control
- Dividend yield low at 0.38%
- Asset turnover neutral at 0.76
Marvell exhibits strengths in asset efficiency and liquidity but struggles with profitability and cost of capital. Teradyne shows robust profitability and financial health, though valuation multiples and marginal interest coverage warrant caution. Each company’s financial profile highlights distinct strategic challenges and opportunities.
The Moat Duel: Analyzing Competitive Defensibility
A structural moat shields long-term profits from relentless competition erosion. Without it, firms risk margin collapse and value destruction:
Marvell Technology, Inc.: Cost Advantage Moat
Marvell leverages cost advantages through integrated circuit design scale, delivering stable gross margins near 41%. However, declining ROIC signals weakening profitability, risking future moat erosion despite growth in new Ethernet and storage markets.
Teradyne, Inc.: Specialized Equipment Network Effects
Teradyne commands network effects in automatic test equipment, supporting semiconductor fabs and fabless firms. Its superior gross margin of 58% evidences strong competitive positioning. Yet, declining ROIC and volatile EBIT growth warn of margin pressure amid expansion into industrial automation.
Verdict: Cost Leadership vs. Network Effects Resilience
Marvell’s widening cost advantage is undermined by negative ROIC and margin pressure. Teradyne’s network moat shows stronger margin metrics but also faces profitability headwinds. Teradyne currently holds the deeper moat, better equipped to defend market share through specialized customer lock-in and diversified end markets.
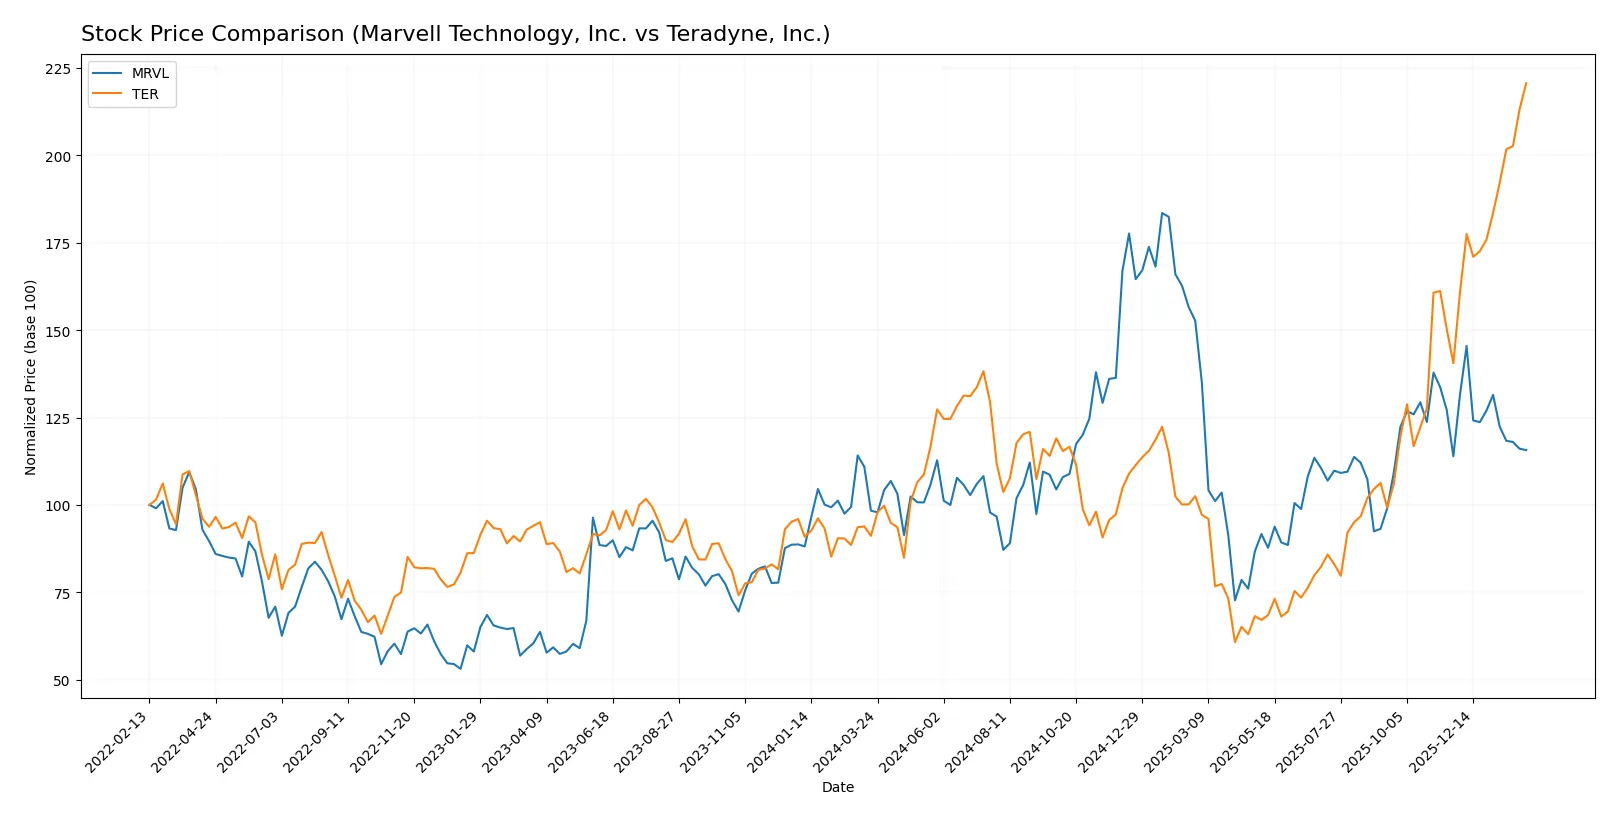
Which stock offers better returns?
Over the past 12 months, Marvell Technology, Inc. and Teradyne, Inc. exhibited distinct bullish price trends, with Teradyne’s gains markedly surpassing Marvell’s, reflecting stronger market momentum and buyer dominance.
Trend Comparison
Marvell Technology’s stock rose 17.63% over the last year, showing a bullish trend but with decelerating momentum and a high volatility of 16.41%. It peaked at $124.76 and bottomed at $49.43.
Teradyne’s stock surged 142.12% in the same period, displaying a bullish trend with accelerating price gains and greater volatility at 38.54%. Its range spanned from $68.72 to $249.53.
Teradyne outperformed Marvell by a wide margin, delivering the highest market return and stronger upward acceleration over the past year.
Target Prices
Analysts present a strong target consensus indicating upside potential for both Marvell Technology and Teradyne.
| Company | Target Low | Target High | Consensus |
|---|---|---|---|
| Marvell Technology, Inc. | 80 | 156 | 117 |
| Teradyne, Inc. | 136 | 280 | 230.17 |
The consensus targets for Marvell and Teradyne exceed current prices by 49% and 8%, respectively, signaling analyst optimism amid tech sector volatility.

Don’t Let Luck Decide Your Entry Point
Optimize your entry points with our advanced ProRealTime indicators. You’ll get efficient buy signals with precise price targets for maximum performance. Start outperforming now!
How do institutions grade them?
The following tables summarize recent institutional grades for Marvell Technology, Inc. and Teradyne, Inc.:
Marvell Technology, Inc. Grades
This table shows recent grade actions from notable grading companies for Marvell Technology:
| Grading Company | Action | New Grade | Date |
|---|---|---|---|
| Rosenblatt | Maintain | Buy | 2026-01-07 |
| Melius Research | Upgrade | Buy | 2026-01-05 |
| Benchmark | Downgrade | Hold | 2025-12-08 |
| JP Morgan | Maintain | Overweight | 2025-12-03 |
| Rosenblatt | Maintain | Buy | 2025-12-03 |
| Roth Capital | Maintain | Buy | 2025-12-03 |
| Oppenheimer | Maintain | Outperform | 2025-12-03 |
| B. Riley Securities | Maintain | Buy | 2025-12-03 |
| Wells Fargo | Maintain | Overweight | 2025-12-03 |
| Susquehanna | Maintain | Positive | 2025-12-03 |
Teradyne, Inc. Grades
Below are recent grades and updates from prominent grading companies for Teradyne:
| Grading Company | Action | New Grade | Date |
|---|---|---|---|
| Cantor Fitzgerald | Maintain | Overweight | 2026-02-02 |
| Stifel | Maintain | Buy | 2026-01-30 |
| UBS | Maintain | Buy | 2026-01-26 |
| B of A Securities | Maintain | Buy | 2026-01-22 |
| Stifel | Maintain | Buy | 2026-01-14 |
| B of A Securities | Maintain | Buy | 2026-01-13 |
| Goldman Sachs | Upgrade | Buy | 2025-12-16 |
| Stifel | Upgrade | Buy | 2025-12-02 |
| Citigroup | Maintain | Buy | 2025-11-12 |
| JP Morgan | Maintain | Neutral | 2025-10-30 |
Which company has the best grades?
Teradyne consistently receives “Buy” and “Overweight” ratings, with multiple recent upgrades. Marvell shows more mixed signals, including a recent downgrade to “Hold.” Teradyne’s stronger and more stable grades may signal greater institutional confidence, potentially influencing investor sentiment positively.
Risks specific to each company
The following categories identify critical pressure points and systemic threats facing Marvell Technology, Inc. and Teradyne, Inc. in the 2026 market environment:
1. Market & Competition
Marvell Technology, Inc.
- Faces intense competition in semiconductors with pressure on margins amid innovation cycles.
Teradyne, Inc.
- Competes in test equipment with diversified segments but exposed to cyclical semiconductor demand.
2. Capital Structure & Debt
Marvell Technology, Inc.
- Moderate leverage with debt-to-assets at 21.5%, but negative interest coverage signals risk.
Teradyne, Inc.
- Very low debt-to-assets (2.07%) and strong balance sheet, yet interest coverage near zero raises caution.
3. Stock Volatility
Marvell Technology, Inc.
- High beta of 1.978 indicates above-average stock volatility versus market benchmarks.
Teradyne, Inc.
- Beta at 1.821 also signals notable volatility but slightly less than Marvell.
4. Regulatory & Legal
Marvell Technology, Inc.
- Global operations expose it to complex semiconductor export controls and IP risks.
Teradyne, Inc.
- Diverse product lines face regulatory scrutiny in defense and automation sectors.
5. Supply Chain & Operations
Marvell Technology, Inc.
- Supply chain complexity across Asia may face disruption and cost inflation risks.
Teradyne, Inc.
- Relies on global manufacturing partners; automation segment sensitive to component shortages.
6. ESG & Climate Transition
Marvell Technology, Inc.
- Increasing pressure to improve energy efficiency in chip production and reduce carbon footprint.
Teradyne, Inc.
- Robotics and automation offer ESG opportunities, but climate transition costs remain uncertain.
7. Geopolitical Exposure
Marvell Technology, Inc.
- Significant exposure to China and Taiwan increases risk from US-China tensions.
Teradyne, Inc.
- U.S.-centric with global sales; less direct exposure but sensitive to trade restrictions.
Which company shows a better risk-adjusted profile?
Marvell’s greatest risk lies in weak profitability and interest coverage, compounded by geopolitical exposure and supply chain complexity. Teradyne’s chief risk is its near-zero interest coverage despite a pristine balance sheet. Teradyne’s stronger margins and liquidity create a slightly better risk-adjusted profile. Its recent 3.5% stock price surge reflects investor confidence in operational resilience and diversified revenue streams.
Final Verdict: Which stock to choose?
Marvell Technology’s superpower lies in its relentless investment in R&D, fueling innovation that keeps it relevant in a fiercely competitive semiconductor space. However, its ongoing value destruction and negative returns on capital warrant caution. It suits aggressive growth portfolios willing to tolerate operational volatility.
Teradyne benefits from a strategic moat rooted in automation and test equipment dominance, delivering steady returns and strong cash flow quality. Its balance sheet strength and profitability offer better stability compared to Marvell. This makes it appealing for GARP investors seeking growth with a margin of safety.
If you prioritize innovation-led growth and can stomach short-term financial headwinds, Marvell might be the compelling choice due to its capacity to reshape market opportunities. However, if you seek stable profitability and a proven business moat, Teradyne offers better stability and cash flow reliability, though it commands a premium valuation.
Disclaimer: Investment carries a risk of loss of initial capital. The past performance is not a reliable indicator of future results. Be sure to understand risks before making an investment decision.
Go Further
I encourage you to read the complete analyses of Marvell Technology, Inc. and Teradyne, Inc. to enhance your investment decisions: