Home > Comparison > Technology > MRVL vs STM
The strategic rivalry between Marvell Technology, Inc. and STMicroelectronics N.V. shapes the semiconductor industry’s evolution. Marvell operates as a focused designer of integrated circuits, emphasizing Ethernet and storage solutions. In contrast, STMicroelectronics runs a diversified manufacturing model spanning automotive, industrial, and consumer semiconductors. This head-to-head pits specialized innovation against broad industrial scale. This analysis aims to identify which company’s trajectory offers superior risk-adjusted returns for a diversified portfolio in 2026.
Table of contents
Companies Overview
Marvell Technology and STMicroelectronics stand as pivotal semiconductor players shaping global technology markets.
Marvell Technology, Inc.: High-Performance Connectivity Specialist
Marvell dominates the semiconductor space by designing and selling integrated circuits for Ethernet, storage, and networking solutions. Its revenue stems largely from controllers, processors, and ASICs powering data infrastructure. In 2026, Marvell strategically focuses on expanding its portfolio in high-speed connectivity and storage to capitalize on cloud and 5G growth.
STMicroelectronics N.V.: Diverse Semiconductor Innovator
STMicroelectronics commands a broad semiconductor footprint with products spanning automotive ICs, sensors, microcontrollers, and power transistors. Its revenue engine relies on diversified segments targeting automotive, industrial, and personal electronics markets worldwide. The firm’s 2026 strategy centers on enhancing analog, MEMS, and digital IC technologies to reinforce its leadership across multiple industries.
Strategic Collision: Similarities & Divergences
Both companies emphasize semiconductor design innovation, yet Marvell pursues a focused high-performance connectivity niche while STMicroelectronics opts for a diversified product mix. Their primary battleground lies in supplying critical components for automotive and industrial applications. Marvell offers a concentrated growth profile, whereas STMicroelectronics presents a broader, more balanced exposure across sectors and geographies.
Income Statement Comparison
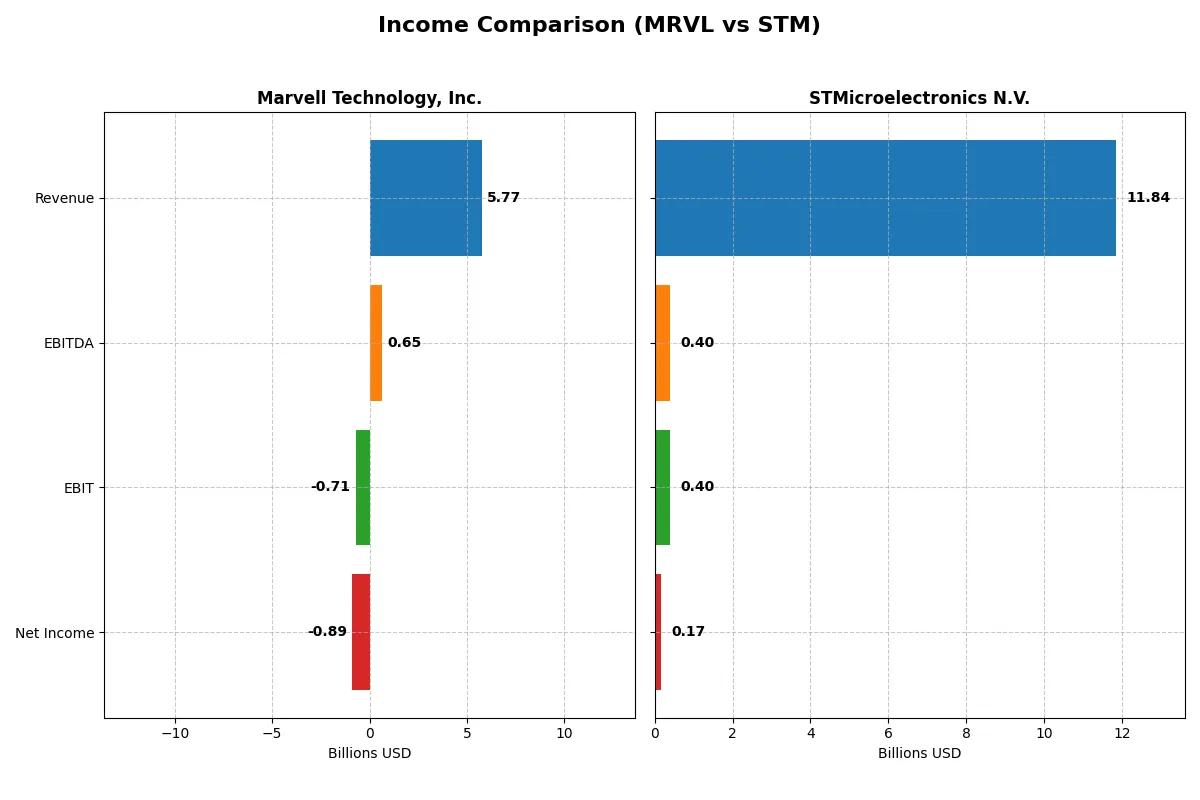
The following data dissects the core profitability and scalability of both corporate engines to reveal who dominates the bottom line:
| Metric | Marvell Technology, Inc. (MRVL) | STMicroelectronics N.V. (STM) |
|---|---|---|
| Revenue | 5.77B | 11.84B |
| Cost of Revenue | 3.39B | 7.83B |
| Operating Expenses | 3.10B | 3.69B |
| Gross Profit | 2.38B | 4.01B |
| EBITDA | 652M | 401M |
| EBIT | -705M | 401M |
| Interest Expense | 189M | 0 |
| Net Income | -885M | 167M |
| EPS | -1.02 | 0.19 |
| Fiscal Year | 2025 | 2025 |
Income Statement Analysis: The Bottom-Line Duel
This income statement comparison reveals which company runs a more efficient and resilient financial engine in the current market cycle.
Marvell Technology, Inc. Analysis
Marvell’s revenue rose steadily, reaching $5.77B in 2025, but net income remains deeply negative at -$885M. Gross margin stays healthy at 41.3%, yet EBIT margin is sharply negative at -12.2%, reflecting operational challenges. Recent momentum shows slight revenue growth but deteriorating profitability, signaling cost pressures outpacing sales gains.
STMicroelectronics N.V. Analysis
STMicroelectronics posted $11.8B revenue in 2025, down 10.8% year-over-year, with net income of $167M, a steep decline from previous years. Gross margin at 33.9% is respectable but EBIT margin is only 3.4%, showing limited operating leverage. The company faces shrinking revenues and earnings, signaling a loss of momentum amid persistent margin compression.
Resilience in Growth vs. Margin Compression in Decline
Marvell demonstrates stronger revenue growth over five years (+94%) but struggles with sustained losses and negative EBIT margins. STMicroelectronics shows solid gross profits but faces significant revenue and net income declines (-7.2% and -91.7% overall). For investors, Marvell’s growth profile offers upside potential despite losses; STMicroelectronics’ shrinking scale and margins suggest a riskier outlook.
Financial Ratios Comparison
These vital ratios act as a diagnostic tool to expose the underlying fiscal health, valuation premiums, and capital efficiency of the companies compared below:
| Ratios | Marvell Technology, Inc. (MRVL) | STMicroelectronics N.V. (STM) |
|---|---|---|
| ROE | -6.6% | 9.3% |
| ROIC | -3.9% | 0.7% |
| P/E | -110.4 | 0 |
| P/B | 7.27 | 0 |
| Current Ratio | 1.54 | 3.36 |
| Quick Ratio | 1.03 | 2.43 |
| D/E | 0.32 | 0.12 |
| Debt-to-Assets | 21.5% | 8.6% |
| Interest Coverage | -3.8 | 0 |
| Asset Turnover | 0.29 | 0.48 |
| Fixed Asset Turnover | 5.56 | 1.07 |
| Payout ratio | -23.4% | 0 |
| Dividend yield | 0.21% | 0% |
| Fiscal Year | 2025 | 2025 |
Efficiency & Valuation Duel: The Vital Signs
Financial ratios serve as a company’s DNA, uncovering hidden risks and revealing operational strengths critical for investment insight.
Marvell Technology, Inc.
Marvell shows negative profitability with a -6.59% ROE and -15.35% net margin, signaling operational challenges. Its valuation is stretched with a high price-to-book ratio of 7.27 despite a favorable negative P/E, reflecting market skepticism. Shareholder returns are minimal, with a 0.21% dividend yield indicating limited income focus and potential reinvestment in R&D (34% of revenue).
STMicroelectronics N.V.
STMicroelectronics posts modest profitability, with a 0.93% ROE and 1.41% net margin, indicating operational efficiency struggles. The stock’s valuation appears reasonable, backed by favorable P/E and P/B ratios. Its balance sheet is strong with a 3.36 current ratio. The company offers no dividend, emphasizing growth reinvestment, including 17% of revenue allocated to R&D.
Operational Struggles vs. Valuation Discipline
Marvell’s negative returns and stretched valuation present higher risk despite R&D investment. STMicroelectronics balances modest profitability with solid liquidity and valuation metrics. Investors prioritizing stability may favor STMicroelectronics, while those seeking innovation exposure might consider Marvell’s reinvestment strategy despite earnings pressure.
Which one offers the Superior Shareholder Reward?
I compare Marvell Technology’s modest 0.35% dividend yield and negative payout ratio—signaling reinvestment—with STM’s 1.28% yield and conservative 18% payout. Marvell’s aggressive buybacks fuel shareholder returns despite losses. STM’s consistent profits and steady dividends, plus capex near free cash flow, suggest sustainable growth. I favor STM for balanced income and growth in 2026.
Comparative Score Analysis: The Strategic Profile
The radar chart reveals the core financial DNA and trade-offs each company makes in operational efficiency, leverage, and valuation metrics:
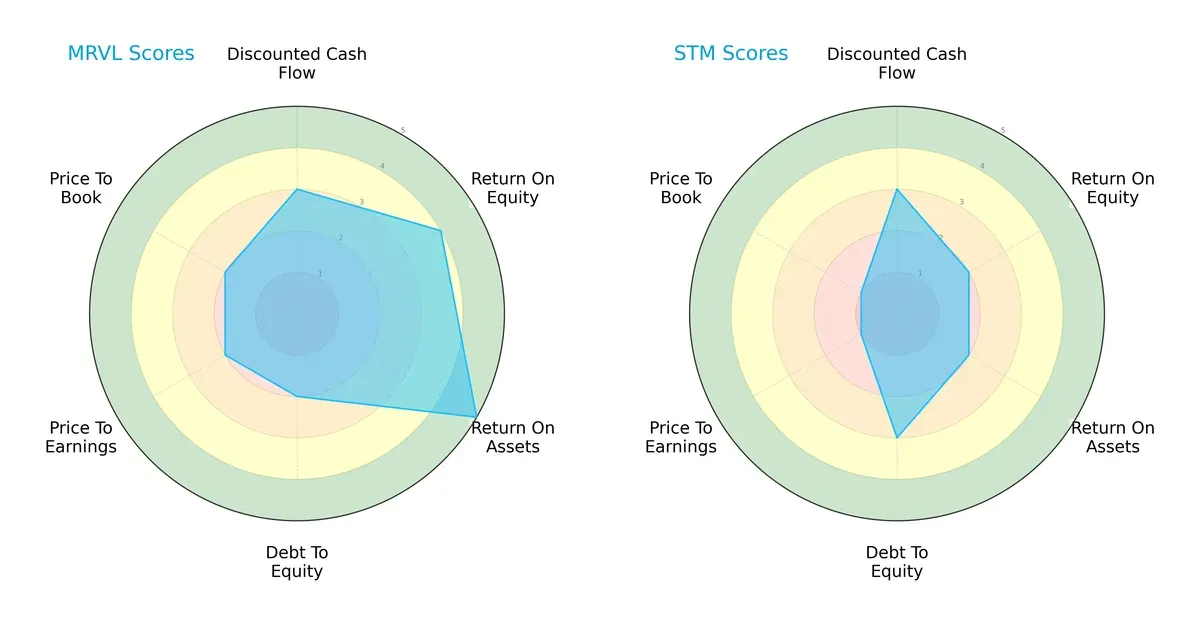
Marvell Technology, Inc. (MRVL) excels in asset efficiency (ROA 5) and equity returns (ROE 4), showing strong operational leverage. STMicroelectronics N.V. (STM) scores moderately across the board but suffers from weak valuation metrics (P/E and P/B at 1), signaling potential overvaluation. MRVL’s slightly higher debt risk (Debt/Equity 2 vs. STM’s 3) is offset by stronger profitability, making MRVL’s profile more balanced. STM leans on financial conservatism but lacks the profitability edge MRVL commands.
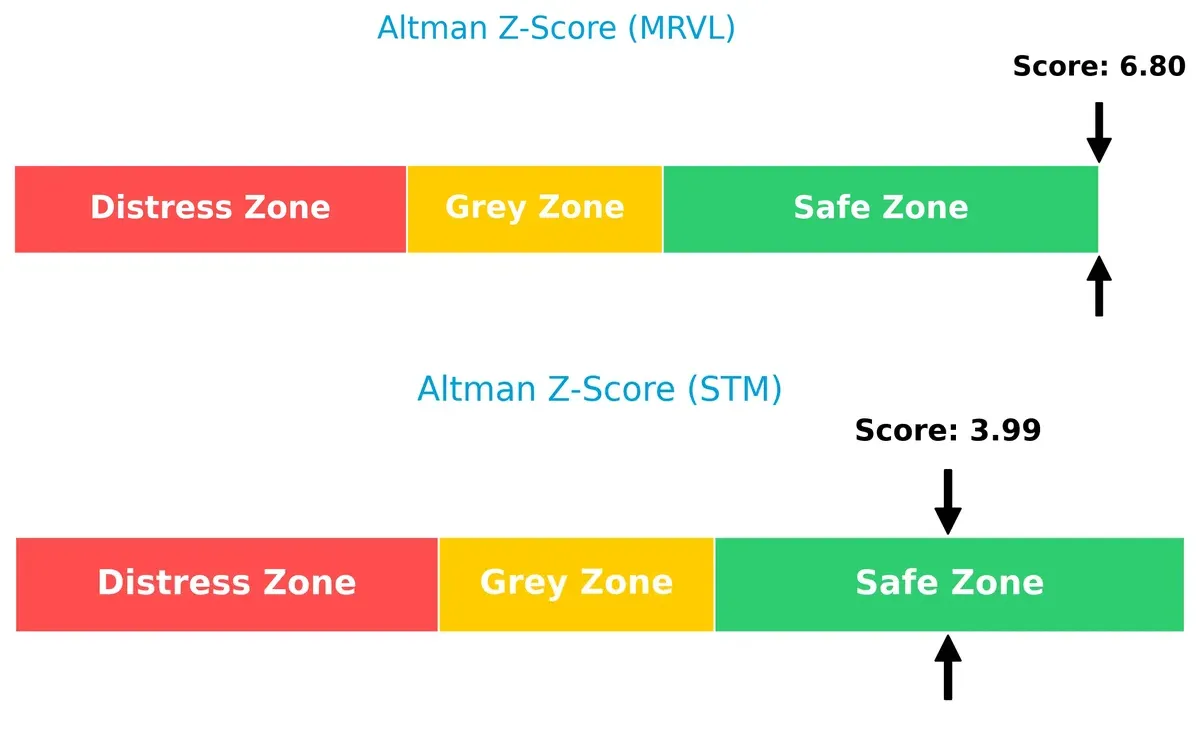
Bankruptcy Risk: Solvency Showdown
The Altman Z-Score gap indicates both firms are financially solvent, yet MRVL’s superior 6.8 score demonstrates a safer margin against bankruptcy than STM’s 4.0, reflecting greater resilience in this market cycle:
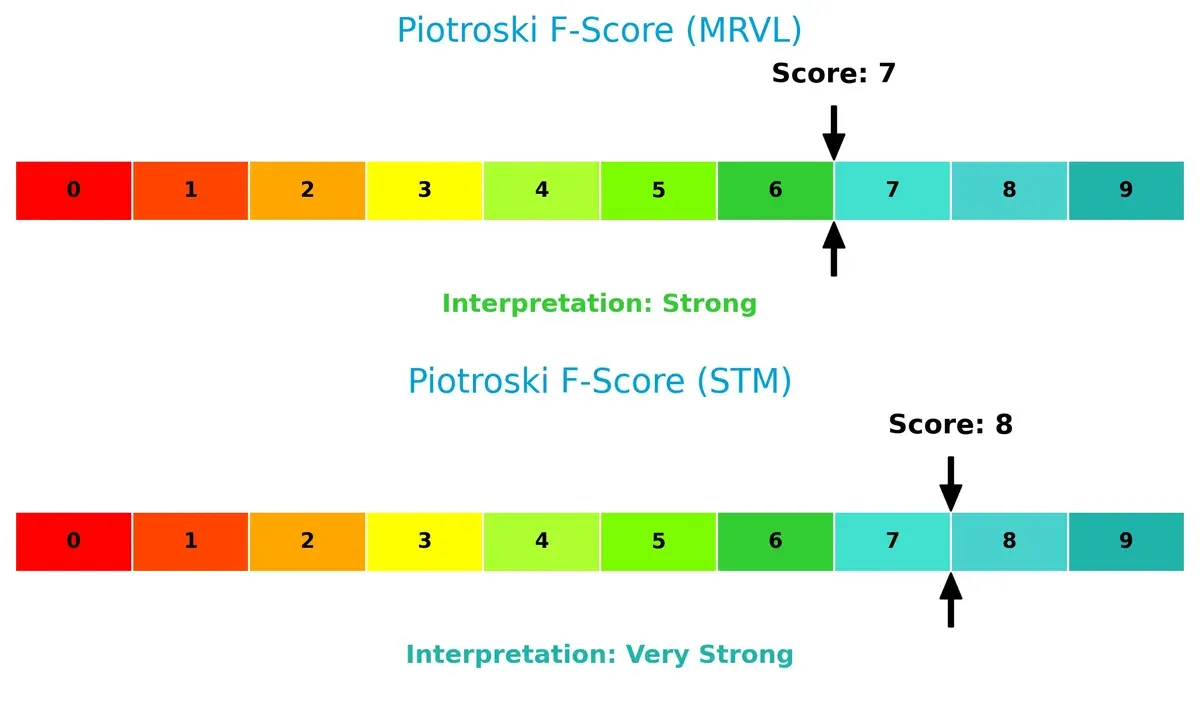
Financial Health: Quality of Operations
Piotroski scores confirm both companies maintain strong financial health, with STM edging MRVL at 8 versus 7. STM’s slightly higher score suggests marginally better internal financial quality and operational strength, though both remain robust:
How are the two companies positioned?
This section dissects Marvell and STMicroelectronics’ operational DNA by comparing their revenue distribution and internal strengths and weaknesses. The goal is to confront their economic moats to identify which model delivers a more resilient, sustainable competitive advantage today.
Revenue Segmentation: The Strategic Mix
This visual comparison dissects how Marvell Technology and STMicroelectronics diversify their income streams and reveals where their primary sector bets lie:
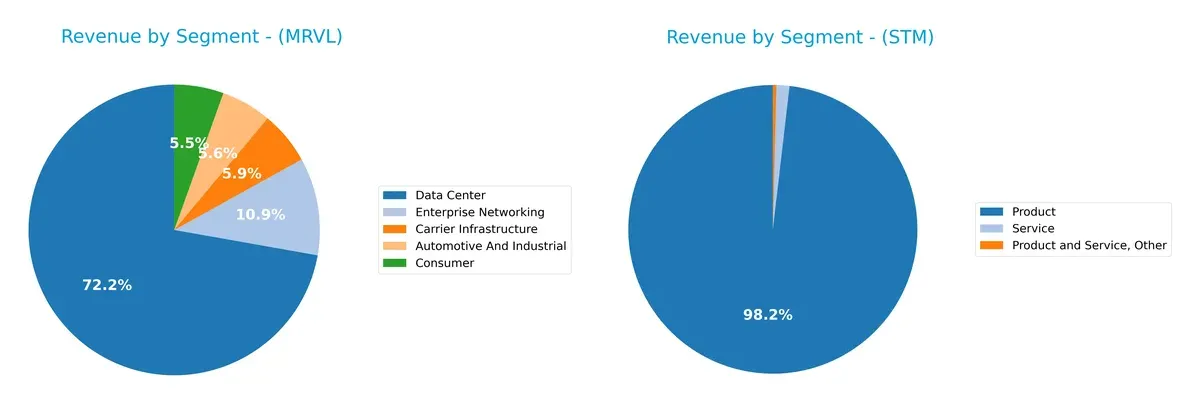
Marvell Technology anchors its revenue in Data Center at $4.16B, dwarfing its other segments like Enterprise Networking ($626M) and Carrier Infrastructure ($338M). This concentration signals a strong infrastructure dominance but introduces concentration risk. STMicroelectronics pivots around a broad Product segment, generating $13.2B with minimal Service and Other revenues. Its more consolidated segmentation suggests less diversification but benefits from ecosystem lock-in within mixed semiconductor markets.
Strengths and Weaknesses Comparison
This table compares the Strengths and Weaknesses of Marvell Technology, Inc. and STMicroelectronics N.V.:
Marvell Technology Strengths
- Diverse revenue streams across data center, networking, automotive, and consumer segments
- Favorable liquidity ratios with current ratio at 1.54 and quick ratio at 1.03
- Conservative leverage with debt-to-assets at 21.5% and interest coverage near breakeven
STMicroelectronics Strengths
- Broad product portfolio with strong service and product revenue
- Very low debt-to-assets at 8.6% and strong interest coverage
- Favorable price metrics (PE and PB) and solid quick ratio of 2.43
Marvell Technology Weaknesses
- Negative profitability metrics: net margin -15.35%, ROE -6.59%, ROIC -3.88% below WACC of 12.57%
- High price-to-book ratio of 7.27 suggests overvaluation
- Negative interest coverage and weak asset turnover at 0.29
STMicroelectronics Weaknesses
- Low profitability with net margin 1.41%, ROE 0.93%, and ROIC 0.67% below WACC of 9.54%
- Current ratio very high at 3.36 indicating potential inefficiency
- Zero dividend yield
Both companies exhibit diversified revenue bases and strong balance sheet management. Marvell faces significant profitability challenges and valuation concerns, while STMicroelectronics shows neutral overall financial health but struggles with modest profitability and operational efficiency. These factors will influence their strategic focus on cost control and capital allocation.
The Moat Duel: Analyzing Competitive Defensibility
A structural moat is the only reliable shield protecting long-term profits from relentless competition erosion. Let’s dissect how Marvell and STMicroelectronics defend their turf:
Marvell Technology, Inc.: Cost Advantage in High-Performance Chips
Marvell’s moat centers on cost-efficient, integrated circuit solutions driving a 41% gross margin. Yet, its declining ROIC signals weakening value creation. Expansion into emerging markets in 2026 could either deepen or pressure its cost edge.
STMicroelectronics N.V.: Broad Diversification Across Analog and MEMS
STMicroelectronics leverages product diversity and geographic reach to stabilize margins. Its lower gross margin and declining ROIC reflect struggles against intensified competition, though new sensor and microcontroller innovations offer a potential growth lever.
Verdict: Cost Efficiency vs. Product Breadth in Semiconductor Moats
Both firms suffer declining ROICs, signaling shrinking economic moats. Marvell’s sharper margin focus offers a narrower but clearer moat. STMicro’s diversified portfolio is broader but less profitable. Marvell appears better equipped to defend its market share amid ongoing sector pressures.
Which stock offers better returns?
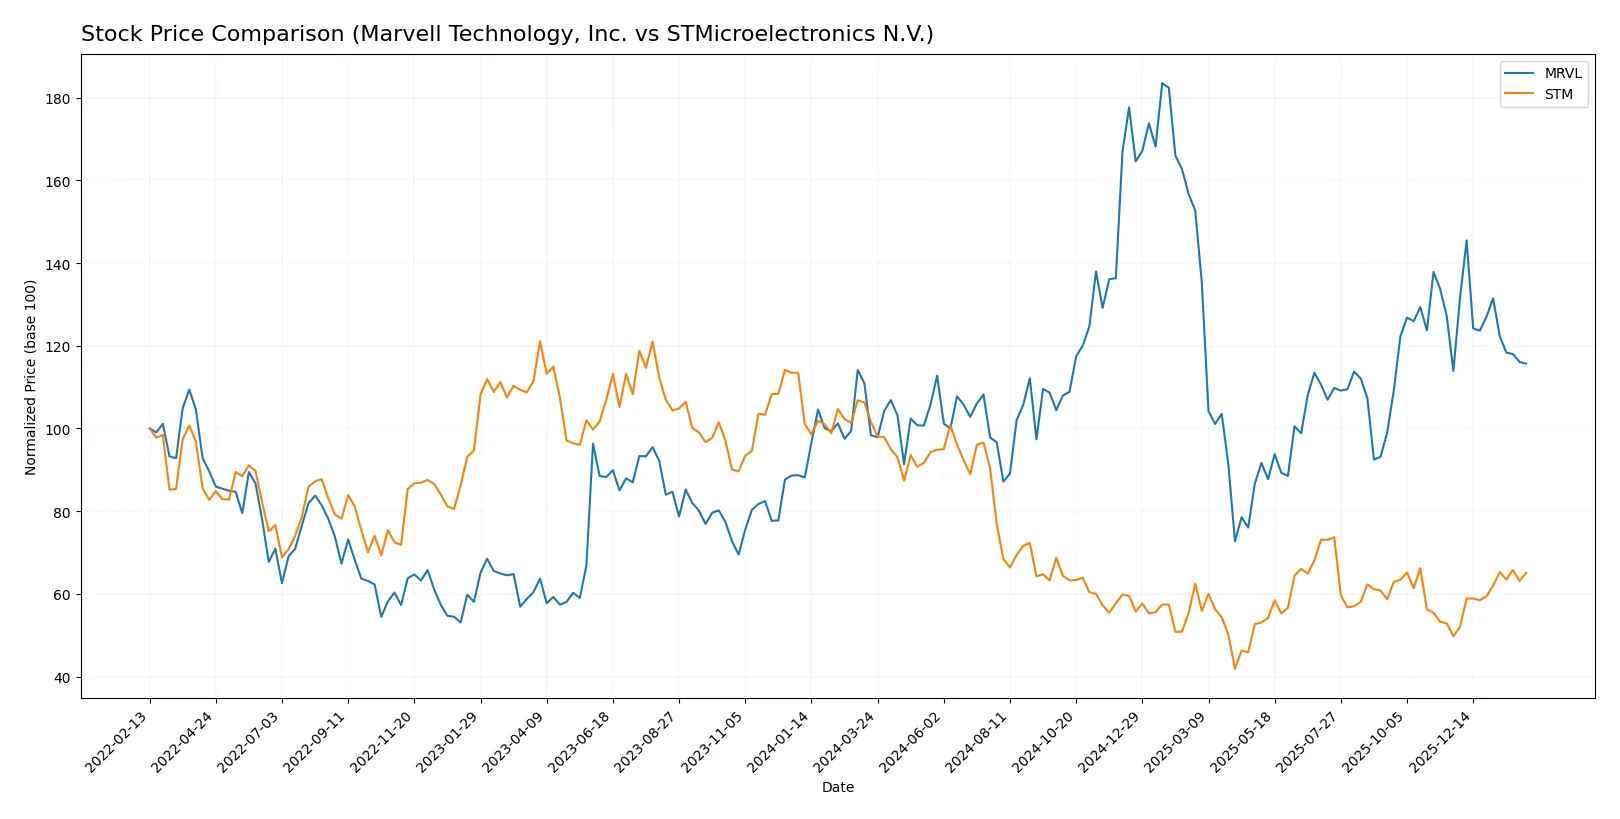
The past year reveals contrasting trajectories: Marvell Technology gained 17.63%, showing a bullish trend with decelerating momentum, while STMicroelectronics declined 35.85%, accelerating its bearish slide.
Trend Comparison
Marvell Technology’s stock rose 17.63% over the past 12 months, marking a bullish trend with deceleration. It ranged between 49.43 and 124.76, showing high volatility (16.41 SD).
STMicroelectronics fell 35.85% over the same period, a clear bearish trend with accelerating downward momentum. Its price fluctuated from 18.49 to 44.85, with lower volatility (6.54 SD).
Marvell Technology outperformed STMicroelectronics by a wide margin, delivering the strongest market return despite some slowing momentum in recent months.
Target Prices
Analysts set a clear target price range signaling growth potential for both Marvell Technology and STMicroelectronics.
| Company | Target Low | Target High | Consensus |
|---|---|---|---|
| Marvell Technology, Inc. | 80 | 156 | 117 |
| STMicroelectronics N.V. | 28 | 45 | 37.67 |
Marvell’s consensus target price of 117 implies a 49% upside from the current 78.66. STMicroelectronics shows a modest upside near 31% from 28.77, reflecting cautious optimism.

Don’t Let Luck Decide Your Entry Point
Optimize your entry points with our advanced ProRealTime indicators. You’ll get efficient buy signals with precise price targets for maximum performance. Start outperforming now!
How do institutions grade them?
The following tables summarize recent institutional grades for Marvell Technology, Inc. and STMicroelectronics N.V.:
Marvell Technology, Inc. Grades
Below is a selection of recent grades from reputable grading firms for Marvell Technology, Inc.:
| Grading Company | Action | New Grade | Date |
|---|---|---|---|
| Rosenblatt | Maintain | Buy | 2026-01-07 |
| Melius Research | Upgrade | Buy | 2026-01-05 |
| Benchmark | Downgrade | Hold | 2025-12-08 |
| JP Morgan | Maintain | Overweight | 2025-12-03 |
| Roth Capital | Maintain | Buy | 2025-12-03 |
| Oppenheimer | Maintain | Outperform | 2025-12-03 |
STMicroelectronics N.V. Grades
Below is a selection of recent grades from reputable grading firms for STMicroelectronics N.V.:
| Grading Company | Action | New Grade | Date |
|---|---|---|---|
| TD Cowen | Maintain | Buy | 2025-10-24 |
| Susquehanna | Maintain | Positive | 2025-10-22 |
| Baird | Upgrade | Outperform | 2025-07-22 |
| Jefferies | Upgrade | Buy | 2025-02-19 |
| Bernstein | Downgrade | Market Perform | 2025-02-05 |
| Barclays | Downgrade | Underweight | 2025-01-22 |
Which company has the best grades?
Marvell Technology, Inc. shows a stronger consensus with multiple “Buy” and “Outperform” ratings maintained or upgraded recently. STMicroelectronics displays more mixed grades including downgrades to “Market Perform” and “Underweight.” Investors may interpret Marvell’s steadier positive outlook as a signal of greater institutional confidence.
Risks specific to each company
The following categories identify critical pressure points and systemic threats confronting Marvell Technology, Inc. and STMicroelectronics N.V. in the 2026 market environment:
1. Market & Competition
Marvell Technology, Inc.
- Faces intense competition in Ethernet and storage solutions with margin pressures.
STMicroelectronics N.V.
- Competes broadly across automotive, industrial, and consumer segments amid shifting demand cycles.
2. Capital Structure & Debt
Marvell Technology, Inc.
- Moderate leverage (D/E 0.32) with negative interest coverage signals financial stress.
STMicroelectronics N.V.
- Lower leverage (D/E 0.12) and strong interest coverage denote a robust balance sheet.
3. Stock Volatility
Marvell Technology, Inc.
- High beta of 1.98 reflects elevated stock price swings and investor sensitivity.
STMicroelectronics N.V.
- Lower beta of 1.32 indicates relatively less stock price volatility and market risk.
4. Regulatory & Legal
Marvell Technology, Inc.
- US-based with exposure to export controls and tech regulations in China and Taiwan.
STMicroelectronics N.V.
- EU-headquartered, faces stringent European regulatory standards and global trade policies.
5. Supply Chain & Operations
Marvell Technology, Inc.
- Operations span multiple Asian countries, exposing it to regional geopolitical tensions.
STMicroelectronics N.V.
- Broad global manufacturing footprint reduces single-region risk but adds complexity.
6. ESG & Climate Transition
Marvell Technology, Inc.
- Limited public ESG disclosures could trigger investor scrutiny amid rising standards.
STMicroelectronics N.V.
- Stronger ESG focus expected in Europe, but transition costs may impact margins.
7. Geopolitical Exposure
Marvell Technology, Inc.
- Significant exposure to US-China tensions affecting supply and sales channels.
STMicroelectronics N.V.
- Faces risks from EU-US trade relations and supply chain disruptions in Asia.
Which company shows a better risk-adjusted profile?
Marvell’s most impactful risk is its weak profitability coupled with negative interest coverage, threatening financial stability. STMicroelectronics’ primary risk lies in regulatory complexity and valuation concerns. Despite Marvell’s financial stress, its Altman Z-score indicates a safer bankruptcy zone. However, STM’s stronger Piotroski score and balance sheet provide a more balanced risk-adjusted profile. Recent data highlight Marvell’s negative ROIC versus STM’s modest profitability, underscoring caution. Overall, STM offers a better risk-adjusted investment profile amid current market dynamics.
Final Verdict: Which stock to choose?
Marvell Technology’s superpower lies in its research-driven innovation, fueling rapid revenue growth and positioning it as a technology frontrunner. However, its declining profitability and value destruction signal a point of vigilance. It fits portfolios aiming for aggressive growth with tolerance for volatility and operational risks.
STMicroelectronics boasts a strategic moat through diversified manufacturing capabilities and robust asset quality, offering better balance sheet strength and cash flow stability. Relative to Marvell, it presents a safer profile for investors seeking moderate growth with income preservation, fitting a GARP (Growth at a Reasonable Price) strategy.
If you prioritize dynamic innovation and high growth potential, Marvell outshines due to its cutting-edge R&D investment despite current profitability challenges. However, if you seek better financial stability and risk management, STMicroelectronics offers superior balance sheet resilience and steadier operational metrics. Both require cautious monitoring given their value destruction and declining returns on invested capital.
Disclaimer: Investment carries a risk of loss of initial capital. The past performance is not a reliable indicator of future results. Be sure to understand risks before making an investment decision.
Go Further
I encourage you to read the complete analyses of Marvell Technology, Inc. and STMicroelectronics N.V. to enhance your investment decisions: