Marvell Technology, Inc. and Skyworks Solutions, Inc. are two key players in the highly competitive semiconductor industry. Both companies innovate in cutting-edge chip technologies that power a broad range of devices, from data centers to smartphones. Their overlapping markets and strategic focus on connectivity solutions make them natural rivals. In this article, I will analyze their strengths and risks to help you decide which company stands out as the better investment opportunity in 2026.
Table of contents
Companies Overview
I will begin the comparison between Marvell Technology, Inc. and Skyworks Solutions, Inc. by providing an overview of these two companies and their main differences.
Marvell Technology, Inc. Overview
Marvell Technology, Inc. designs, develops, and sells a broad range of integrated circuits, including analog, mixed-signal, and digital signal processing products. The company’s portfolio features Ethernet solutions, storage controllers, processors, and ASICs, serving diverse applications from networking to storage. Headquartered in Wilmington, Delaware, Marvell operates globally and is positioned as a significant player in the semiconductor industry.
Skyworks Solutions, Inc. Overview
Skyworks Solutions, Inc. focuses on designing, manufacturing, and marketing proprietary semiconductor products, including amplifiers, tuners, filters, and front-end modules. Its products cater to markets such as aerospace, automotive, broadband, and mobile devices. Based in Irvine, California, Skyworks maintains a global footprint and emphasizes innovation in wireless analog system-on-chip solutions.
Key similarities and differences
Both companies operate within the semiconductor sector and serve a global market with advanced chip technologies. Marvell concentrates more on Ethernet, storage, and processing solutions, while Skyworks specializes in wireless communication components and analog semiconductor products. Marvell has a smaller workforce of approximately 7K employees compared to Skyworks’ 10K, reflecting differences in scale and product focus.
Income Statement Comparison
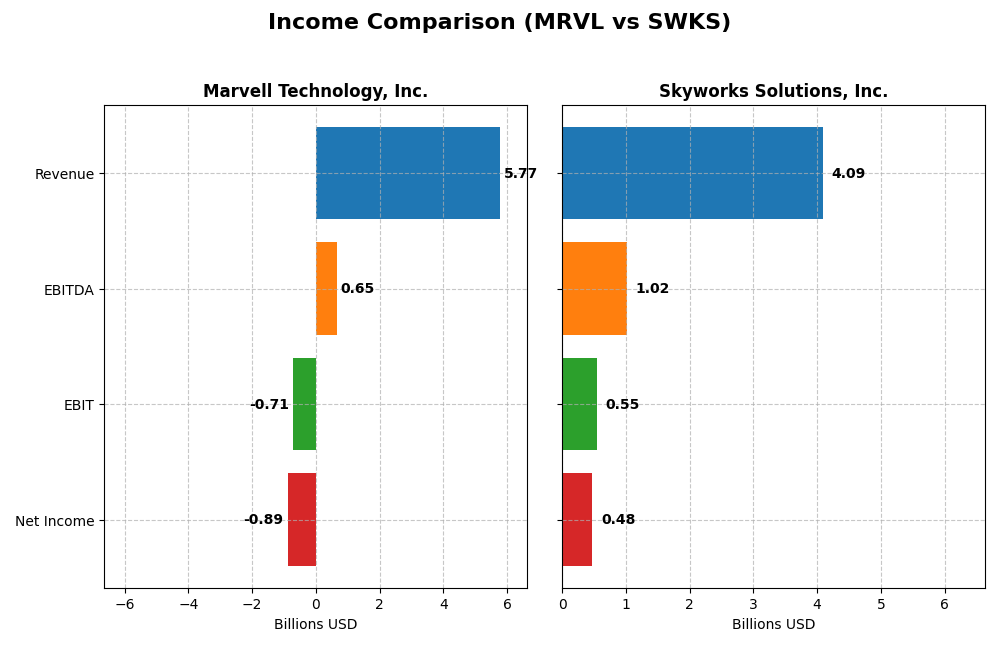
Below is a side-by-side comparison of key income statement metrics for Marvell Technology, Inc. and Skyworks Solutions, Inc. for their most recent fiscal year.
| Metric | Marvell Technology, Inc. (MRVL) | Skyworks Solutions, Inc. (SWKS) |
|---|---|---|
| Market Cap | 69.3B | 8.76B |
| Revenue | 5.77B | 4.09B |
| EBITDA | 652M | 1.02B |
| EBIT | -705M | 554M |
| Net Income | -885M | 477M |
| EPS | -1.02 | 3.09 |
| Fiscal Year | 2025 | 2025 |
Income Statement Interpretations
Marvell Technology, Inc.
Marvell experienced a 94.26% revenue increase over 2021-2025 but faced a net income decline of 219.15%, reflecting margin pressures. Its gross margin remained favorable at 41.31%, while ebit and net margins were negative. In 2025, revenue grew modestly by 4.71%, but operating expenses rose similarly, causing a 28.94% drop in EBIT and negative operating income.
Skyworks Solutions, Inc.
Skyworks reported declining revenue, down 20.01% over the five years, accompanied by a 68.16% net income decrease. Despite a stable gross margin of 41.16%, EBIT and net margins remain positive but contracted in 2025. The most recent year saw revenue shrink by 2.18%, with EBIT and net margin also declining, signaling margin compression and reduced profitability.
Which one has the stronger fundamentals?
Both companies show unfavorable overall income evaluations, but Marvell’s robust revenue growth contrasts with Skyworks’ sustained revenue decline. Marvell’s margins are pressured with negative operating income, whereas Skyworks maintains positive EBIT and net margins despite shrinking sales. The choice depends on weighing Marvell’s growth against Skyworks’ profitability and margin stability.
Financial Ratios Comparison
The table below presents the latest key financial ratios for Marvell Technology, Inc. and Skyworks Solutions, Inc., facilitating a direct comparison of their fiscal year 2025 performances.
| Ratios | Marvell Technology, Inc. (MRVL) | Skyworks Solutions, Inc. (SWKS) |
|---|---|---|
| ROE | -6.59% | 8.29% |
| ROIC | -3.88% | 6.35% |
| P/E | -110.37 | 24.95 |
| P/B | 7.27 | 2.07 |
| Current Ratio | 1.54 | 2.33 |
| Quick Ratio | 1.03 | 1.76 |
| D/E (Debt-to-Equity) | 0.32 | 0.21 |
| Debt-to-Assets | 21.50% | 15.20% |
| Interest Coverage | -3.80 | 18.45 |
| Asset Turnover | 0.29 | 0.52 |
| Fixed Asset Turnover | 5.56 | 2.95 |
| Payout Ratio | -23.45% | 90.67% |
| Dividend Yield | 0.21% | 3.63% |
Interpretation of the Ratios
Marvell Technology, Inc.
Marvell’s ratios reveal several weaknesses, including negative net margin (-15.35%) and return on equity (-6.59%), signaling profitability challenges. The company’s high price-to-book ratio (7.27) and negative interest coverage (-3.72) are concerning. Liquidity ratios are solid, with a current ratio of 1.54. Marvell pays a modest dividend, with a low yield of 0.21%, indicating limited shareholder returns and potential sustainability risks.
Skyworks Solutions, Inc.
Skyworks shows a mostly favorable profile with a positive net margin (11.67%) and strong liquidity evidenced by a current ratio of 2.33 and quick ratio of 1.76. Its debt levels are manageable, and interest coverage is robust at 20.44. Dividend yield stands at 3.63%, supported by adequate cash flow, providing a more attractive return to shareholders. Some ratios like ROE (8.29%) and ROIC (6.35%) are less strong but not unfavorable.
Which one has the best ratios?
Skyworks Solutions displays a more balanced and favorable ratio set compared to Marvell, with higher profitability, better liquidity, and stronger shareholder returns. Marvell’s ratios are predominantly unfavorable, reflecting operational and financial challenges. Therefore, Skyworks has the stronger overall ratio profile in this comparison.
Strategic Positioning
This section compares the strategic positioning of Marvell Technology and Skyworks Solutions, including Market position, Key segments, and exposure to technological disruption:
Marvell Technology, Inc.
- Large market cap of 69.3B facing high beta risk and intense semiconductor competition.
- Diverse segments: Data center (4.16B), enterprise networking, carrier infrastructure, consumer, automotive and industrial.
- Exposure to analog, digital signal processing, storage, networking, and ASIC technologies.
Skyworks Solutions, Inc.
- Smaller market cap of 8.76B with moderate beta, active in semiconductor markets globally.
- Broad portfolio across amplifiers, tuners, filters, and modules serving automotive, broadband, cellular, industrial, and more.
- Exposure to proprietary semiconductor products and intellectual property in various analog and mixed-signal technologies.
Marvell Technology, Inc. vs Skyworks Solutions, Inc. Positioning
Marvell has a diversified segment focus with strong emphasis on data center and networking, while Skyworks offers a concentrated product portfolio targeting multiple end markets. Marvell’s scale supports broad industry reach; Skyworks benefits from specialized semiconductor IP and product variety.
Which has the best competitive advantage?
Both companies show very unfavorable MOAT evaluations with declining ROIC trends and value destruction, indicating neither currently maintains a sustainable competitive advantage based on capital efficiency.
Stock Comparison
The stock price chart highlights significant divergence in trading dynamics over the past year, with Marvell Technology, Inc. showing a strong upward momentum despite recent pullbacks, while Skyworks Solutions, Inc. has experienced a pronounced decline.

Trend Analysis
Marvell Technology, Inc. exhibited a bullish trend with an 18.94% price increase over the past 12 months, though the trend shows deceleration. Its price ranged between 49.43 and 124.76, with recent weeks showing a -14.25% pullback.
Skyworks Solutions, Inc. faced a bearish trend marked by a -43.71% decline over the last year, also decelerating. The price fluctuated from 52.78 to 116.18, with recent losses deepening by -24.78%.
Comparing both, Marvell Technology, Inc. delivered a notably stronger market performance than Skyworks Solutions, Inc. over the analyzed period.
Target Prices
Analyst consensus presents a mixed but generally optimistic view on these semiconductor companies.
| Company | Target High | Target Low | Consensus |
|---|---|---|---|
| Marvell Technology, Inc. | 156 | 80 | 117 |
| Skyworks Solutions, Inc. | 140 | 60 | 85.11 |
For Marvell Technology, the consensus target of 117 is significantly above its current price of 80.38, indicating potential upside. Skyworks Solutions shows a consensus target around 85.11, well above its current price near 58.46, suggesting expected growth potential.
Analyst Opinions Comparison
This section compares analysts’ ratings and grades for Marvell Technology, Inc. (MRVL) and Skyworks Solutions, Inc. (SWKS):
Rating Comparison
MRVL Rating
- Rating: B+, classified as Very Favorable
- Discounted Cash Flow Score: 3, Moderate valuation
- ROE Score: 4, indicating favorable profitability
- ROA Score: 5, very favorable asset utilization
- Debt To Equity Score: 2, moderate financial risk
- Overall Score: 3, moderate overall rating
SWKS Rating
- Rating: B+, classified as Very Favorable
- Discounted Cash Flow Score: 4, Favorable valuation
- ROE Score: 3, indicating moderate profitability
- ROA Score: 4, favorable asset utilization
- Debt To Equity Score: 3, moderate financial risk
- Overall Score: 3, moderate overall rating
Which one is the best rated?
Both MRVL and SWKS share the same overall rating of B+ and an identical moderate overall score of 3. MRVL scores higher in ROE and ROA, while SWKS shows a stronger discounted cash flow score and slightly better debt to equity score, indicating nuanced strengths for each company.
Scores Comparison
The scores comparison for Marvell Technology, Inc. and Skyworks Solutions, Inc. is as follows:
MRVL Scores
- Altman Z-Score: 6.76, indicating a safe zone and very low bankruptcy risk.
- Piotroski Score: 7, reflecting strong financial health and investment potential.
SWKS Scores
- Altman Z-Score: 4.44, indicating a safe zone and low bankruptcy risk.
- Piotroski Score: 7, reflecting strong financial health and investment potential.
Which company has the best scores?
Both MRVL and SWKS exhibit strong financial health with Piotroski scores of 7 and safe zone Altman Z-scores. MRVL’s higher Altman Z-score suggests a slightly stronger buffer against bankruptcy risk compared to SWKS.
Grades Comparison
Here is a comparison of recent grades assigned to Marvell Technology, Inc. and Skyworks Solutions, Inc.:
Marvell Technology, Inc. Grades
The following table summarizes recent grades for Marvell Technology from reputable grading companies.
| Grading Company | Action | New Grade | Date |
|---|---|---|---|
| Rosenblatt | Maintain | Buy | 2026-01-07 |
| Melius Research | Upgrade | Buy | 2026-01-05 |
| Benchmark | Downgrade | Hold | 2025-12-08 |
| B. Riley Securities | Maintain | Buy | 2025-12-03 |
| JP Morgan | Maintain | Overweight | 2025-12-03 |
| Susquehanna | Maintain | Positive | 2025-12-03 |
| Benchmark | Maintain | Buy | 2025-12-03 |
| Oppenheimer | Maintain | Outperform | 2025-12-03 |
| Stifel | Maintain | Buy | 2025-12-03 |
| Rosenblatt | Maintain | Buy | 2025-12-03 |
Marvell’s grades generally show a strong buy sentiment with only one recent downgrade to Hold, indicating overall confidence among analysts.
Skyworks Solutions, Inc. Grades
The following table summarizes recent grades for Skyworks Solutions from reputable grading companies.
| Grading Company | Action | New Grade | Date |
|---|---|---|---|
| Mizuho | Upgrade | Neutral | 2025-11-11 |
| JP Morgan | Maintain | Neutral | 2025-11-05 |
| UBS | Maintain | Neutral | 2025-11-05 |
| Citigroup | Upgrade | Neutral | 2025-10-29 |
| Benchmark | Maintain | Hold | 2025-10-29 |
| Piper Sandler | Upgrade | Overweight | 2025-10-29 |
| Barclays | Upgrade | Equal Weight | 2025-10-29 |
| Keybanc | Upgrade | Overweight | 2025-10-29 |
| UBS | Maintain | Neutral | 2025-10-29 |
| Citigroup | Maintain | Sell | 2025-08-06 |
Skyworks’ grades reflect a more mixed consensus with several upgrades from Sell or Underperform to Neutral or Overweight, showing cautious optimism.
Which company has the best grades?
Marvell Technology has received generally stronger grades with a majority Buy and Overweight ratings, whereas Skyworks Solutions exhibits more Neutral and Hold ratings with fewer Buy equivalents. This suggests Marvell is viewed more favorably by analysts, potentially indicating a stronger growth outlook or lower perceived risk for investors.
Strengths and Weaknesses
Below is a comparison of Marvell Technology, Inc. (MRVL) and Skyworks Solutions, Inc. (SWKS) based on key business criteria reflecting recent financial and market performance.
| Criterion | Marvell Technology, Inc. (MRVL) | Skyworks Solutions, Inc. (SWKS) |
|---|---|---|
| Diversification | Moderate, with revenue spread across Data Center (4.16B), Enterprise Networking (626M), Carrier Infrastructure (338M), Automotive & Industrial (322M), and Consumer (316M) segments. | Less diversified, focused mainly on semiconductor products without detailed segment data available. |
| Profitability | Unfavorable net margin at -15.35%, negative ROIC (-3.88%), and declining profitability trend. | Favorable net margin at 11.67%, neutral ROIC (6.35%), with stable profitability. |
| Innovation | Challenged, as indicated by declining ROIC and value destruction over 2021-2025. | Relatively stronger, maintaining value with only a slight decline in ROIC. |
| Global presence | Strong in data centers and networking markets globally but facing operational challenges. | Established global footprint with solid financial health and operational efficiency. |
| Market Share | Significant in Data Center and Networking markets but losing value. | Stable market share with favorable financial ratios and risk profile. |
Key Takeaways: Marvell shows strong diversification in high-growth tech segments but struggles with profitability and value creation. Skyworks, while less diversified, maintains healthier profitability and financial stability, making it a more cautious choice for investors seeking consistent returns.
Risk Analysis
Below is a comparative overview of key risks for Marvell Technology, Inc. and Skyworks Solutions, Inc. based on the most recent data from 2025.
| Metric | Marvell Technology, Inc. (MRVL) | Skyworks Solutions, Inc. (SWKS) |
|---|---|---|
| Market Risk | High beta (1.945) indicates higher sensitivity to market volatility | Moderate beta (1.297) suggests lower market volatility risk |
| Debt Level | Moderate debt-to-equity (0.32), favorable leverage | Lower debt-to-equity (0.21), favorable financial risk profile |
| Regulatory Risk | Exposure to multiple countries including China may increase compliance complexity | Global presence but somewhat less diversified, regulatory risk moderate |
| Operational Risk | Negative net margin and ROE signal operational challenges | Positive net margin (11.67%) but moderate ROE (8.29%) |
| Environmental Risk | Semiconductor manufacturing entails environmental compliance costs; no specific recent issues reported | Similar industry risks; stable operational environment reported |
| Geopolitical Risk | Significant operations in Asia including China and Taiwan increase geopolitical exposure | Also exposed to Asia-Pacific but with less geographic spread |
The most impactful risks are Marvell’s operational losses and high market volatility sensitivity, which could affect profitability and stock stability. Skyworks shows stronger operational performance and lower debt risk, but geopolitical tensions in Asia remain a concern for both companies. Careful monitoring of international trade policies and operational efficiencies is advisable.
Which Stock to Choose?
Marvell Technology, Inc. (MRVL) shows a mixed income evolution with a 4.7% revenue growth over one year but an unfavorable overall income statement and financial ratios. Profitability is negative with a -15.35% net margin, and debt levels are moderate. The company holds a very favorable B+ rating despite value destruction indicated by declining ROIC.
Skyworks Solutions, Inc. (SWKS) displays an unfavorable income statement trend with negative revenue growth and declining profitability, yet it maintains favorable financial ratios overall. Net margin is positive at 11.67%, debt is low, and it shares the same B+ rating as Marvell. However, ROIC is also declining, signaling value erosion.
Investors seeking growth might find Marvell’s moderate revenue expansion and strong rating appealing despite profitability challenges, while those prioritizing financial stability and positive net margins could lean toward Skyworks. Both companies show signs of value destruction from declining ROIC, suggesting cautious interpretation based on individual risk tolerance.
Disclaimer: Investment carries a risk of loss of initial capital. The past performance is not a reliable indicator of future results. Be sure to understand risks before making an investment decision.
Go Further
I encourage you to read the complete analyses of Marvell Technology, Inc. and Skyworks Solutions, Inc. to enhance your investment decisions: