In the fast-evolving semiconductor industry, Marvell Technology, Inc. and Silicon Laboratories Inc. stand out as key players driving innovation. Both companies focus on mixed-signal and analog solutions but target slightly different market segments, from data infrastructure to IoT devices. Their overlapping technologies and strategic approaches provide a compelling basis for comparison. Join me as we explore which company offers the most promising investment opportunity in 2026.
Table of contents
Companies Overview
I will begin the comparison between Marvell Technology, Inc. and Silicon Laboratories Inc. by providing an overview of these two companies and their main differences.
Marvell Technology, Inc. Overview
Marvell Technology, Inc. designs, develops, and sells analog, mixed-signal, digital signal processing, and embedded integrated circuits. Its portfolio includes Ethernet solutions, storage controllers, ASICs, and application processors. Operating globally, Marvell serves various sectors with a broad semiconductor product range, positioning itself as a significant player in the technology industry with a market cap of approximately 69.3B USD.
Silicon Laboratories Inc. Overview
Silicon Laboratories Inc. is a fabless semiconductor company specializing in analog-intensive mixed-signal solutions, focusing on wireless microcontrollers and sensors. Its products cater to IoT applications such as smart home, industrial automation, and medical instrumentation. Headquartered in Austin, Texas, Silicon Labs operates internationally with a market cap near 5B USD, emphasizing niche IoT markets and connectivity solutions.
Key similarities and differences
Both companies operate in the semiconductor industry and trade on NASDAQ, yet they differ in scale and market focus. Marvell offers a broader semiconductor product lineup targeting networking and storage markets, while Silicon Labs concentrates on analog and mixed-signal solutions for IoT applications. Marvell’s larger workforce and market cap contrast with Silicon Labs’ specialized product range and smaller scale, reflecting distinct strategic approaches within technology.
Income Statement Comparison
The following table compares key income statement metrics for Marvell Technology, Inc. and Silicon Laboratories Inc. for their most recent fiscal years, providing a clear overview of their financial performance.
| Metric | Marvell Technology, Inc. (MRVL) | Silicon Laboratories Inc. (SLAB) |
|---|---|---|
| Market Cap | 69.3B | 5.0B |
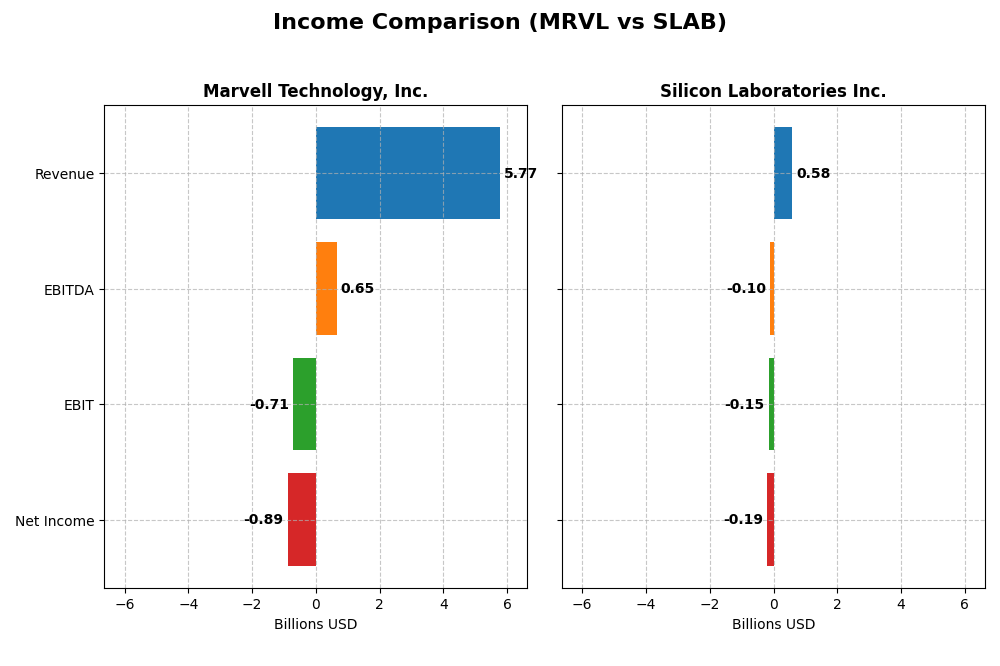
| Revenue | 5.77B (2025) | 584M (2024) |
| EBITDA | 652M (2025) | -105M (2024) |
| EBIT | -705M (2025) | -154M (2024) |
| Net Income | -885M (2025) | -191M (2024) |
| EPS | -1.02 (2025) | -5.93 (2024) |
| Fiscal Year | 2025 | 2024 |
Income Statement Interpretations
Marvell Technology, Inc.
Marvell Technology’s revenue nearly doubled from 2021 to 2025, rising from $3B to $5.77B, reflecting strong growth. However, net income remained negative throughout, worsening from -$277M in 2021 to -$885M in 2025. Gross margins stayed favorable around 41%, but EBIT and net margins were persistently negative, with the latest year showing a slight margin improvement despite operating losses.
Silicon Laboratories Inc.
Silicon Laboratories’ revenue increased moderately by 14% over five years, peaking at $584M in 2024, but net income declined sharply, with a -$191M loss in 2024 versus a $21M profit in 2021. Gross margin was solid at 53%, yet EBIT and net margins were negative. The latest year saw a significant revenue and profit drop, highlighting deteriorating profitability and margin compression.
Which one has the stronger fundamentals?
Both companies show unfavorable overall income statement evaluations due to sustained net losses and negative margins. Marvell demonstrates stronger revenue growth and more stable gross margins, while Silicon Laboratories suffers from steeper recent declines in revenue and profitability. Each faces challenges in profitability, with Marvell’s scale contrasting Silicon Laboratories’ sharper earnings volatility.
Financial Ratios Comparison
The table below presents a side-by-side comparison of key financial ratios for Marvell Technology, Inc. (MRVL) and Silicon Laboratories Inc. (SLAB) based on their most recent fiscal year data.
| Ratios | Marvell Technology, Inc. (2025) | Silicon Laboratories Inc. (2024) |
|---|---|---|
| ROE | -6.6% | -17.7% |
| ROIC | -3.9% | -14.7% |
| P/E | -110.4 | -21.5 |
| P/B | 7.27 | 3.81 |
| Current Ratio | 1.54 | 6.15 |
| Quick Ratio | 1.03 | 5.07 |
| D/E (Debt-to-Equity) | 0.32 | 0.01 |
| Debt-to-Assets | 21.5% | 1.3% |
| Interest Coverage | -3.80 | -126.33 |
| Asset Turnover | 0.29 | 0.48 |
| Fixed Asset Turnover | 5.56 | 4.42 |
| Payout ratio | -23.4% | 0% |
| Dividend yield | 0.21% | 0% |
Interpretation of the Ratios
Marvell Technology, Inc.
Marvell shows mixed financial ratios with a majority unfavorable: negative net margin (-15.35%), ROE (-6.59%), and ROIC (-3.88%) indicate profitability challenges. However, liquidity and leverage ratios like current ratio (1.54) and debt to equity (0.32) are favorable. The company pays dividends with a modest yield of 0.21%, but payout sustainability may be a concern given weak earnings and coverage.
Silicon Laboratories Inc.
Silicon Laboratories presents mostly unfavorable ratios, including a larger negative net margin (-32.69%) and ROE (-17.69%), signaling profitability pressures. Its quick ratio (5.07) and low debt-to-assets (1.27%) are favorable, suggesting good liquidity and low leverage. The company does not pay dividends, likely prioritizing reinvestment and R&D as part of its growth strategy.
Which one has the best ratios?
Both companies face significant profitability challenges with negative margins and returns. Marvell has a more balanced liquidity and leverage profile, while Silicon Laboratories exhibits very strong liquidity but weaker profitability. Overall, Marvell’s slightly higher proportion of favorable ratios contrasts with Silicon Laboratories’ more pronounced unfavorable profitability metrics, making the comparison nuanced.
Strategic Positioning
This section compares the strategic positioning of Marvell Technology, Inc. and Silicon Laboratories Inc., including Market position, Key segments, and disruption:
Marvell Technology, Inc.
- Large market cap (~69B USD) with high beta, facing competitive pressure in semiconductors.
- Diversified key segments: Data Center (~4.16B), Enterprise Networking, Carrier Infrastructure, Automotive & Industrial, Consumer.
- Exposure to technology disruption in Ethernet, storage controllers, and ASIC solutions.
Silicon Laboratories Inc.
- Smaller market cap (~5B USD) with moderate beta, competing in niche analog mixed-signal semiconductors.
- Focused key segment: Industrial & Commercial (~340M), with IoT and wireless microcontrollers as main business drivers.
- Exposure to disruption primarily through analog-intensive mixed-signal and IoT applications.
Marvell Technology, Inc. vs Silicon Laboratories Inc. Positioning
Marvell pursues a diversified strategy across multiple semiconductor segments with a strong data center focus, providing scale advantages. Silicon Labs concentrates on analog and IoT-related markets, offering specialization but limited diversification.
Which has the best competitive advantage?
Both companies show very unfavorable MOAT evaluations with declining ROIC trends and value destruction, indicating neither currently maintains a sustainable competitive advantage based on capital efficiency.
Stock Comparison
The stock price movements over the past 12 months reveal bullish trends for both Marvell Technology, Inc. and Silicon Laboratories Inc., with Marvell showing deceleration and Silicon Laboratories accelerating in price gains.

Trend Analysis
Marvell Technology, Inc. experienced an 18.94% price increase over the past year, indicating a bullish trend with deceleration; its price ranged from 49.43 to 124.76 and showed recent weakness with a -14.25% decline.
Silicon Laboratories Inc. posted a 14.91% price gain over the same period, also bullish with accelerating momentum; its stock price moved between 89.82 and 155.33 and gained 16.59% recently, reflecting strengthening momentum.
Comparing both, Marvell Technology delivered the higher overall market performance with an 18.94% rise versus Silicon Laboratories’ 14.91%, despite Marvell’s recent downward trend contrasting with Silicon Laboratories’ recent acceleration.
Target Prices
Analysts present a clear consensus on target prices for Marvell Technology, Inc. and Silicon Laboratories Inc.
| Company | Target High | Target Low | Consensus |
|---|---|---|---|
| Marvell Technology, Inc. | 156 | 80 | 117 |
| Silicon Laboratories Inc. | 165 | 130 | 151.67 |
For Marvell Technology, the consensus target price of 117 USD is significantly above the current price of 80.38 USD, indicating potential upside. Silicon Laboratories’ consensus of 151.67 USD closely aligns with its current price of 152.82 USD, suggesting a more balanced market expectation.
Analyst Opinions Comparison
This section compares analysts’ ratings and grades for Marvell Technology, Inc. and Silicon Laboratories Inc.:
Rating Comparison
MRVL Rating
- Rating: B+ indicating a very favorable overall evaluation.
- Discounted Cash Flow Score: Moderate score of 3 reflects average valuation.
- ROE Score: Favorable score of 4 shows efficient profit generation from equity.
- ROA Score: Very favorable score of 5 highlights excellent asset utilization.
- Debt To Equity Score: Moderate score of 2 suggests moderate financial risk.
SLAB Rating
- Rating: C- showing a very unfavorable overall evaluation.
- Discounted Cash Flow Score: Moderate score of 2 indicates below average value.
- ROE Score: Very unfavorable score of 1 reflects poor equity profit efficiency.
- ROA Score: Very unfavorable score of 1 indicates weak asset efficiency.
- Debt To Equity Score: Very unfavorable score of 1 signals high financial risk.
Which one is the best rated?
Marvell Technology is clearly better rated than Silicon Laboratories based on all provided metrics. MRVL shows very favorable and favorable scores, whereas SLAB displays very unfavorable scores across key financial indicators.
Scores Comparison
Here is a comparison of the Altman Z-Score and Piotroski Score for Marvell Technology and Silicon Laboratories:
Marvell Technology Scores
- Altman Z-Score: 6.76, indicating a safe zone with low bankruptcy risk.
- Piotroski Score: 7, classified as strong financial health.
Silicon Laboratories Scores
- Altman Z-Score: 18.02, indicating a safe zone with very low bankruptcy risk.
- Piotroski Score: 4, classified as average financial health.
Which company has the best scores?
Silicon Laboratories has a higher Altman Z-Score, indicating stronger bankruptcy safety. Marvell Technology shows a stronger Piotroski Score, reflecting better overall financial health. Each score favors a different company based on these metrics.
Grades Comparison
Below is the comparison of recent grades issued by reputable grading companies for Marvell Technology, Inc. and Silicon Laboratories Inc.:
Marvell Technology, Inc. Grades
The following table lists recent grades assigned by recognized grading companies to Marvell Technology, Inc.:
| Grading Company | Action | New Grade | Date |
|---|---|---|---|
| Rosenblatt | Maintain | Buy | 2026-01-07 |
| Melius Research | Upgrade | Buy | 2026-01-05 |
| Benchmark | Downgrade | Hold | 2025-12-08 |
| B. Riley Securities | Maintain | Buy | 2025-12-03 |
| JP Morgan | Maintain | Overweight | 2025-12-03 |
| Susquehanna | Maintain | Positive | 2025-12-03 |
| Benchmark | Maintain | Buy | 2025-12-03 |
| Oppenheimer | Maintain | Outperform | 2025-12-03 |
| Stifel | Maintain | Buy | 2025-12-03 |
| Rosenblatt | Maintain | Buy | 2025-12-03 |
Marvell Technology shows a strong consensus toward buy ratings with mostly maintained or upgraded grades, despite one downgrade to hold from Benchmark.
Silicon Laboratories Inc. Grades
The following table lists recent grades assigned by recognized grading companies to Silicon Laboratories Inc.:
| Grading Company | Action | New Grade | Date |
|---|---|---|---|
| Morgan Stanley | Maintain | Equal Weight | 2025-08-06 |
| Susquehanna | Maintain | Neutral | 2025-08-06 |
| Barclays | Maintain | Equal Weight | 2025-08-05 |
| Susquehanna | Maintain | Neutral | 2025-07-22 |
| Stifel | Maintain | Buy | 2025-07-18 |
| Keybanc | Maintain | Overweight | 2025-07-08 |
| Benchmark | Maintain | Buy | 2025-05-27 |
| Benchmark | Maintain | Buy | 2025-05-14 |
| Susquehanna | Maintain | Neutral | 2025-05-14 |
| Needham | Maintain | Buy | 2025-05-14 |
Silicon Laboratories maintains a mixed rating environment with a significant number of neutral and equal weight grades but also several buy and overweight ratings.
Which company has the best grades?
Marvell Technology, Inc. receives a higher volume of buy and positive grades compared to Silicon Laboratories Inc., which shows more neutral ratings mixed with buy ratings. This difference suggests Marvell’s outlook is generally more favorable among analysts, potentially influencing investor confidence and portfolio decisions accordingly.
Strengths and Weaknesses
Below is a comparison of key strengths and weaknesses for Marvell Technology, Inc. (MRVL) and Silicon Laboratories Inc. (SLAB) based on the latest financial and operational data.
| Criterion | Marvell Technology, Inc. (MRVL) | Silicon Laboratories Inc. (SLAB) |
|---|---|---|
| Diversification | Broad product portfolio including Data Center (4.16B), Enterprise Networking (626M), Carrier Infrastructure (338M), Automotive & Industrial (322M), Consumer (316M) | Narrower focus on Industrial & Commercial segment (339M in 2024), previously diversified into IoT and Infrastructure segments |
| Profitability | Negative net margin (-15.35%), negative ROE (-6.59%), negative ROIC (-3.88%), indicating value destruction and weak profitability | More severe negative profitability: net margin (-32.69%), ROE (-17.69%), ROIC (-14.71%) with worsening trend |
| Innovation | Moderate innovation indicated by fixed asset turnover (5.56 favorable) but overall declining ROIC suggests challenges in sustaining competitive advantage | Fixed asset turnover (4.42 favorable) but steep decline in ROIC and profitability implies innovation struggles |
| Global presence | Strong presence in high-growth sectors such as Data Center and Enterprise Networking supports global footprint | More concentrated in Industrial & Commercial markets, less diversified geographically |
| Market Share | Significant in Data Center and Networking markets, but declining profitability may impact future share | Limited market share with focus on niche Industrial and IoT markets, facing financial headwinds |
Key takeaways: Both companies face serious challenges with declining profitability and value destruction, but MRVL shows more diversification and exposure to high-growth sectors, while SLAB’s narrower focus and steeper financial declines warrant cautious risk management.
Risk Analysis
Below is a comparative table outlining key risks for Marvell Technology, Inc. (MRVL) and Silicon Laboratories Inc. (SLAB) based on the most recent data available.
| Metric | Marvell Technology, Inc. (MRVL) | Silicon Laboratories Inc. (SLAB) |
|---|---|---|
| Market Risk | High beta (1.945) indicates volatility exposure | Moderate beta (1.545) suggests medium volatility |
| Debt Level | Moderate debt-to-equity (0.32), manageable leverage | Very low debt-to-equity (0.01), low financial risk |
| Regulatory Risk | Global footprint includes China and Asia; exposure to trade tensions | International presence with some exposure to regulatory changes |
| Operational Risk | Negative net margin (-15.35%), negative ROE (-6.59%) | Larger negative net margin (-32.69%), weaker profitability |
| Environmental Risk | Semiconductor industry sensitive to supply chain and resource usage | Similar industry risks, but smaller scale may limit impact |
| Geopolitical Risk | Operations in multiple Asian countries, subject to geopolitical tensions | Some exposure due to international sales, less diversified footprint |
Marvell faces significant market risk due to high beta and moderate debt, but its Altman Z-Score (6.76) places it safely away from bankruptcy risk. Silicon Labs shows weaker profitability and operational metrics with a much higher interest coverage problem, despite very low debt. Market volatility and geopolitical tensions in Asia remain the most impactful risks for both companies in 2026. Cautious monitoring of their operational performance and global trade environment is advised.
Which Stock to Choose?
Marvell Technology, Inc. (MRVL) shows a 4.71% revenue growth in 2025 with a 41.31% gross margin but suffers from negative net margin (-15.35%) and declining profitability. Its financial ratios are mostly unfavorable, though it maintains manageable debt and a B+ rating, indicating moderate overall stability.
Silicon Laboratories Inc. (SLAB) experienced a 25.29% revenue decline in 2024, with a higher gross margin of 53.42% but a more severe negative net margin (-32.69%). Its financial ratios are largely unfavorable, despite very low debt levels and a C- rating that reflects significant financial challenges and volatility.
For risk-tolerant investors focused on growth opportunities, MRVL’s moderate rating and stable revenue growth might appear more favorable. Conversely, risk-averse investors or those prioritizing capital preservation might interpret SLAB’s low debt and recent positive price momentum as factors warranting cautious observation.
Disclaimer: Investment carries a risk of loss of initial capital. The past performance is not a reliable indicator of future results. Be sure to understand risks before making an investment decision.
Go Further
I encourage you to read the complete analyses of Marvell Technology, Inc. and Silicon Laboratories Inc. to enhance your investment decisions: