In the fast-evolving semiconductor industry, Marvell Technology, Inc. and Qnity Electronics, Inc. stand out as key players driving innovation and market growth. Both headquartered in Wilmington, Delaware, they focus on cutting-edge solutions essential for modern electronics, with overlapping interests in chip design and manufacturing materials. This article will analyze their strengths and strategies to help you decide which company offers the most compelling investment opportunity in 2026.
Table of contents
Companies Overview
I will begin the comparison between Marvell Technology, Inc. and Qnity Electronics, Inc. by providing an overview of these two companies and their main differences.
Marvell Technology, Inc. Overview
Marvell Technology, Inc. designs, develops, and sells integrated circuits including analog, mixed-signal, and digital signal processing chips. It offers Ethernet solutions, storage controllers, and application processors, serving various global markets with operations in multiple countries. Incorporated in 1995 and headquartered in Wilmington, Delaware, Marvell holds a strong position in the semiconductor industry with a market cap of approximately 69.3B USD.
Qnity Electronics, Inc. Overview
Qnity Electronics, Inc. specializes in electronic solutions and materials essential for semiconductor chip manufacturing and advanced electronic materials. The company, formerly Novus SpinCo 1, Inc., was renamed in April 2025 and is also based in Wilmington, Delaware. It operates in the semiconductor sector with a market cap around 19.5B USD and went public in late 2025, positioning itself as a newer player in the technology market.
Key similarities and differences
Both Marvell and Qnity operate within the semiconductor industry and are headquartered in Wilmington, Delaware, focusing on technology solutions. However, Marvell has a diversified product portfolio including Ethernet and storage controllers, while Qnity concentrates on materials and solutions for chip manufacturing. Marvell is a well-established firm with a larger market cap and longer market presence, whereas Qnity is a recently public company with a narrower business scope.
Income Statement Comparison
This table presents a side-by-side comparison of key income statement metrics for Marvell Technology, Inc. and Qnity Electronics, Inc. for their most recent fiscal years.
| Metric | Marvell Technology, Inc. | Qnity Electronics, Inc. |
|---|---|---|
| Market Cap | 69.3B | 19.5B |
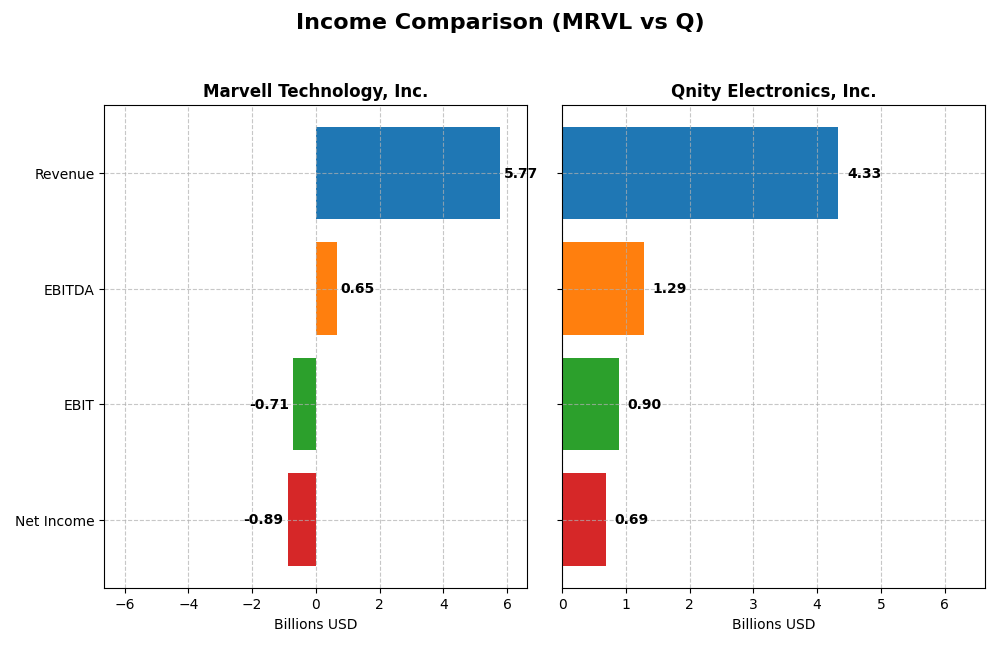
| Revenue | 5.77B | 4.34B |
| EBITDA | 652M | 1.29B |
| EBIT | -705M | 898M |
| Net Income | -885M | 693M |
| EPS | -1.02 | 3.31 |
| Fiscal Year | 2025 | 2024 |
Income Statement Interpretations
Marvell Technology, Inc.
Marvell’s revenue nearly doubled from 2021 to 2025, reaching $5.77B in 2025, yet net income remained negative, worsening overall. Gross margin held steady around 41%, but EBIT and net margins were persistently unfavorable, with 2025 showing a decline in EBIT margin to -12.23%. The latest year saw modest revenue growth of 4.7% but a 29% drop in EBIT, indicating margin pressure.
Qnity Electronics, Inc.
Qnity’s revenues declined slightly over the 2022-2024 period, with $4.34B reported in 2024. However, net income remained positive and grew in 2024, supported by a strong gross margin of 46.1% and an EBIT margin improving to 20.7%. The recent year showed favorable growth in gross profit (+13.9%) and EBIT (+36.7%), along with improved net margin and EPS, signaling strengthening profitability.
Which one has the stronger fundamentals?
Qnity Electronics exhibits stronger fundamentals with favorable margins and positive net income trends, supported by improving profitability indicators and operational efficiency. Marvell, despite revenue growth, struggles with sustained losses and negative EBIT margins. Overall, Qnity’s income statement presents a more favorable outlook, while Marvell faces challenges in translating revenue into earnings.
Financial Ratios Comparison
Below is a comparison of key financial ratios for Marvell Technology, Inc. (MRVL) and Qnity Electronics, Inc. (Q) based on their most recent fiscal year data.
| Ratios | Marvell Technology, Inc. (2025) | Qnity Electronics, Inc. (2024) |
|---|---|---|
| ROE | -6.59% | 6.51% |
| ROIC | -3.88% | 5.92% |
| P/E | -110.4 | 28.8 |
| P/B | 7.27 | 1.88 |
| Current Ratio | 1.54 | 1.77 |
| Quick Ratio | 1.03 | 1.06 |
| D/E (Debt-to-Equity) | 0.32 | 0.02 |
| Debt-to-Assets | 21.5% | 1.56% |
| Interest Coverage | -3.80 | 3.03 |
| Asset Turnover | 0.29 | 0.35 |
| Fixed Asset Turnover | 5.56 | 2.59 |
| Payout Ratio | -23.4% | 0% |
| Dividend Yield | 0.21% | 0% |
Interpretation of the Ratios
Marvell Technology, Inc.
Marvell Technology’s ratios reveal mixed strength with notable weaknesses: negative net margin (-15.35%) and return on equity (-6.59%) indicate profitability challenges, while a solid current ratio (1.54) and low debt-to-equity (0.32) show financial stability. Coverage ratios and asset turnover are concerning. The company pays a modest dividend with a low yield (0.21%), raising questions about sustainability.
Qnity Electronics, Inc.
Qnity Electronics exhibits generally favorable ratios, including a positive net margin (15.99%) and a strong current ratio (1.77), though its return on equity (6.51%) is modest. Debt levels are very low, and interest coverage is adequate. The firm does not currently pay dividends, likely reflecting its recent IPO status and focus on reinvestment for growth.
Which one has the best ratios?
Qnity Electronics holds a slightly favorable ratio profile with healthier profitability, stronger liquidity, and minimal debt, despite a few neutral indicators. Marvell Technology faces more unfavorable ratios, particularly in profitability and coverage, leading to an overall unfavorable assessment. Qnity’s emerging position and reinvestment focus contrast with Marvell’s established but challenged financial metrics.
Strategic Positioning
This section compares the strategic positioning of Marvell Technology, Inc. and Qnity Electronics, Inc., covering Market position, Key segments, and Exposure to technological disruption:
Marvell Technology, Inc.
- Large market cap near 69B, facing high beta and strong competition in semiconductors.
- Diversified segments: data center, networking, storage, automotive, and consumer electronics.
- Exposure through integrated circuits and Ethernet solutions in advanced semiconductor markets.
Qnity Electronics, Inc.
- Smaller market cap about 19.5B, with no beta, indicating stable price movement.
- Focuses on electronic solutions and materials for semiconductor chip manufacturing only.
- Exposure limited to materials and electronic solutions for chip manufacturing processes.
Marvell Technology, Inc. vs Qnity Electronics, Inc. Positioning
Marvell has a diversified business model with multiple revenue streams, including data center and networking, supporting scale advantages. Qnity is concentrated on semiconductor materials, which may limit revenue diversification but focuses on a specialized niche.
Which has the best competitive advantage?
Marvell’s moat evaluation is very unfavorable with declining ROIC and value destruction, while Qnity’s neutral moat status shows stable profitability but no clear competitive advantage yet. Neither company currently demonstrates a strong sustainable moat.
Stock Comparison
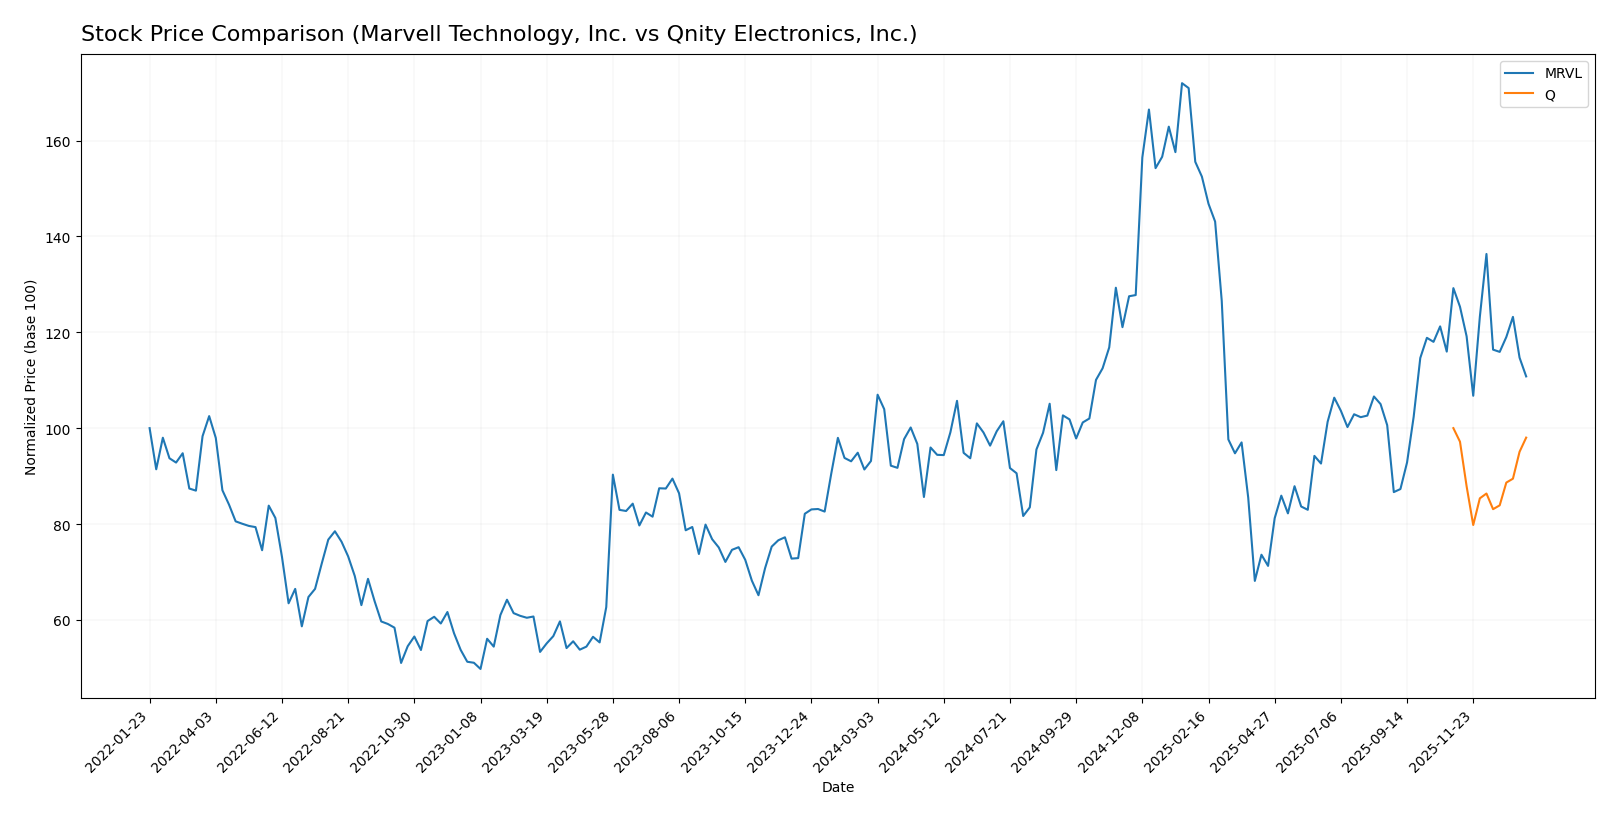
The stock price dynamics over the past 12 months reveal notable divergences between Marvell Technology, Inc. and Qnity Electronics, Inc., with Marvell exhibiting a strong bullish trend despite recent deceleration, while Qnity shows a marginal bearish trend with stable momentum.
Trend Analysis
Marvell Technology, Inc. posted an 18.94% price increase over the past year, indicating a bullish trend with decelerating momentum and a high volatility level (std deviation 16.46). The stock peaked at 124.76 and bottomed at 49.43.
Qnity Electronics, Inc. experienced a slight 1.98% price decline, signaling a bearish trend with stable acceleration and moderate volatility (std deviation 5.94). Its price ranged between 75.8 and 95.0 over the period.
Comparing both, Marvell Technology delivered the highest market performance over the past 12 months, outperforming Qnity Electronics by a significant margin in price appreciation.
Target Prices
The consensus target prices for Marvell Technology, Inc. and Qnity Electronics, Inc. reflect positive analyst expectations.
| Company | Target High | Target Low | Consensus |
|---|---|---|---|
| Marvell Technology, Inc. | 156 | 80 | 117 |
| Qnity Electronics, Inc. | 117 | 92 | 105.89 |
Analysts see Marvell’s stock rising from $80.38 to a consensus of $117, indicating upside potential. Qnity’s current price of $93.12 is also expected to grow toward a $105.89 consensus target.
Analyst Opinions Comparison
This section compares analysts’ ratings and grades for Marvell Technology, Inc. (MRVL) and Qnity Electronics, Inc. (Q):
Rating Comparison
MRVL Rating
- Rating: B+, considered very favorable overall.
- Discounted Cash Flow Score: 3, moderate valuation.
- ROE Score: 4, favorable profitability from equity.
- ROA Score: 5, very favorable asset utilization.
- Debt To Equity Score: 2, moderate financial risk.
- Overall Score: 3, moderate overall financial health.
Q Rating
- Rating: B+, also considered very favorable overall.
- Discounted Cash Flow Score: 4, favorable valuation.
- ROE Score: 3, moderate profitability from equity.
- ROA Score: 4, favorable asset utilization.
- Debt To Equity Score: 3, moderate financial risk.
- Overall Score: 3, moderate overall financial health.
Which one is the best rated?
Both MRVL and Q share the same overall rating of B+ with moderate overall scores. MRVL scores higher in ROE and ROA, indicating stronger profitability and asset use, while Q has a better discounted cash flow score and slightly higher debt to equity score.
Scores Comparison
The scores comparison between Marvell Technology, Inc. and Qnity Electronics, Inc. is as follows:
Marvell Technology, Inc. Scores
- Altman Z-Score: 6.76, indicating a safe zone with low bankruptcy risk.
- Piotroski Score: 7, indicating strong financial health.
Qnity Electronics, Inc. Scores
- No data available for Altman Z-Score.
- No data available for Piotroski Score.
Which company has the best scores?
Based on the provided data, Marvell Technology, Inc. has the best scores, showing a safe-zone Altman Z-Score and a strong Piotroski Score. Qnity Electronics, Inc. scores are unavailable for comparison.
Grades Comparison
Here is a comparison of recent grades from recognized grading companies for the two companies:
Marvell Technology, Inc. Grades
The following table summarizes Marvell Technology’s recent grades from various financial firms:
| Grading Company | Action | New Grade | Date |
|---|---|---|---|
| Rosenblatt | Maintain | Buy | 2026-01-07 |
| Melius Research | Upgrade | Buy | 2026-01-05 |
| Benchmark | Downgrade | Hold | 2025-12-08 |
| B. Riley Securities | Maintain | Buy | 2025-12-03 |
| JP Morgan | Maintain | Overweight | 2025-12-03 |
| Susquehanna | Maintain | Positive | 2025-12-03 |
| Benchmark | Maintain | Buy | 2025-12-03 |
| Oppenheimer | Maintain | Outperform | 2025-12-03 |
| Stifel | Maintain | Buy | 2025-12-03 |
| Rosenblatt | Maintain | Buy | 2025-12-03 |
Marvell Technology displays predominantly positive grades, with most firms maintaining or upgrading to Buy, while only Benchmark downgraded to Hold recently.
Qnity Electronics, Inc. Grades
The following table lists Qnity Electronics’ recent grades from recognized financial firms:
| Grading Company | Action | New Grade | Date |
|---|---|---|---|
| RBC Capital | Maintain | Outperform | 2025-11-25 |
| Mizuho | Maintain | Outperform | 2025-11-20 |
Qnity Electronics maintains consistent Outperform ratings from both grading companies, showing stable confidence.
Which company has the best grades?
Marvell Technology has a broader range of grades mostly clustered around Buy and Outperform, with one Hold downgrade, whereas Qnity Electronics holds stable Outperform ratings from fewer sources. Marvell’s diverse strong Buy and Buy recommendations may indicate wider analyst support, potentially affecting investor confidence differently compared to Qnity’s more limited but consistently positive ratings.
Strengths and Weaknesses
Below is a comparative overview of key strengths and weaknesses for Marvell Technology, Inc. (MRVL) and Qnity Electronics, Inc. (Q) based on their recent financial and operational data.
| Criterion | Marvell Technology, Inc. (MRVL) | Qnity Electronics, Inc. (Q) |
|---|---|---|
| Diversification | Strong diversification across Data Center (4.16B), Enterprise Networking (626M), Carrier Infrastructure (338M), Automotive & Industrial (322M), Consumer (316M) | Limited data on product diversification; primary focus unclear |
| Profitability | Negative net margin (-15.35%), negative ROIC (-3.88%), shedding value | Positive net margin (15.99%), moderate ROIC (5.92%), stable profitability |
| Innovation | Declining ROIC trend indicates challenges in sustaining innovation advantage | Neutral ROIC trend with stable profitability; innovation impact unclear |
| Global presence | Significant presence in high-growth sectors like Data Center and Networking | No detailed global segmentation available, likely smaller scale |
| Market Share | Large market share in Data Center and Networking segments but declining profitability questions sustainability | Market share uncertain; profitability is stable but not dominant |
Key takeaways: Marvell Technology offers strong diversification and scale but struggles with profitability and value creation, indicating financial stress. Qnity Electronics maintains stable profitability with a neutral competitive position but lacks clear diversification or scale advantages. Investors should weigh Marvell’s risk against Qnity’s steadiness.
Risk Analysis
Below is a comparative risk table for Marvell Technology, Inc. (MRVL) and Qnity Electronics, Inc. (Q) based on the most recent data available.
| Metric | Marvell Technology, Inc. (MRVL) | Qnity Electronics, Inc. (Q) |
|---|---|---|
| Market Risk | High beta (1.945) indicates strong volatility | Beta unavailable, but recent positive price move (+3.6%) suggests moderate volatility |
| Debt level | Moderate debt-to-equity (0.32) with good coverage issues (interest coverage negative) | Very low debt-to-equity (0.02), low financial risk |
| Regulatory Risk | Moderate, given global operations including China and Asia | Emerging company, regulatory risks less defined but potentially lower due to smaller scale |
| Operational Risk | Unfavorable margins and ROE signal operational challenges | Favorable margins but moderate ROE; operational efficiency improving |
| Environmental Risk | No specific data, typical semiconductor industry exposure | No specific data; likely similar sector risks |
| Geopolitical Risk | Exposure to Asia supply chains, sensitive to US-China tensions | Based in US, less exposed but still in global semiconductor supply chain |
Marvell faces the highest risk from market volatility and operational inefficiencies, with recent negative profitability and interest coverage concerns. Qnity, as a newer firm, shows lower debt risk and improving operational metrics but carries typical start-up uncertainties. Geopolitical tensions remain a key concern for both due to semiconductor industry dynamics.
Which Stock to Choose?
Marvell Technology, Inc. (MRVL) shows a revenue growth of 94.26% over 2021-2025 but suffers from negative profitability, with net margin at -15.35% and declining ROIC below WACC, indicating value destruction. Its financial ratios are mostly unfavorable, though it maintains a favorable rating of B+.
Qnity Electronics, Inc. (Q) exhibits a favorable income statement with a 15.99% net margin and positive EBIT margin of 20.72%, alongside stable ROIC near WACC suggesting no competitive moat. Its financial ratios are slightly favorable, and it shares the same B+ rating as MRVL.
Investors prioritizing growth might see MRVL’s strong revenue expansion as appealing despite profitability challenges, while those valuing stable income and solid financial ratios could find Q’s profile more aligned with risk-averse or quality-focused strategies.
Disclaimer: Investment carries a risk of loss of initial capital. The past performance is not a reliable indicator of future results. Be sure to understand risks before making an investment decision.
Go Further
I encourage you to read the complete analyses of Marvell Technology, Inc. and Qnity Electronics, Inc. to enhance your investment decisions: