Marvell Technology, Inc. and Onto Innovation Inc. are two prominent players in the semiconductor industry, each driving innovation in their specialized fields. Marvell focuses on integrated circuits and storage solutions, while Onto Innovation excels in process control and metrology tools critical to chip manufacturing. Their overlapping markets and distinct innovation strategies make this comparison essential. Join me as we explore which company stands out as the more compelling investment opportunity in 2026.
Table of contents
Companies Overview
I will begin the comparison between Marvell Technology and Onto Innovation by providing an overview of these two companies and their main differences.
Marvell Technology Overview
Marvell Technology, Inc. designs, develops, and sells integrated circuits including analog, mixed-signal, and digital signal processing products. It offers Ethernet solutions, storage controllers, processors, and ASIC products supporting various interfaces such as SAS, SATA, and NVMe. The company operates globally with a workforce of approximately 7,042 employees and is headquartered in Wilmington, Delaware.
Onto Innovation Overview
Onto Innovation Inc. specializes in process control tools for semiconductor manufacturing, including defect inspection, optical metrology, lithography systems, and analytical software. Its products support semiconductor and advanced packaging device manufacturers, serving diverse industrial applications. The company employs around 1,551 people and is based in Wilmington, Massachusetts.
Key similarities and differences
Both companies operate in the semiconductor industry and provide technology solutions critical to chip manufacturing. Marvell focuses on integrated circuits and storage solutions, while Onto Innovation concentrates on process control tools and analytical software. Marvell has a significantly larger workforce and market capitalization, reflecting its broader product portfolio and global reach compared to Onto Innovation’s more specialized offerings.
Income Statement Comparison
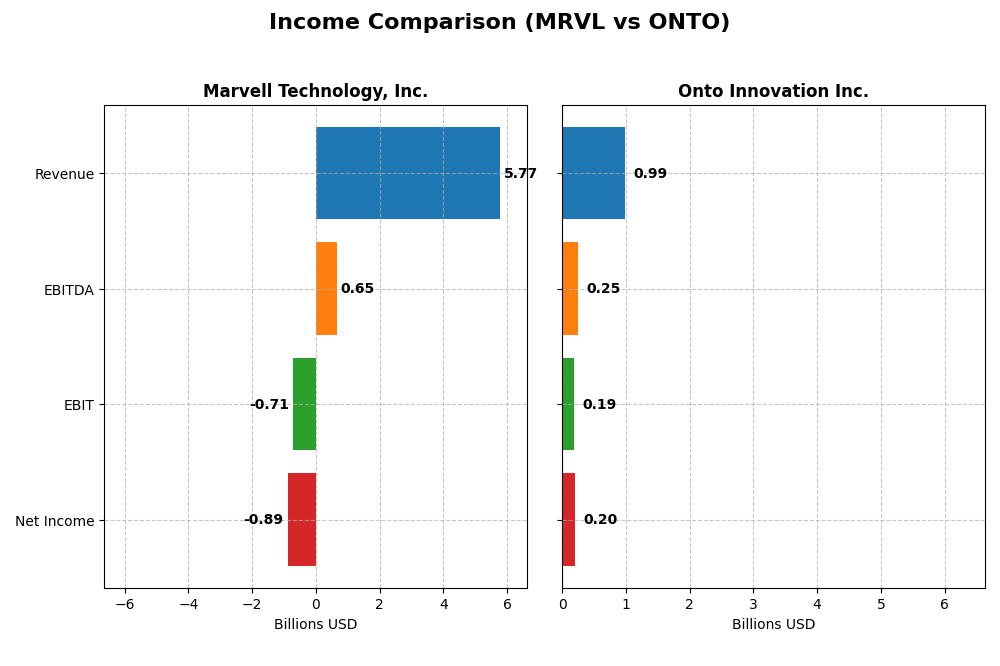
The table below compares the most recent fiscal year income statement metrics for Marvell Technology, Inc. and Onto Innovation Inc., providing a snapshot of their financial performance.
| Metric | Marvell Technology, Inc. (MRVL) | Onto Innovation Inc. (ONTO) |
|---|---|---|
| Market Cap | 69.3B | 10.7B |
| Revenue | 5.77B | 987M |
| EBITDA | 652M | 249M |
| EBIT | -705M | 187M |
| Net Income | -885M | 202M |
| EPS | -1.02 | 4.09 |
| Fiscal Year | 2025 | 2024 |
Income Statement Interpretations
Marvell Technology, Inc.
Marvell Technology’s revenue grew steadily from 3B in 2021 to 5.77B in 2025, a 94% increase over five years. However, net income remained negative, worsening from -277M to -885M, reflecting ongoing losses despite revenue gains. Gross margins stayed stable around 41%, but operating and net margins remained unfavorable, with EBIT margin declining in 2025 and net margin at -15.35%.
Onto Innovation Inc.
Onto Innovation displayed solid revenue growth from 556M in 2020 to 987M in 2024, with net income increasing strongly from 31M to 202M. Margins improved consistently, with a gross margin above 52% and EBIT margin at nearly 19% in 2024. The net margin was positive at 20.43%, supported by favorable growth in earnings per share and operating efficiency in the latest year.
Which one has the stronger fundamentals?
Onto Innovation shows stronger fundamentals with consistent profitability, expanding margins, and robust earnings growth. Marvell Technology, despite revenue growth, struggles with persistent net losses and negative operating margins. The contrast in margin stability and net income trends favors Onto for income statement strength, highlighting its better operational and financial health over the period.
Financial Ratios Comparison
This table presents a side-by-side comparison of key financial ratios for Marvell Technology, Inc. and Onto Innovation Inc. based on their most recent fiscal year data.
| Ratios | Marvell Technology, Inc. (MRVL) | Onto Innovation Inc. (ONTO) |
|---|---|---|
| ROE | -6.59% | 10.47% |
| ROIC | -3.88% | 8.77% |
| P/E | -110.37 | 41.76 |
| P/B | 7.27 | 4.37 |
| Current Ratio | 1.54 | 8.69 |
| Quick Ratio | 1.03 | 7.00 |
| D/E (Debt-to-Equity) | 0.32 | 0.01 |
| Debt-to-Assets | 21.50% | 0.72% |
| Interest Coverage | -3.80 | 0 |
| Asset Turnover | 0.29 | 0.47 |
| Fixed Asset Turnover | 5.56 | 7.16 |
| Payout ratio | -23.45% | 0 |
| Dividend yield | 0.21% | 0 |
Interpretation of the Ratios
Marvell Technology, Inc.
Marvell Technology shows mixed financial strength with 42.86% favorable ratios but 57.14% unfavorable, including negative net margin (-15.35%), return on equity (-6.59%), and high interest coverage concerns. Its current and quick ratios are adequate, and debt levels appear manageable. The company pays dividends with a low yield of 0.21%, which may signal cautious shareholder returns amid operational challenges.
Onto Innovation Inc.
Onto Innovation displays a more balanced profile with 42.86% favorable, 42.86% unfavorable, and 14.29% neutral ratios. It posts a positive net margin (20.43%) and sound interest coverage. However, high price multiples and a very high current ratio appear less favorable. The firm does not pay dividends, likely focusing on reinvestment and growth, supported by strong free cash flow yields and conservative debt levels.
Which one has the best ratios?
Onto Innovation presents a more neutral overall ratio assessment with a positive net margin and strong liquidity, while Marvell Technology’s ratios skew more unfavorable, marked by losses and weaker profitability measures. Onto’s balance between strengths and weaknesses contrasts with Marvell’s heavier operational and financial challenges, suggesting differing risk profiles for investors.
Strategic Positioning
This section compares the strategic positioning of Marvell Technology, Inc. and Onto Innovation Inc., including market position, key segments, and exposure to technological disruption:
Marvell Technology, Inc.
- Large market cap of 69B, facing strong competition in semiconductors sector.
- Diversified segments: data center, enterprise networking, carrier infrastructure, automotive, consumer electronics.
- Exposure to disruption through integrated circuit and Ethernet solution innovation in semiconductors.
Onto Innovation Inc.
- Smaller market cap of 10.7B, operates in niche semiconductor equipment market.
- Concentrated on process control tools, lithography, metrology, and software for semiconductor manufacturing.
- Exposure to technological advances in process control and metrology, critical for semiconductor production quality.
Marvell Technology, Inc. vs Onto Innovation Inc. Positioning
Marvell pursues a diversified approach across multiple semiconductor segments, potentially reducing risk but increasing competitive pressure. Onto Innovation focuses on specialized semiconductor equipment and software, which may offer focused expertise but less market breadth.
Which has the best competitive advantage?
Both companies currently shed value as ROIC is below WACC; however, Onto Innovation shows improving profitability trends, while Marvell experiences declining returns, indicating a slightly stronger competitive advantage for Onto.
Stock Comparison
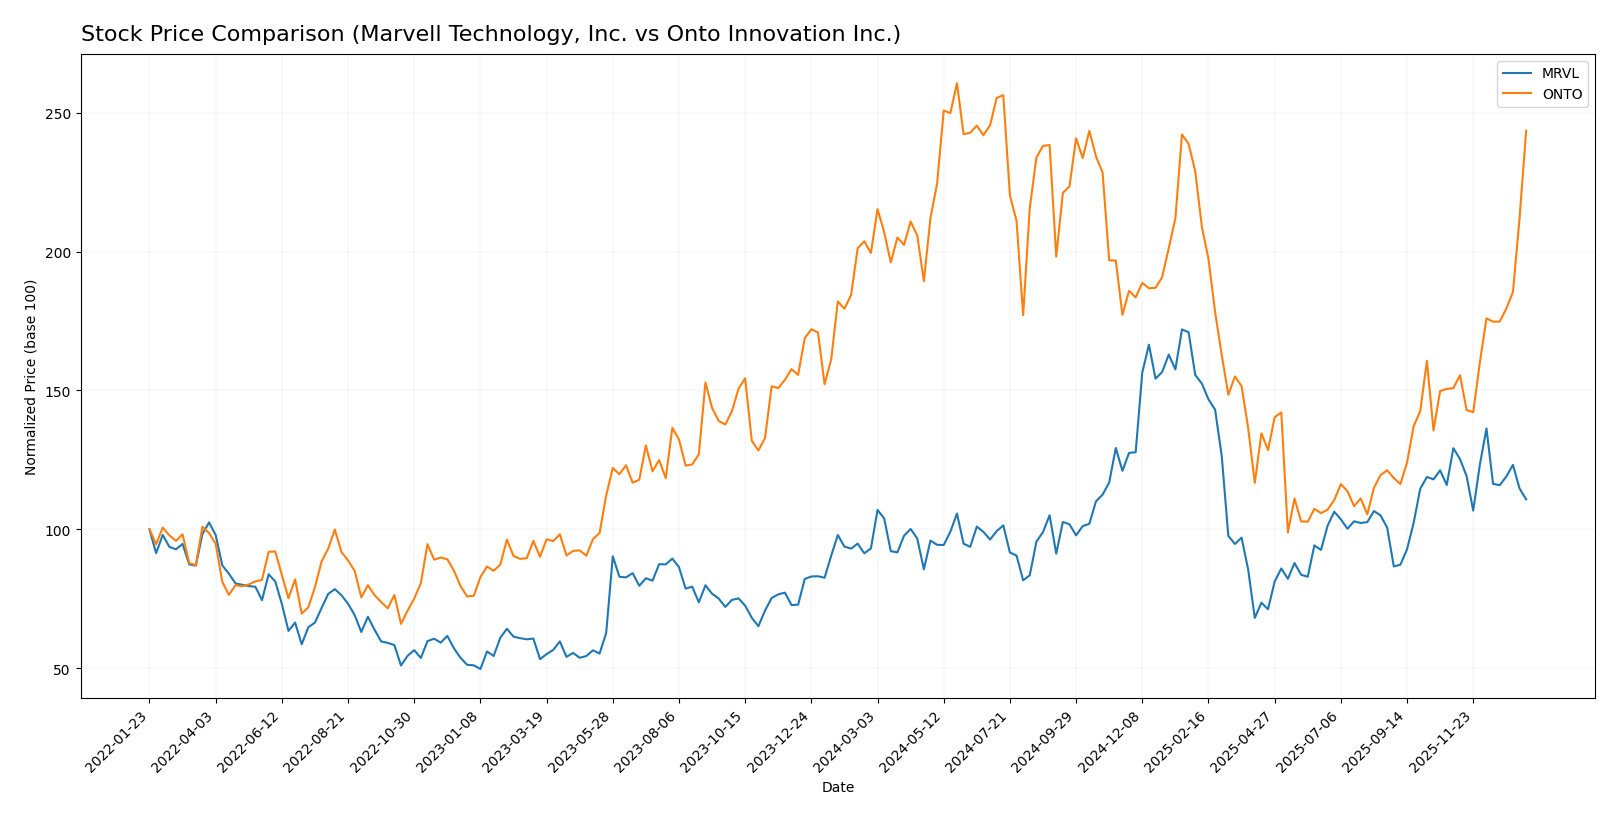
The stock price movements of Marvell Technology, Inc. and Onto Innovation Inc. over the past 12 months reveal distinct bullish trends, with notable shifts in recent trading dynamics and volume behavior.
Trend Analysis
Marvell Technology, Inc. exhibited an 18.94% price increase over the past year, marking a bullish trend with deceleration and a high volatility level at 16.46 std deviation. The stock recently declined by 14.25%, showing a negative slope and seller dominance.
Onto Innovation Inc. posted a 22.07% gain in the last 12 months with an accelerating bullish trend and significant volatility at 42.61 std deviation. In the recent period, it surged 61.42%, maintaining strong buyer dominance and a steep positive slope.
Comparing both stocks, Onto Innovation delivered a higher overall market performance and stronger recent upward momentum than Marvell Technology during the analyzed timeframe.
Target Prices
Analysts present a clear target price consensus for both Marvell Technology, Inc. and Onto Innovation Inc.
| Company | Target High | Target Low | Consensus |
|---|---|---|---|
| Marvell Technology, Inc. | 156 | 80 | 117 |
| Onto Innovation Inc. | 200 | 160 | 178 |
The consensus target for Marvell at 117 suggests a moderate upside from its current price of 80.38, while Onto Innovation’s consensus at 178 indicates a potential pullback from its current 217.85, reflecting differing analyst expectations.
Analyst Opinions Comparison
This section compares analysts’ ratings and grades for Marvell Technology, Inc. and Onto Innovation Inc.:
Rating Comparison
MRVL Rating
- Rating: B+, considered very favorable by analysts.
- Discounted Cash Flow Score: 3, indicating a moderate valuation based on cash flow.
- ROE Score: 4, showing favorable efficiency in generating profit from equity.
- ROA Score: 5, rated very favorable for effective asset utilization.
- Debt To Equity Score: 2, moderate financial risk with higher reliance on debt.
- Overall Score: 3, representing a moderate overall financial standing.
ONTO Rating
- Rating: B+, also rated very favorable by analysts.
- Discounted Cash Flow Score: 3, similarly moderate valuation assessment.
- ROE Score: 3, indicating moderate profit generation efficiency.
- ROA Score: 4, reflecting favorable asset utilization effectiveness.
- Debt To Equity Score: 4, favorable financial stability with lower debt reliance.
- Overall Score: 3, also reflecting a moderate overall financial standing.
Which one is the best rated?
Both MRVL and ONTO share the same overall rating of B+ and an overall score of 3. MRVL scores higher on ROE and ROA, while ONTO has a better debt-to-equity score, indicating different strengths in profitability and financial stability respectively.
Scores Comparison
The comparison of Marvell Technology and Onto Innovation scores is as follows:
MRVL Scores
- Altman Z-Score: 6.76, indicating a safe zone status.
- Piotroski Score: 7, reflecting strong financial health.
ONTO Scores
- Altman Z-Score: 34.16, indicating a safe zone status.
- Piotroski Score: 4, reflecting average financial health.
Which company has the best scores?
Based on the provided data, Onto Innovation has a substantially higher Altman Z-Score, suggesting stronger bankruptcy protection, while Marvell Technology has a notably higher Piotroski Score, indicating better overall financial strength.
Grades Comparison
The following presents the recent grades and rating trends for Marvell Technology, Inc. and Onto Innovation Inc.:
Marvell Technology, Inc. Grades
This table summarizes recent grades issued by reputable grading companies for Marvell Technology, Inc.:
| Grading Company | Action | New Grade | Date |
|---|---|---|---|
| Rosenblatt | Maintain | Buy | 2026-01-07 |
| Melius Research | Upgrade | Buy | 2026-01-05 |
| Benchmark | Downgrade | Hold | 2025-12-08 |
| B. Riley Securities | Maintain | Buy | 2025-12-03 |
| JP Morgan | Maintain | Overweight | 2025-12-03 |
| Susquehanna | Maintain | Positive | 2025-12-03 |
| Benchmark | Maintain | Buy | 2025-12-03 |
| Oppenheimer | Maintain | Outperform | 2025-12-03 |
| Stifel | Maintain | Buy | 2025-12-03 |
| Rosenblatt | Maintain | Buy | 2025-12-03 |
Marvell Technology’s grades predominantly indicate buy or outperform ratings, with a single recent downgrade to hold, suggesting mostly positive analyst sentiment.
Onto Innovation Inc. Grades
This table summarizes recent grades issued by reputable grading companies for Onto Innovation Inc.:
| Grading Company | Action | New Grade | Date |
|---|---|---|---|
| Stifel | Maintain | Hold | 2026-01-14 |
| Needham | Maintain | Buy | 2026-01-06 |
| Jefferies | Maintain | Buy | 2025-12-15 |
| B. Riley Securities | Maintain | Buy | 2025-11-18 |
| Needham | Maintain | Buy | 2025-11-18 |
| Evercore ISI Group | Maintain | Outperform | 2025-11-05 |
| Oppenheimer | Maintain | Outperform | 2025-10-14 |
| Stifel | Maintain | Hold | 2025-10-13 |
| B. Riley Securities | Maintain | Buy | 2025-10-10 |
| Jefferies | Upgrade | Buy | 2025-09-23 |
Onto Innovation’s ratings mainly consist of buy and outperform grades, with a few hold ratings, indicating generally favorable but slightly more cautious analyst views.
Which company has the best grades?
Marvell Technology, Inc. shows a stronger consensus with a higher volume of buy and outperform ratings and fewer hold grades compared to Onto Innovation Inc. This suggests Marvell may attract more bullish investor sentiment, potentially affecting market perception and investment interest differently for each company.
Strengths and Weaknesses
Below is a comparison of key strengths and weaknesses for Marvell Technology, Inc. (MRVL) and Onto Innovation Inc. (ONTO) based on their latest financial and operational data.
| Criterion | Marvell Technology, Inc. (MRVL) | Onto Innovation Inc. (ONTO) |
|---|---|---|
| Diversification | Highly diversified across Data Center (4.16B), Enterprise Networking (626M), Carrier Infrastructure (338M), Automotive & Industrial (322M), Consumer (316M) | Focused mainly on Systems and Software (850M), with smaller Parts (77M) and Service (60M) segments |
| Profitability | Negative net margin (-15.35%), negative ROE (-6.59%), negative ROIC (-3.88%), indicating unprofitable operations | Positive net margin (20.43%), neutral ROE (10.47%), neutral ROIC (8.77%), showing profitable and stable operations |
| Innovation | Moderate fixed asset turnover (5.56) suggests efficient asset use, but declining ROIC trend (-73%) signals weakening competitive advantage | Higher fixed asset turnover (7.16) and strongly growing ROIC trend (+344%) indicate improving innovation and operational efficiency |
| Global presence | Strong global footprint across various tech sectors, especially data center and networking | More niche market focus but improving global reach via systems/software solutions |
| Market Share | Large market share in data centers and networking, but value destruction and declining profitability raise concerns | Smaller market share but growing profitability and ROIC may signal expanding competitive position |
Key takeaways: Marvell shows strong diversification and market presence but struggles with profitability and value creation, reflected in a very unfavorable moat. Onto Innovation, while less diversified, demonstrates improving profitability and a growing moat, making it a more stable choice currently. Caution is advised with MRVL due to negative financial trends.
Risk Analysis
The table below summarizes key risk factors for Marvell Technology, Inc. (MRVL) and Onto Innovation Inc. (ONTO) based on their most recent financial and operational data:
| Metric | Marvell Technology, Inc. (MRVL) | Onto Innovation Inc. (ONTO) |
|---|---|---|
| Market Risk | High beta of 1.945 indicates higher volatility and sensitivity to market fluctuations. | Beta of 1.461 suggests moderate market volatility risk. |
| Debt Level | Moderate debt-to-equity ratio of 0.32; manageable leverage. | Very low debt-to-equity ratio of 0.01; low financial risk. |
| Regulatory Risk | Exposure to global semiconductor regulations, including U.S.-China trade tensions. | Similar exposure but smaller scale; regulatory changes in semiconductor manufacturing could impact. |
| Operational Risk | Negative net margin (-15.35%) and ROE (-6.59%) signal profitability challenges. | Positive net margin (20.43%) but moderate ROE (10.47%) with high current ratio suggests operational liquidity. |
| Environmental Risk | Operations in multiple countries may face environmental compliance costs. | Smaller footprint but still exposed to environmental regulations in manufacturing. |
| Geopolitical Risk | Significant operations in Asia (China, Taiwan, South Korea) vulnerable to geopolitical tensions. | Also exposed to geopolitical risks but less diversified internationally. |
In synthesis, Marvell faces the most impactful risks from high market volatility and operational profitability challenges, compounded by geopolitical exposure in Asia. Onto Innovation benefits from low debt and strong margins but remains vulnerable to market swings and industry regulatory shifts. Cautious risk management is advised for both, especially in light of global semiconductor sector uncertainties.
Which Stock to Choose?
Marvell Technology, Inc. (MRVL) shows mixed income evolution with a slight revenue growth of 4.71% in 2025 but unfavorable net margins at -15.35%. Its financial ratios are mostly unfavorable, with low profitability and a high net debt to EBITDA ratio. Despite this, MRVL maintains a strong rating of B+ and a safe zone Altman Z-Score.
Onto Innovation Inc. (ONTO) presents favorable income growth, including a 21.01% revenue increase and a strong net margin of 20.43%. Its financial ratios are more balanced, with positive profitability and low debt levels. ONTO also holds a B+ rating and a safe Altman Z-Score, though its Piotroski Score is average.
Investors focused on growth may find ONTO appealing due to its favorable income statement and improving profitability, while those who prioritize financial stability and lower risk could see MRVL’s moderate rating and strong solvency signals as more suitable. The choice might appear to depend on the investor’s risk tolerance and preference for either growth or quality metrics.
Disclaimer: Investment carries a risk of loss of initial capital. The past performance is not a reliable indicator of future results. Be sure to understand risks before making an investment decision.
Go Further
I encourage you to read the complete analyses of Marvell Technology, Inc. and Onto Innovation Inc. to enhance your investment decisions: