Marvell Technology, Inc. (MRVL) and ON Semiconductor Corporation (ON) are two prominent players in the semiconductor industry, each driving innovation in integrated circuits and power solutions. While Marvell excels in data infrastructure and storage technologies, ON Semiconductor focuses on intelligent sensing and power management for electric vehicles and sustainable energy. This article will help you identify which company presents a more compelling investment opportunity in today’s dynamic tech landscape.

Table of contents
Companies Overview
I will begin the comparison between Marvell Technology and ON Semiconductor by providing an overview of these two companies and their main differences.
Marvell Technology Overview
Marvell Technology, Inc. designs, develops, and sells a broad range of integrated circuits including analog, mixed-signal, digital signal processing, and embedded products. The company offers Ethernet solutions, storage controllers, and system-on-a-chip products, positioning itself as a key player in the semiconductor industry. Headquartered in Wilmington, Delaware, Marvell operates globally with a workforce of approximately 7,000 employees.
ON Semiconductor Overview
ON Semiconductor Corporation focuses on intelligent sensing and power solutions, primarily serving the automotive, industrial, and sustainable energy markets. The company provides analog, discrete, and integrated semiconductor products, enabling applications like electric vehicles and fast-charging systems. Based in Scottsdale, Arizona, ON Semiconductor employs around 26,400 people, emphasizing its scale and diversified product segments.
Key similarities and differences
Both companies operate within the semiconductor sector and develop analog and mixed-signal integrated circuits. However, Marvell concentrates on Ethernet, storage, and processing solutions, while ON Semiconductor targets intelligent sensing and power technologies, especially for automotive electrification and energy systems. ON has a significantly larger workforce and broader application focus compared to Marvell’s specialized product portfolio.
Income Statement Comparison
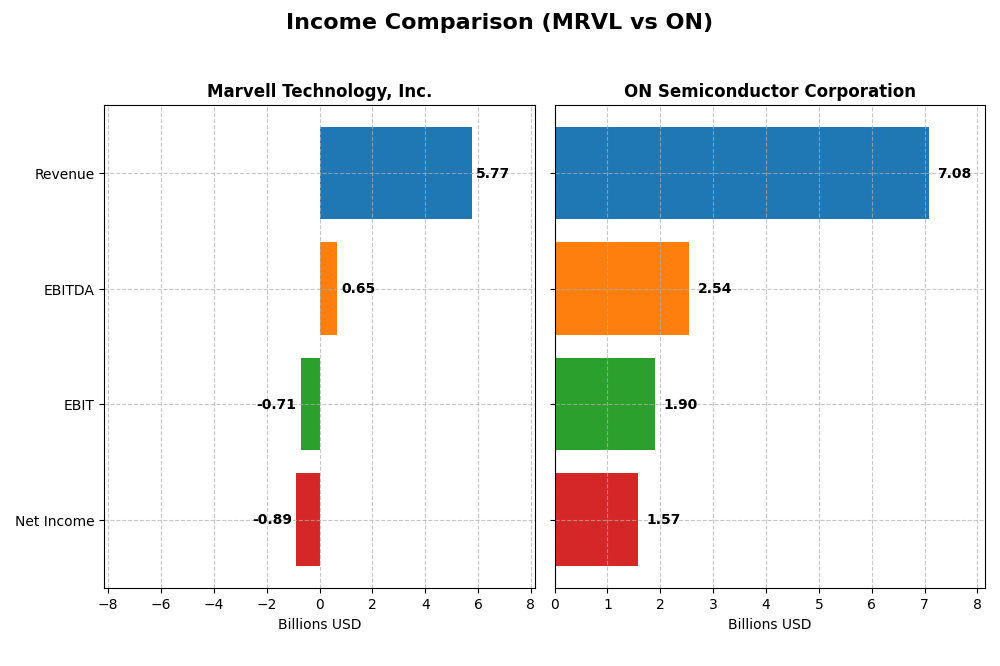
The table below compares the key income statement metrics for Marvell Technology, Inc. and ON Semiconductor Corporation for their most recent fiscal years.
| Metric | Marvell Technology, Inc. (MRVL) | ON Semiconductor Corporation (ON) |
|---|---|---|
| Market Cap | 69.3B | 24.7B |
| Revenue | 5.77B | 7.08B |
| EBITDA | 652M | 2.54B |
| EBIT | -705M | 1.90B |
| Net Income | -885M | 1.57B |
| EPS | -1.02 | 3.68 |
| Fiscal Year | 2025 | 2024 |
Income Statement Interpretations
Marvell Technology, Inc.
Marvell Technology showed a revenue increase of 94.26% over 2021-2025 but suffered a net income decline of 219.15%, with margins weakening overall. Gross margin remained solid at 41.31%, yet EBIT and net margins were negative in 2025. The latest year saw modest revenue growth of 4.71% but a 28.94% drop in EBIT, indicating margin pressure despite a slight net margin improvement.
ON Semiconductor Corporation
ON Semiconductor recorded 34.77% revenue growth from 2020 to 2024, alongside a strong net income increase of 571.56%. Margins were consistently robust, with a 45.41% gross margin and 22.21% net margin in 2024. However, the most recent year showed declines in revenue (-14.19%) and earnings per share (-25.77%), signaling short-term headwinds despite long-term strength.
Which one has the stronger fundamentals?
ON Semiconductor demonstrates stronger fundamentals with favorable margins across gross, EBIT, and net income, plus significant net income and EPS growth over the period. Marvell’s revenue growth is notable but offset by persistent net losses and unfavorable EBIT margins. ON’s more consistent profitability and margin stability suggest a financially healthier profile based on income statement metrics.
Financial Ratios Comparison
This table presents the most recent financial ratios for Marvell Technology, Inc. and ON Semiconductor Corporation based on their fiscal year 2025 and 2024 data respectively.
| Ratios | Marvell Technology, Inc. (2025) | ON Semiconductor Corporation (2024) |
|---|---|---|
| ROE | -6.59% | 17.88% |
| ROIC | -3.88% | 11.88% |
| P/E | -110.37 | 17.13 |
| P/B | 7.27 | 3.06 |
| Current Ratio | 1.54 | 5.06 |
| Quick Ratio | 1.03 | 3.38 |
| D/E | 0.32 | 0.38 |
| Debt-to-Assets | 21.50% | 23.90% |
| Interest Coverage | -3.80 | 28.37 |
| Asset Turnover | 0.29 | 0.50 |
| Fixed Asset Turnover | 5.56 | 1.61 |
| Payout ratio | -23.45% | 0% |
| Dividend yield | 0.21% | 0% |
Interpretation of the Ratios
Marvell Technology, Inc.
Marvell shows a mixed ratio profile with 42.86% favorable and 57.14% unfavorable indicators, signaling caution. Key weaknesses include negative net margin (-15.35%) and return on equity (-6.59%), while liquidity ratios are positive. Marvell pays a modest dividend with a low yield of 0.21%, but coverage and buyback details suggest potential sustainability risks.
ON Semiconductor Corporation
ON Semiconductor’s ratios appear stronger, with 50% favorable and 28.57% unfavorable, reflecting a slightly favorable outlook. It boasts a solid net margin of 22.21% and return on equity of 17.88%, though the price-to-book ratio and current ratio show some concern. The company does not pay dividends, focusing instead on reinvestment and growth strategies.
Which one has the best ratios?
Comparing both, ON Semiconductor demonstrates a more balanced and favorable financial ratio profile with superior profitability and coverage ratios. Marvell’s results are weaker, burdened by negative returns and margin issues. Overall, ON Semiconductor holds an edge in financial health based on the provided ratios, though each company has distinct structural traits.
Strategic Positioning
This section compares the strategic positioning of Marvell Technology, Inc. and ON Semiconductor Corporation across Market position, Key segments, and Exposure to technological disruption:
Marvell Technology, Inc.
- Larger market cap (~69.3B) with higher beta (1.945) indicating greater market volatility.
- Diversified segments: Data Center (~4.16B), Enterprise Networking (~626M), Automotive (~322M).
- Operates in integrated circuits with exposure to Ethernet, storage, and networking tech.
ON Semiconductor Corporation
- Smaller market cap (~24.7B) and lower beta (1.543) suggesting relatively less market volatility.
- Focused on Power Solutions (~3.35B), Analog (~2.61B), and Intelligent Sensing (~1.13B) as main revenue drivers.
- Concentrated on intelligent power, sensing, and analog semiconductors supporting automotive and industrial fields.
Marvell Technology, Inc. vs ON Semiconductor Corporation Positioning
Marvell exhibits a more diversified portfolio across data center, networking, and automotive markets, while ON Semiconductor concentrates on power, analog, and sensing solutions. Marvell’s broader exposure may mitigate risk but faces more market volatility; ON’s focused segments align with automotive electrification and sensing trends.
Which has the best competitive advantage?
ON Semiconductor shows a slightly favorable moat with growing profitability, indicating improving competitive positioning; Marvell’s very unfavorable moat and declining returns suggest weaker value creation and competitive advantage.
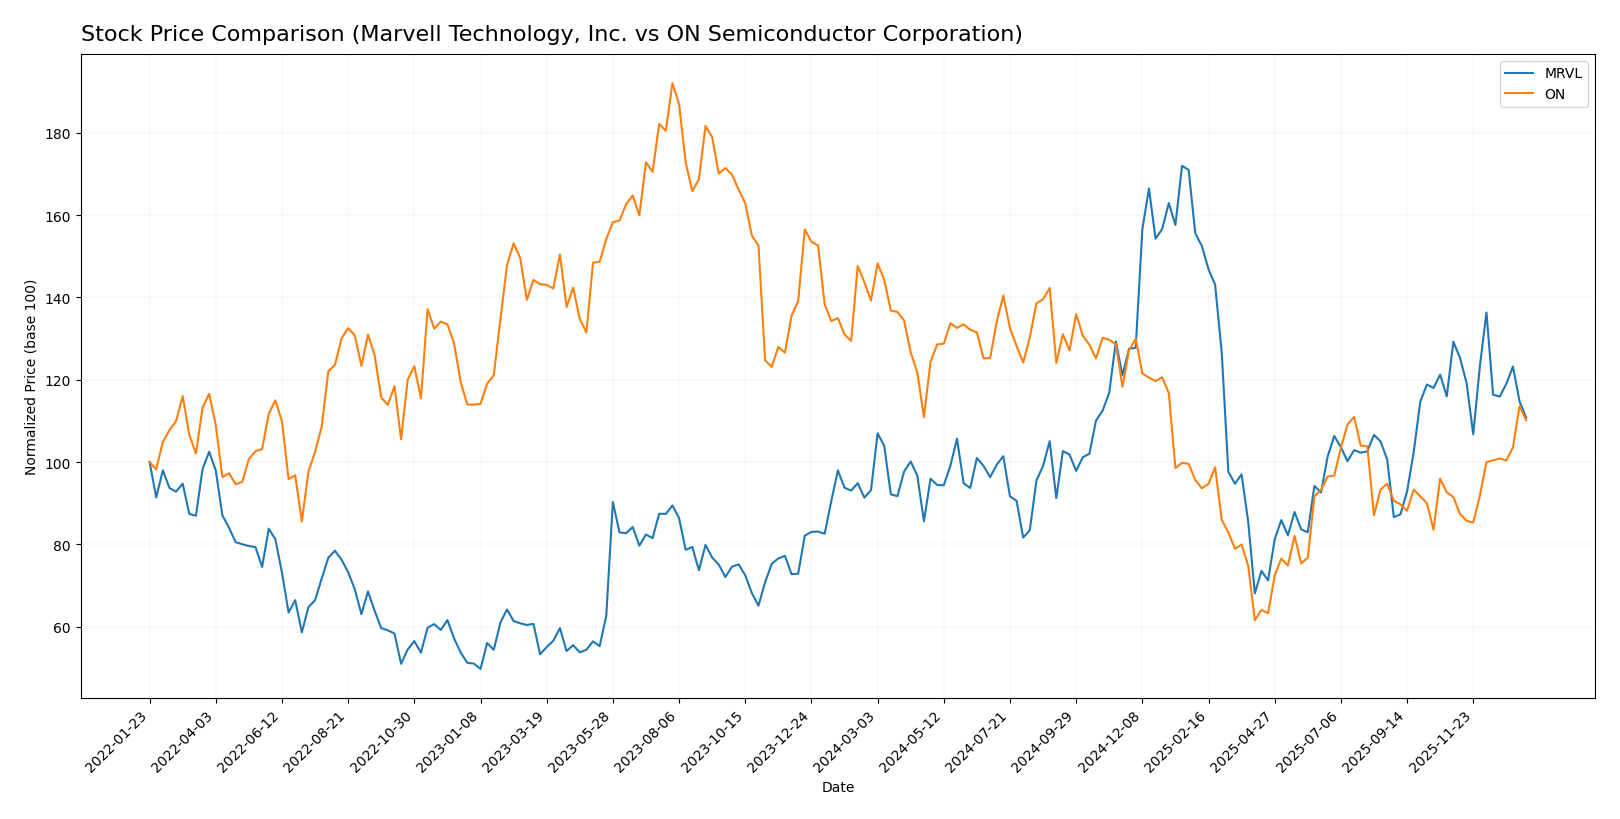
Stock Comparison
The stock price movements of Marvell Technology, Inc. and ON Semiconductor Corporation over the past 12 months exhibit contrasting dynamics, with Marvell showing a strong overall gain despite recent weakening, while ON Semiconductor has faced a longer-term decline but rebounded lately.
Trend Analysis
Marvell Technology, Inc. has experienced a bullish trend over the past year with an 18.94% price increase, although there is a recent deceleration and a short-term decline of 14.25% from November 2025 to January 2026. Volatility remains elevated with a standard deviation of 16.46.
ON Semiconductor Corporation shows a bearish trend for the full year, declining 20.88% overall; however, recent months reflect an accelerating recovery with a 20.37% gain and a positive slope of 1.28. The stock’s volatility is moderate with a 11.97 standard deviation.
Comparing both stocks, Marvell Technology delivered the highest market performance over the full 12-month period, outperforming ON Semiconductor despite ON’s recent positive momentum.
Target Prices
Here is the current consensus on target prices from verified analysts for selected semiconductor companies.
| Company | Target High | Target Low | Consensus |
|---|---|---|---|
| Marvell Technology, Inc. | 156 | 80 | 117 |
| ON Semiconductor Corporation | 64 | 51 | 58.33 |
Analysts expect Marvell Technology’s stock to appreciate significantly from its current price of $80.38, while ON Semiconductor’s consensus target is slightly below its current price of $60.28, indicating more cautious optimism.
Analyst Opinions Comparison
This section compares analysts’ ratings and grades for Marvell Technology, Inc. and ON Semiconductor Corporation:
Rating Comparison
MRVL Rating
- Rating: B+, rated Very Favorable overall
- Discounted Cash Flow Score: 3, moderate valuation
- Return on Equity Score: 4, favorable profit efficiency
- Return on Assets Score: 5, very favorable asset use
- Debt To Equity Score: 2, moderate financial risk
- Overall Score: 3, moderate financial standing
ON Rating
- Rating: B-, rated Very Favorable overall
- Discounted Cash Flow Score: 3, moderate valuation
- Return on Equity Score: 2, moderate profit efficiency
- Return on Assets Score: 3, moderate asset use
- Debt To Equity Score: 2, moderate financial risk
- Overall Score: 2, moderate financial standing
Which one is the best rated?
Marvell Technology holds higher ratings in return on equity and assets, with an overall score above ON Semiconductor. Both have moderate discounted cash flow and debt scores, but Marvell is better rated based on these metrics.
Scores Comparison
The following table compares the Altman Z-Score and Piotroski Score of Marvell Technology, Inc. and ON Semiconductor Corporation:
MRVL Scores
- Altman Z-Score: 6.76, indicating a safe zone status
- Piotroski Score: 7, classified as strong
ON Scores
- Altman Z-Score: 4.84, also in the safe zone
- Piotroski Score: 6, classified as average
Which company has the best scores?
Based on the provided data, MRVL has higher scores in both Altman Z-Score and Piotroski Score, indicating stronger financial stability and health compared to ON.
Grades Comparison
Here is a comparison of the most recent reliable grades from recognized grading companies for both Marvell Technology, Inc. and ON Semiconductor Corporation:
Marvell Technology, Inc. Grades
The following table summarizes recent grades from established firms for Marvell Technology:
| Grading Company | Action | New Grade | Date |
|---|---|---|---|
| Rosenblatt | Maintain | Buy | 2026-01-07 |
| Melius Research | Upgrade | Buy | 2026-01-05 |
| Benchmark | Downgrade | Hold | 2025-12-08 |
| B. Riley Securities | Maintain | Buy | 2025-12-03 |
| JP Morgan | Maintain | Overweight | 2025-12-03 |
| Susquehanna | Maintain | Positive | 2025-12-03 |
| Benchmark | Maintain | Buy | 2025-12-03 |
| Oppenheimer | Maintain | Outperform | 2025-12-03 |
| Stifel | Maintain | Buy | 2025-12-03 |
| Rosenblatt | Maintain | Buy | 2025-12-03 |
Marvell’s grades show a strong buy consensus with mostly maintained or upgraded ratings, indicating stable positive sentiment among analysts.
ON Semiconductor Corporation Grades
The following table shows the latest grades from recognized analysts for ON Semiconductor:
| Grading Company | Action | New Grade | Date |
|---|---|---|---|
| Piper Sandler | Maintain | Overweight | 2026-01-07 |
| Truist Securities | Maintain | Hold | 2025-12-19 |
| Morgan Stanley | Maintain | Equal Weight | 2025-11-24 |
| Truist Securities | Maintain | Hold | 2025-11-04 |
| Baird | Maintain | Neutral | 2025-11-04 |
| Rosenblatt | Maintain | Neutral | 2025-11-04 |
| Morgan Stanley | Maintain | Equal Weight | 2025-11-04 |
| TD Cowen | Maintain | Buy | 2025-11-04 |
| UBS | Maintain | Neutral | 2025-10-27 |
| B of A Securities | Maintain | Neutral | 2025-09-05 |
ON Semiconductor’s grades tend to be more mixed with more Hold and Neutral ratings, showing a more cautious analyst outlook compared to Marvell.
Which company has the best grades?
Marvell Technology has received more consistent Buy and Outperform grades, reflecting stronger analyst confidence. ON Semiconductor’s ratings are more conservative, with many Hold and Neutral marks. This difference could impact investor sentiment by indicating higher conviction in Marvell’s growth potential relative to ON.
Strengths and Weaknesses
Below is a comparison of key strengths and weaknesses of Marvell Technology, Inc. (MRVL) and ON Semiconductor Corporation (ON) based on recent financial and operational data:
| Criterion | Marvell Technology, Inc. (MRVL) | ON Semiconductor Corporation (ON) |
|---|---|---|
| Diversification | Moderate, focused on Data Center (4.16B) and Networking segments, with smaller contributions from Automotive and Consumer sectors. | Broad, with strong revenues from Power Solutions (3.35B), Analog Solutions (2.61B), and Intelligent Sensing (1.13B). |
| Profitability | Unfavorable: Negative net margin (-15.35%) and declining ROIC (-3.88%) indicating value destruction. | Favorable: Strong net margin (22.21%), ROIC (11.88%), and growing profitability trend. |
| Innovation | Weak profitability suggests challenges in sustaining competitive edge; innovation impact unclear. | Positive, supported by growing ROIC and diversified product groups indicating ongoing innovation. |
| Global presence | Significant in Data Center and Carrier Infrastructure markets, but less balanced globally. | Well diversified across multiple industrial and sensing markets, implying strong global reach. |
| Market Share | Declining profitability and value destruction may weaken competitive position. | Slightly favorable moat status with improving competitive positioning and value creation. |
Key takeaway: ON Semiconductor demonstrates stronger profitability, diversified revenue streams, and improving competitive advantage, making it a more attractive option for investors focused on value creation. Marvell Technology shows significant challenges with declining profitability and value destruction, indicating higher investment risk.
Risk Analysis
Below is a comparative risk table for Marvell Technology, Inc. (MRVL) and ON Semiconductor Corporation (ON) based on the most recent data from 2025 and 2024.
| Metric | Marvell Technology, Inc. (MRVL) | ON Semiconductor Corporation (ON) |
|---|---|---|
| Market Risk | High beta 1.945, volatile price range (47.09-127.48 USD) | Moderate beta 1.543, narrower price range (31.04-63.63 USD) |
| Debt Level | Moderate debt-to-equity 0.32, debt-to-assets 21.5% | Moderate debt-to-equity 0.38, debt-to-assets 23.9% |
| Regulatory Risk | Exposure to international markets, including China and Southeast Asia | Global operations with emphasis on automotive and industrial markets, subject to evolving regulations |
| Operational Risk | Negative net margin (-15.35%) and unfavorable interest coverage (-3.72) indicating operational challenges | Positive net margin (22.21%) and strong interest coverage (30.49), but high current ratio (5.06) may signal inefficiency |
| Environmental Risk | Industry exposure to semiconductor manufacturing environmental standards | Focus on sustainable energy and automotive electrification reduces some environmental risks |
| Geopolitical Risk | Significant operations in Asia with supply chain sensitivity | Also exposed to geopolitical tensions impacting semiconductor supply chains |
Synthesis: Marvell (MRVL) faces higher market volatility and operational risks, with negative profitability and interest coverage posing significant concerns. ON Semiconductor (ON) shows stronger financial health and operational efficiency but carries moderate market and regulatory risks. Geopolitical tensions in Asia remain a critical risk for both, especially MRVL due to its broader exposure.
Which Stock to Choose?
Marvell Technology, Inc. shows a mixed income evolution with a 4.71% revenue growth in 2025, but negative net margin (-15.35%) and declining profitability ratios such as ROE (-6.59%) and ROIC (-3.88%). Its debt levels are moderate, and the overall rating is very favorable (B+), despite a global unfavorable financial ratio assessment and a very unfavorable moat due to value destruction.
ON Semiconductor Corporation exhibits favorable income metrics overall, including a 22.21% net margin and a 17.88% ROE in 2024, despite a recent revenue decline of -14.19%. Its debt ratios remain manageable, and it holds a slightly favorable global ratio evaluation. The company’s rating is very favorable (B-), supported by a slightly favorable moat with improving profitability.
Investors focused on growth and improving profitability may find ON Semiconductor’s upward ROIC trend and stronger income statement more appealing, while those valuing a higher rating and recent market cap growth might consider Marvell’s profile, albeit with caution due to its declining profitability and value destruction signals.
Disclaimer: Investment carries a risk of loss of initial capital. The past performance is not a reliable indicator of future results. Be sure to understand risks before making an investment decision.
Go Further
I encourage you to read the complete analyses of Marvell Technology, Inc. and ON Semiconductor Corporation to enhance your investment decisions: