Home > Comparison > Technology > MRVL vs NXPI
The strategic rivalry between Marvell Technology, Inc. and NXP Semiconductors N.V. shapes the semiconductor sector’s competitive landscape. Marvell operates as a specialized designer of mixed-signal and embedded integrated circuits, focusing on Ethernet and storage solutions. NXP, by contrast, offers a broad portfolio including microcontrollers and wireless connectivity for automotive and IoT. This analysis evaluates which company’s operational model delivers a superior risk-adjusted return for a diversified portfolio.
Table of contents
Companies Overview
Marvell Technology and NXP Semiconductors both hold pivotal roles in the global semiconductor market, influencing diverse technology sectors.
Marvell Technology, Inc.: Integrated Circuit Innovator
Marvell Technology leads in analog, mixed-signal, and digital signal processing ICs. Its revenue stems from Ethernet controllers, storage solutions, and network adapters. In 2026, Marvell emphasizes expanding its portfolio in storage controllers and networking products to enhance data infrastructure performance and connectivity.
NXP Semiconductors N.V.: Connectivity and Sensor Specialist
NXP Semiconductors dominates through a diverse lineup of microcontrollers, processors, and wireless connectivity solutions. It generates revenue primarily from automotive, industrial IoT, and communication applications. The company’s 2026 strategy focuses on advancing automotive electronics and secure connectivity technologies to capitalize on evolving smart vehicle and IoT demands.
Strategic Collision: Similarities & Divergences
Both companies operate in semiconductors but diverge in focus: Marvell prioritizes storage and networking while NXP targets automotive and IoT connectivity. Their competitive battleground lies in embedded processing and communication chips. Marvell offers a specialized infrastructure play, whereas NXP provides a broad automotive and sensor-driven profile, reflecting distinct risk and growth dynamics.
Income Statement Comparison
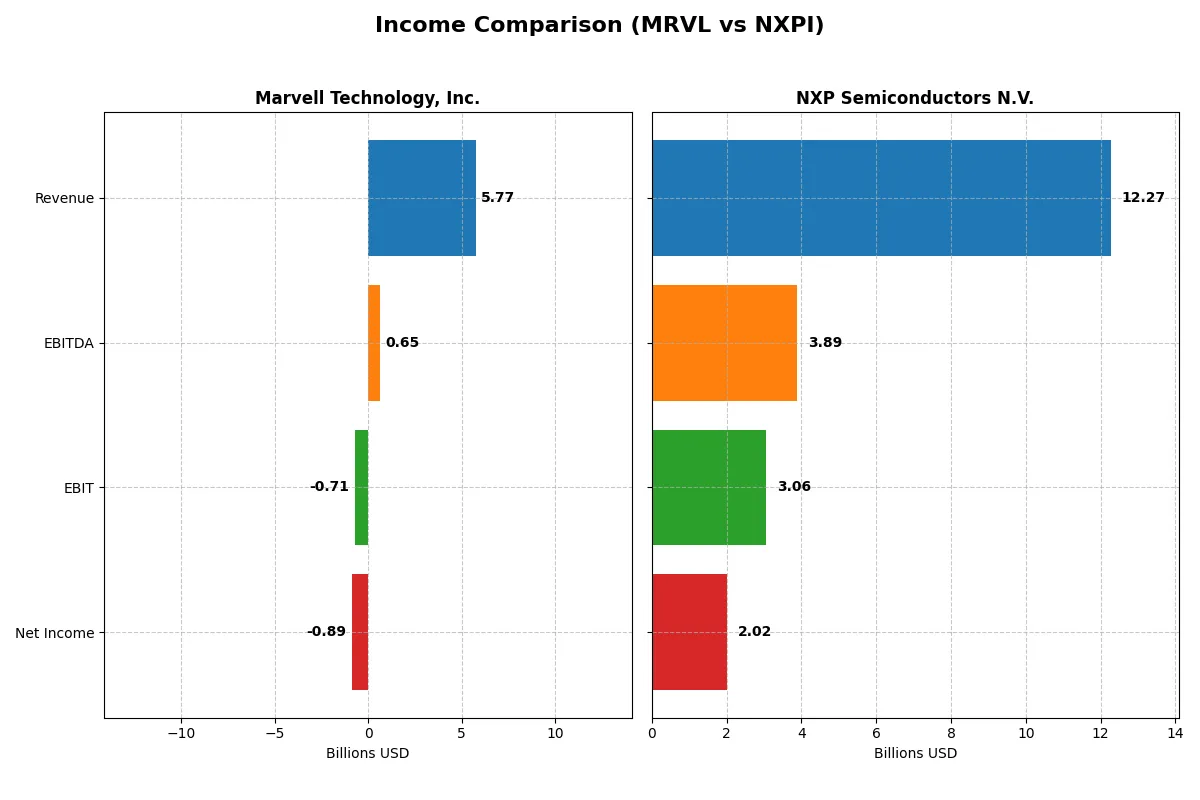
This data dissects the core profitability and scalability of both corporate engines to reveal who dominates the bottom line:
| Metric | Marvell Technology, Inc. (MRVL) | NXP Semiconductors N.V. (NXPI) |
|---|---|---|
| Revenue | 5.77B | 12.27B |
| Cost of Revenue | 3.39B | 5.59B |
| Operating Expenses | 3.10B | 3.37B |
| Gross Profit | 2.38B | 6.68B |
| EBITDA | 652M | 3.89B |
| EBIT | -705M | 3.06B |
| Interest Expense | 189M | 384M |
| Net Income | -885M | 2.02B |
| EPS | -1.02 | 8.00 |
| Fiscal Year | 2025 | 2025 |
Income Statement Analysis: The Bottom-Line Duel
This income statement comparison exposes the true operational efficiency and profitability of each company’s business model over recent years.
Marvell Technology, Inc. Analysis
Marvell’s revenue climbed steadily from 3B in 2021 to 5.77B in 2025, reflecting a 94% growth over five years. However, net income remained negative, widening to -885M in 2025. Despite maintaining a solid gross margin near 41%, Marvell’s net margin stayed deeply negative at -15%, showing ongoing struggles to convert sales into profit.
NXP Semiconductors N.V. Analysis
NXP’s revenue rose modestly from 11B in 2021 to 12.3B in 2025, with a slight 11% growth over five years. Net income grew to 2B in 2025, supporting a healthy net margin of 16.5%. The company sustains a robust gross margin above 54% and consistently positive EBIT margins near 25%, highlighting strong profitability and operational control.
Margin Strength vs. Profitability Consistency
NXP dominates with superior margins and positive net income, whereas Marvell shows impressive top-line growth but persistent losses. NXP’s consistent profitability and margin health make it the fundamental winner. For investors, NXP’s profile offers reliable earnings, while Marvell remains a riskier growth play.
Financial Ratios Comparison
These vital ratios act as a diagnostic tool to expose the underlying fiscal health, valuation premiums, and capital efficiency of the companies compared:
| Ratios | Marvell Technology, Inc. (MRVL) | NXP Semiconductors N.V. (NXPI) |
|---|---|---|
| ROE | -6.6% | 27.3% |
| ROIC | -3.9% | 12.9% |
| P/E | -110.4 | 21.1 |
| P/B | 7.27 | 5.78 |
| Current Ratio | 1.54 | 2.36 |
| Quick Ratio | 1.03 | 1.60 |
| D/E (Debt-to-Equity) | 0.32 | 1.18 |
| Debt-to-Assets | 21.5% | 44.5% |
| Interest Coverage | -3.80 | 8.59 |
| Asset Turnover | 0.29 | 0.52 |
| Fixed Asset Turnover | 5.56 | 3.86 |
| Payout ratio | -23.4% | 41.4% |
| Dividend yield | 0.21% | 1.96% |
| Fiscal Year | 2025 | 2024 |
Efficiency & Valuation Duel: The Vital Signs
Financial ratios act as a company’s DNA, revealing hidden risks and operational excellence crucial for discerning investors.
Marvell Technology, Inc.
Marvell exhibits weak profitability with a negative ROE of -6.59% and a net margin of -15.35%, signaling operational challenges. Its valuation appears stretched, with a high PB ratio of 7.27 despite a negative P/E. Shareholder returns remain minimal, relying slightly on a 0.21% dividend yield amid reinvestment in R&D.
NXP Semiconductors N.V.
NXP shows robust profitability, boasting a strong ROE of 27.33% and a solid net margin of 19.9%. The stock trades at a neutral P/E of 21.13 and a high PB of 5.78, indicating moderate valuation risk. It balances shareholder returns with a 1.96% dividend yield and sustained growth investments.
Profitability Strength vs. Valuation Discipline
NXP offers superior profitability and a more balanced risk-reward profile compared to Marvell’s stretched valuation and operational weaknesses. Investors favoring stability and income may lean toward NXP, while those seeking turnaround opportunities might consider Marvell’s riskier profile.
Which one offers the Superior Shareholder Reward?
I observe Marvell Technology (MRVL) pays a minimal dividend yield around 0.2% with a negative payout ratio, signaling dividend inconsistency. Its buyback activity is unclear, reducing total shareholder return clarity. NXP Semiconductors (NXPI) offers a robust 1.7–2.0% dividend yield with a sustainable payout ratio near 30–40%. NXPI’s significant buybacks alongside steady free cash flow coverage boost total returns. I find NXPI’s distribution model more balanced and sustainable, combining dividends and buybacks effectively. Hence, for 2026, NXPI presents a superior total shareholder reward profile compared to MRVL.
Comparative Score Analysis: The Strategic Profile
The radar chart reveals the core financial DNA and strategic trade-offs of Marvell Technology and NXP Semiconductors, highlighting their distinct competitive strengths:
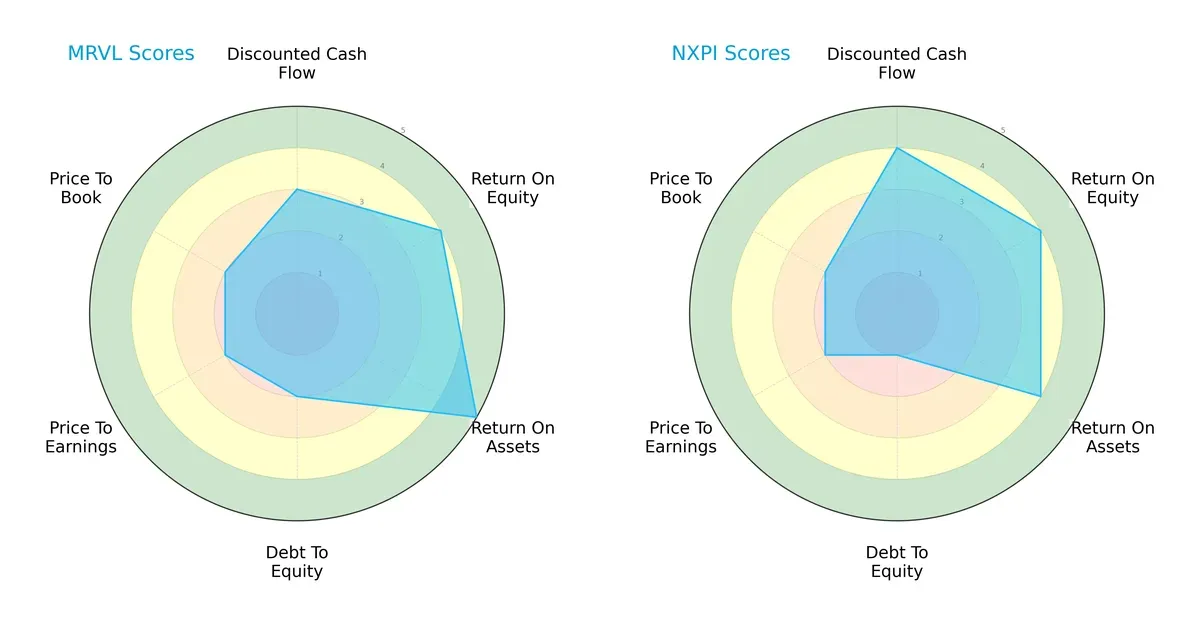
Marvell shows a pronounced edge in asset efficiency with a top ROA score of 5 versus NXP’s 4. NXP leads slightly in discounted cash flow valuation (4 vs. 3), signaling better future cash flow expectations. Both firms tie on ROE (4) and valuation metrics (P/E and P/B at 2 each). Marvell’s moderate debt-to-equity score (2) contrasts with NXP’s weaker balance sheet (1), indicating Marvell’s more balanced financial profile. NXP relies on its DCF strength but carries higher financial risk.
Bankruptcy Risk: Solvency Showdown
Marvell’s Altman Z-Score at 6.8 significantly outperforms NXP’s 3.18, placing both in the safe zone but with a clear solvency buffer advantage for Marvell:
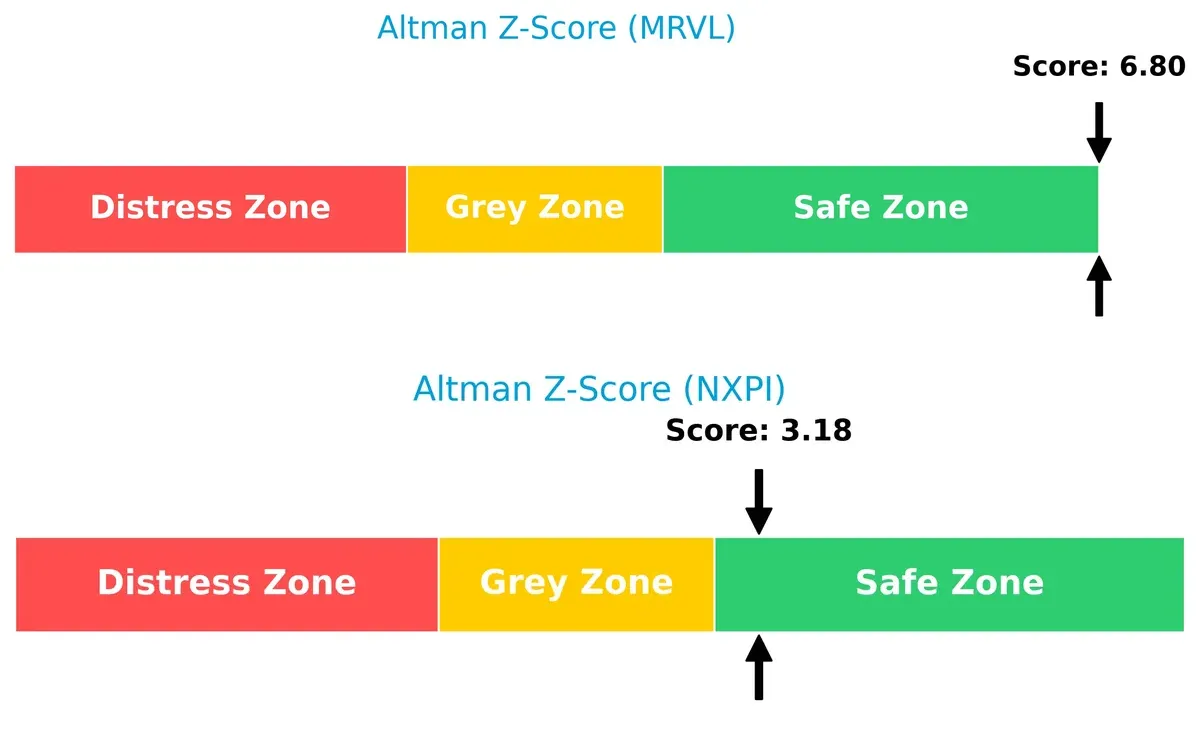
This gap signals Marvell’s stronger resilience against economic downturns and lower bankruptcy risk. NXP’s score, while safe, suggests less cushion in volatile markets.
Financial Health: Quality of Operations
Marvell’s Piotroski F-Score of 7 indicates strong operational health compared to NXP’s average 6, pointing to fewer internal red flags:
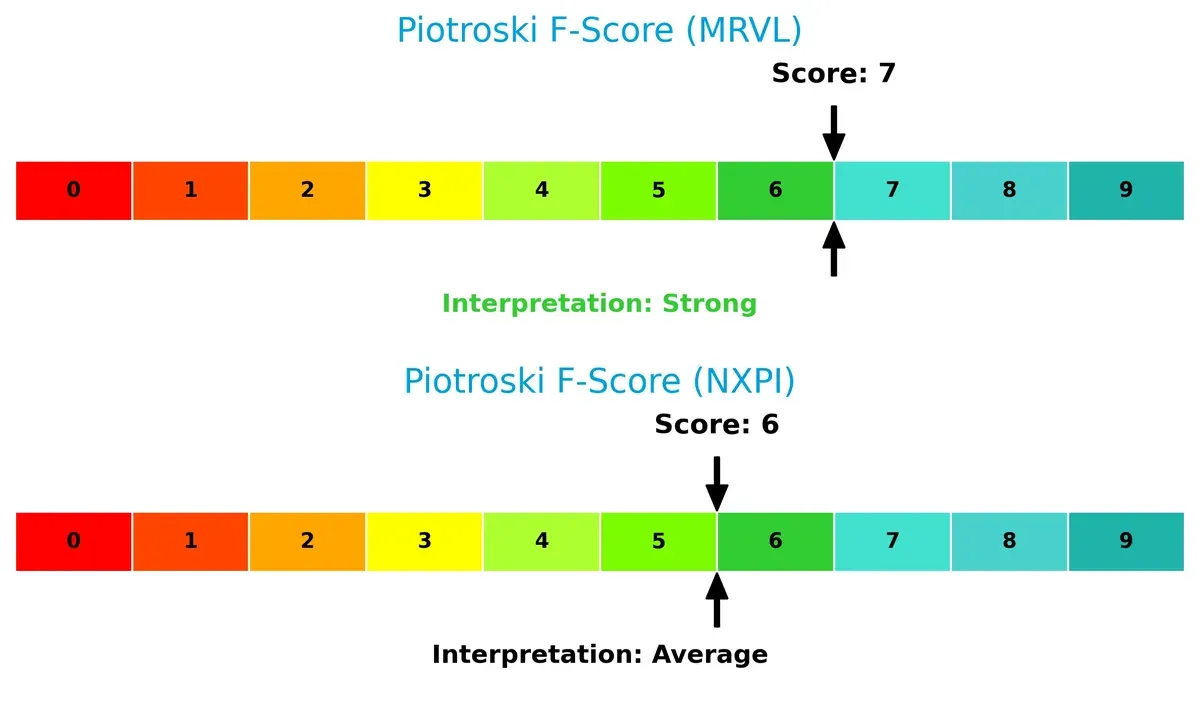
Marvell’s higher score reflects more consistent profitability, liquidity, and efficiency metrics. NXP’s lower score calls for cautious monitoring of its internal financial dynamics relative to Marvell.
How are the two companies positioned?
This section dissects the operational DNA of Marvell and NXP by comparing their revenue distribution by segment alongside their internal strengths and weaknesses. The ultimate aim is to confront their economic moats and identify which model offers the most resilient and sustainable competitive advantage today.
Revenue Segmentation: The Strategic Mix
The following visual comparison dissects how Marvell Technology and NXP Semiconductors diversify their income streams and where their primary sector bets lie:
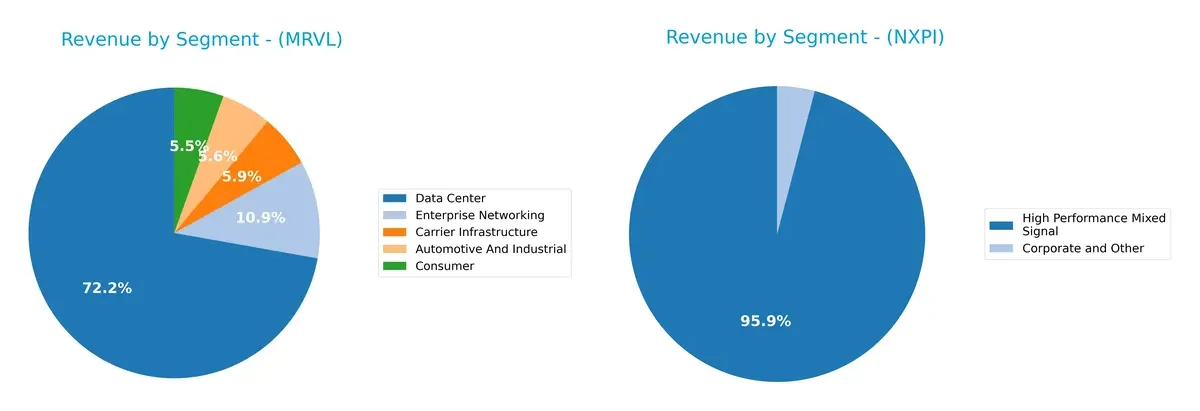
Marvell Technology anchors its revenue in Data Center with $4.16B in 2025, dwarfing other segments like Enterprise Networking ($626M) and Carrier Infrastructure ($338M). This concentration signals strong infrastructure dominance but raises concentration risk. Conversely, NXP Semiconductors pivots almost entirely on High Performance Mixed Signal, generating $9.02B in 2018, showing less diversification but a focused moat in mixed-signal technology. Marvell’s broader mix suggests ecosystem lock-in, while NXP’s reliance demands vigilance on segment cyclicality.
Strengths and Weaknesses Comparison
This table compares the strengths and weaknesses of Marvell Technology, Inc. and NXP Semiconductors N.V.:
Marvell Technology Strengths
- Diversified revenue across Automotive, Data Center, Consumer, and Networking sectors
- Strong current and quick ratios indicate solid short-term liquidity
- Low debt-to-equity and debt-to-assets ratios reflect conservative leverage
NXP Semiconductors Strengths
- High profitability with strong net margin, ROE, and ROIC
- Favorable interest coverage shows ease in meeting debt costs
- Robust global presence including China, US, Germany, and Japan
Marvell Technology Weaknesses
- Negative profitability metrics including net margin, ROE, and ROIC
- Unfavorable asset turnover limits operational efficiency
- Negative interest coverage signals financial strain
- High price-to-book ratio may imply overvaluation
NXP Semiconductors Weaknesses
- Elevated debt-to-equity ratio indicates higher leverage risk
- Unfavorable price-to-book ratio suggests market concerns
- Asset turnover considered neutral, not maximizing assets fully
Marvell shows broad diversification and strong liquidity but struggles with profitability and efficiency. NXP delivers superior profitability and global reach but carries higher leverage and valuation risks. These profiles highlight distinct strategic challenges for each company.
The Moat Duel: Analyzing Competitive Defensibility
A structural moat alone preserves long-term profits from relentless competitive pressure. Let’s dissect the core moats of these semiconductor peers:
Marvell Technology, Inc.: Struggling Cost Advantage
Marvell relies on cost advantages in Ethernet and storage controllers. However, a declining ROIC and negative margins signal weakening profitability in 2026, threatening its moat’s durability.
NXP Semiconductors N.V.: Expanding Network Effects
NXP leverages diverse product lines and strong automotive and IoT network effects. Its growing ROIC and solid margins reflect a widening moat, with new applications poised to reinforce competitive strength.
Cost Efficiency vs. Network Effects: The Moat Verdict
NXP’s expanding network effects forge a deeper moat than Marvell’s eroding cost advantage. NXP is better positioned to defend market share amid intensifying semiconductor competition.
Which stock offers better returns?
The past year saw Marvell Technology’s price rise sharply before slowing, while NXP Semiconductors faced a general decline with recent strong recovery momentum.
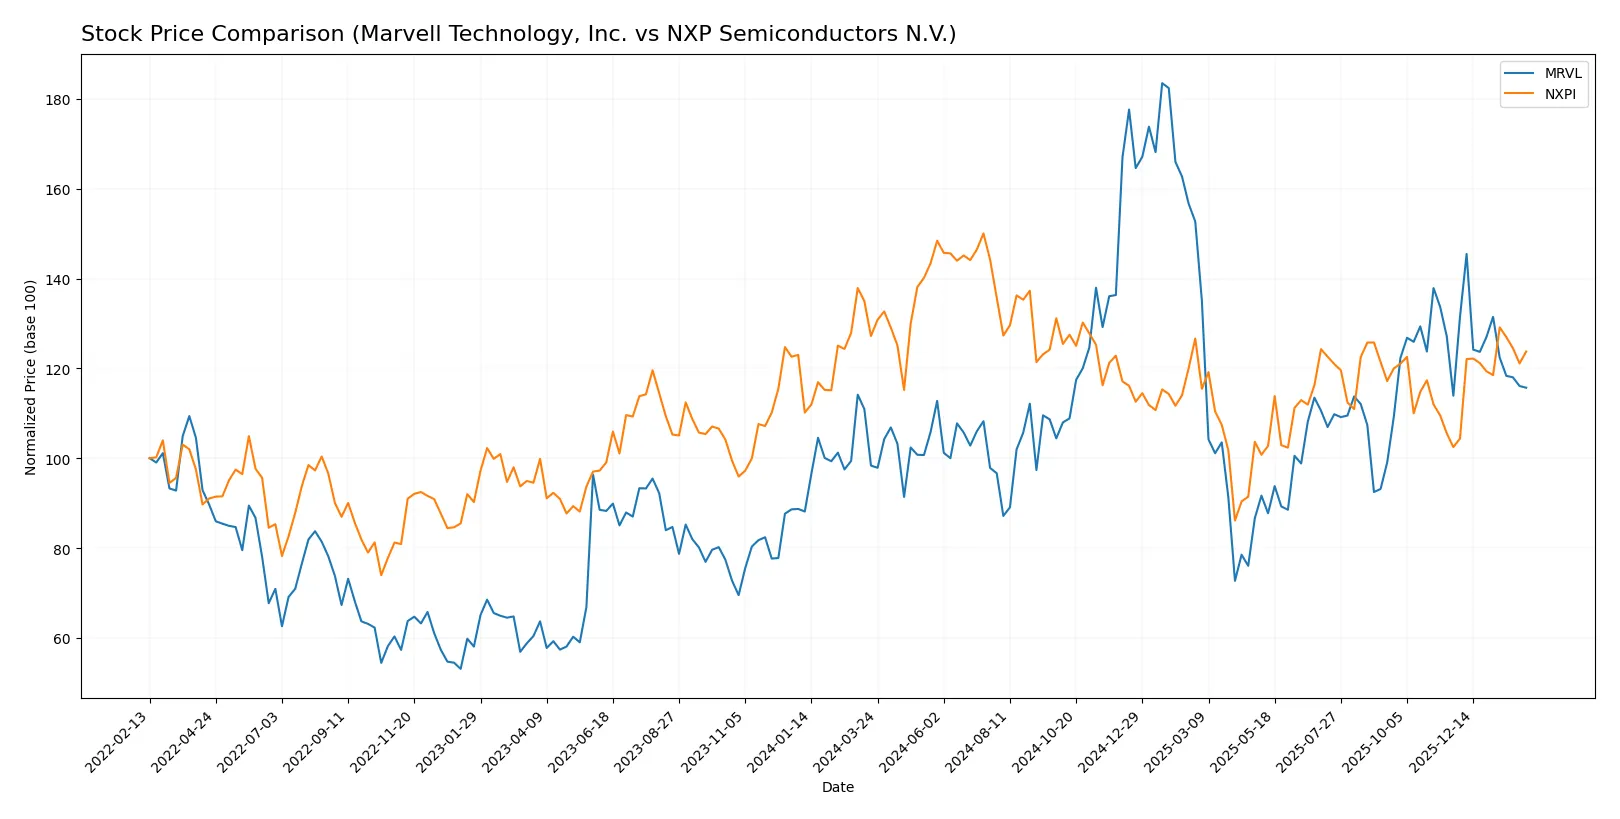
Trend Comparison
Marvell Technology’s stock rose 17.63% over the past year, indicating a bullish trend with deceleration. Its price ranged from 49.43 to 124.76, showing notable volatility.
NXP Semiconductors declined 2.72% over the year, marking a bearish trend but with accelerating recovery recently. Price fluctuated between 160.81 and 280.19, reflecting higher volatility.
Marvell outperformed NXP over the year, delivering the highest market return despite slowing momentum versus NXP’s late rebound.
Target Prices
Analysts present a bullish consensus for Marvell Technology and NXP Semiconductors with solid upside potential.
| Company | Target Low | Target High | Consensus |
|---|---|---|---|
| Marvell Technology, Inc. | 80 | 156 | 117 |
| NXP Semiconductors N.V. | 215 | 280 | 242.5 |
The consensus target prices for Marvell and NXP imply 49% and 5% upside from current prices, respectively, signaling strong growth expectations.

Don’t Let Luck Decide Your Entry Point
Optimize your entry points with our advanced ProRealTime indicators. You’ll get efficient buy signals with precise price targets for maximum performance. Start outperforming now!
How do institutions grade them?
Here is a comparison of the latest institutional grades for Marvell Technology, Inc. and NXP Semiconductors N.V.:
Marvell Technology, Inc. Grades
The table below summarizes recent grades from reputable institutions for Marvell Technology, Inc.:
| Grading Company | Action | New Grade | Date |
|---|---|---|---|
| Rosenblatt | Maintain | Buy | 2026-01-07 |
| Melius Research | Upgrade | Buy | 2026-01-05 |
| Benchmark | Downgrade | Hold | 2025-12-08 |
| JP Morgan | Maintain | Overweight | 2025-12-03 |
| Rosenblatt | Maintain | Buy | 2025-12-03 |
| Roth Capital | Maintain | Buy | 2025-12-03 |
| Oppenheimer | Maintain | Outperform | 2025-12-03 |
| B. Riley Securities | Maintain | Buy | 2025-12-03 |
| Wells Fargo | Maintain | Overweight | 2025-12-03 |
| Susquehanna | Maintain | Positive | 2025-12-03 |
NXP Semiconductors N.V. Grades
The table below summarizes recent grades from reputable institutions for NXP Semiconductors N.V.:
| Grading Company | Action | New Grade | Date |
|---|---|---|---|
| Wells Fargo | Maintain | Overweight | 2026-01-15 |
| Citigroup | Maintain | Buy | 2026-01-15 |
| Truist Securities | Maintain | Buy | 2025-12-19 |
| JP Morgan | Maintain | Neutral | 2025-10-29 |
| Truist Securities | Maintain | Buy | 2025-10-29 |
| Wells Fargo | Maintain | Overweight | 2025-07-23 |
| Truist Securities | Maintain | Buy | 2025-07-23 |
| Susquehanna | Maintain | Neutral | 2025-07-23 |
| JP Morgan | Maintain | Neutral | 2025-07-23 |
| Barclays | Maintain | Overweight | 2025-07-22 |
Which company has the best grades?
Marvell Technology, Inc. receives mostly Buy and Overweight ratings, including an Outperform, indicating stronger institutional confidence. NXP Semiconductors N.V. holds steady Buy and Overweight grades but also Neutral ratings. Marvell’s higher grades suggest more optimistic analyst sentiment, potentially influencing investor confidence positively.
Risks specific to each company
The following categories identify critical pressure points and systemic threats facing Marvell Technology, Inc. and NXP Semiconductors N.V. in the 2026 market environment:
1. Market & Competition
Marvell Technology, Inc.
- Faces fierce competition with a beta of 1.98, indicating high sensitivity to market swings.
NXP Semiconductors N.V.
- Lower beta of 1.46 shows less volatility, but competition remains intense in automotive and IoT sectors.
2. Capital Structure & Debt
Marvell Technology, Inc.
- Maintains conservative leverage with debt-to-equity ratio of 0.32 and debt-to-assets at 21.5%.
NXP Semiconductors N.V.
- Higher leverage with debt-to-equity of 1.18 and debt-to-assets at 44.5%, increasing financial risk.
3. Stock Volatility
Marvell Technology, Inc.
- Exhibits wide trading range $47.09–121.81 and high beta suggests significant price swings.
NXP Semiconductors N.V.
- Trades in a narrower range $148.09–255.45 with lower beta, implying more stable price behavior.
4. Regulatory & Legal
Marvell Technology, Inc.
- Exposed to US-China tech tensions affecting supply and sales in Asian markets.
NXP Semiconductors N.V.
- Faces complex EU and global regulations, especially in automotive and wireless communication sectors.
5. Supply Chain & Operations
Marvell Technology, Inc.
- Operations span multiple Asian countries, risking disruption from regional geopolitical instability.
NXP Semiconductors N.V.
- Also highly globalized with exposure to semiconductor material shortages and supply delays.
6. ESG & Climate Transition
Marvell Technology, Inc.
- Limited disclosed ESG metrics; pressure to improve sustainability amid investor scrutiny.
NXP Semiconductors N.V.
- Larger workforce and footprint bring greater ESG challenges, but also more structured programs.
7. Geopolitical Exposure
Marvell Technology, Inc.
- Significant exposure to US-China trade disputes and tariffs.
NXP Semiconductors N.V.
- European headquarters buffers some risk, but global operations remain vulnerable to geopolitical shifts.
Which company shows a better risk-adjusted profile?
Marvell’s most critical risk is its negative profitability and weak interest coverage, signaling operational and financial strain. NXP’s leverage and regulatory complexity pose the greatest threats but benefit from stronger profitability and liquidity. NXP’s safer Altman Z-score of 3.18 versus Marvell’s 6.8 indicates financial stability, yet Marvell’s superior Piotroski score of 7 reflects better operational health. Overall, NXP presents a more balanced risk-adjusted profile supported by robust margins and cash flow, while Marvell requires caution due to profitability headwinds and market volatility.
Final Verdict: Which stock to choose?
Marvell Technology’s superpower lies in its relentless investment in R&D, fueling innovation in a competitive semiconductor landscape. However, its ongoing value destruction and weak profitability metrics remain points of vigilance. It suits investors with a high tolerance for risk and a focus on aggressive growth potential.
NXP Semiconductors commands a durable moat through its efficient capital use and consistent value creation, underpinned by solid profitability and a strong balance sheet. It offers better stability than Marvell, fitting well into portfolios seeking growth at a reasonable price with an emphasis on quality.
If you prioritize cutting-edge innovation and are willing to accept volatile returns, Marvell could be compelling despite its financial challenges. However, if you seek established profitability and a durable competitive advantage, NXP outshines as the more stable choice, commanding a premium for its superior capital efficiency and resilience.
Disclaimer: Investment carries a risk of loss of initial capital. The past performance is not a reliable indicator of future results. Be sure to understand risks before making an investment decision.
Go Further
I encourage you to read the complete analyses of Marvell Technology, Inc. and NXP Semiconductors N.V. to enhance your investment decisions: