NVIDIA Corporation and Marvell Technology, Inc. are two prominent players in the semiconductor industry, each driving innovation in high-performance computing and networking solutions. While NVIDIA leads with cutting-edge graphics and AI technologies, Marvell focuses on advanced integrated circuits and storage connectivity. This comparison explores their market positioning and growth strategies to help you decide which company holds the most promise for your investment portfolio. Let’s uncover which stock stands out for investors today.
Table of contents
Companies Overview
I will begin the comparison between NVIDIA and Marvell Technology by providing an overview of these two companies and their main differences.
NVIDIA Overview
NVIDIA Corporation focuses on delivering graphics, compute, and networking solutions globally, including GPUs for gaming, data centers, and automotive applications. Established in 1993 and headquartered in Santa Clara, California, NVIDIA serves diverse markets such as gaming, professional visualization, and autonomous vehicles, positioning itself as a leader in AI and accelerated computing technologies.
Marvell Technology Overview
Marvell Technology, Inc. designs and sells integrated circuits, including Ethernet solutions, storage controllers, and processors. Founded in 1995 and based in Wilmington, Delaware, Marvell operates internationally across multiple Asian countries. It targets the semiconductor market with products supporting data connectivity and storage for servers, enterprise, and consumer devices.
Key similarities and differences
Both companies operate in the semiconductor industry, focusing on advanced hardware solutions, but NVIDIA emphasizes GPUs and AI-driven platforms, while Marvell concentrates on Ethernet, storage, and mixed-signal integrated circuits. NVIDIA is significantly larger with a market cap above 4.4T and over 36K employees, whereas Marvell has a market cap near 70B and about 7K employees, reflecting their different scales and market reach.
Income Statement Comparison
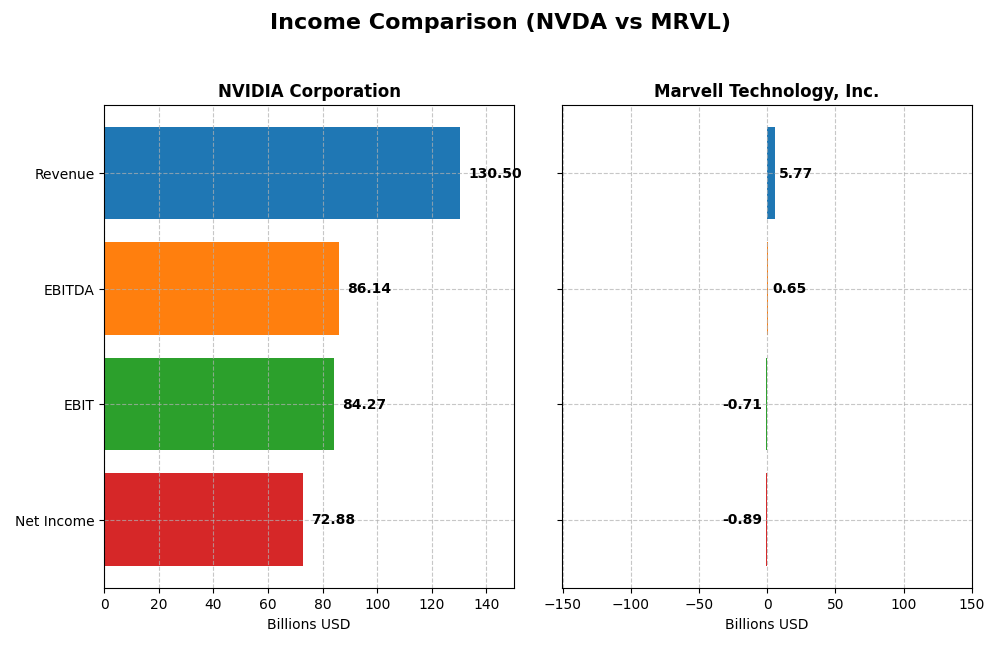
The table below compares key income statement metrics for NVIDIA Corporation and Marvell Technology, Inc. for the fiscal year 2025, providing a snapshot of their financial performance.
| Metric | NVIDIA Corporation | Marvell Technology, Inc. |
|---|---|---|
| Market Cap | 4.46T | 70.0B |
| Revenue | 130.5B | 5.77B |
| EBITDA | 86.1B | 652M |
| EBIT | 84.3B | -705M |
| Net Income | 72.9B | -885M |
| EPS | 2.97 | -1.02 |
| Fiscal Year | 2025 | 2025 |
Income Statement Interpretations
NVIDIA Corporation
NVIDIA’s revenue surged from $16.7B in 2021 to $130.5B in 2025, with net income rising sharply from $4.3B to $72.9B. Gross and net margins improved significantly, reaching 75% and 56%, respectively, in 2025. The latest year saw exceptional growth, with revenue and earnings more than doubling, reflecting strong operational leverage and margin expansion.
Marvell Technology, Inc.
Marvell’s revenue grew steadily from $3B in 2021 to $5.8B in 2025, but net income remained negative, hitting -$885M in 2025. The gross margin held at a favorable 41%, yet EBIT and net margins stayed negative, indicating ongoing profitability challenges. The most recent year showed modest revenue growth but a decline in EBIT, signaling operational pressures.
Which one has the stronger fundamentals?
NVIDIA demonstrates robust fundamentals with strong revenue and net income growth alongside improving margins, all rated favorable. Conversely, Marvell faces profitability issues despite revenue growth, with negative EBIT and net margins and an overall unfavorable income statement evaluation. Based on these income statement factors, NVIDIA exhibits more favorable financial health.
Financial Ratios Comparison
The table below presents the most recent fiscal year financial ratios for NVIDIA Corporation and Marvell Technology, Inc., facilitating a direct comparison of key performance and financial health metrics.
| Ratios | NVIDIA Corporation (NVDA) | Marvell Technology, Inc. (MRVL) |
|---|---|---|
| ROE | 91.87% | -6.59% |
| ROIC | 75.28% | -3.88% |
| P/E | 39.90 | -110.37 |
| P/B | 36.66 | 7.27 |
| Current Ratio | 4.44 | 1.54 |
| Quick Ratio | 3.88 | 1.03 |
| D/E (Debt to Equity) | 0.13 | 0.32 |
| Debt-to-Assets | 9.20% | 21.50% |
| Interest Coverage | 330.0x | -3.80x |
| Asset Turnover | 1.17 | 0.29 |
| Fixed Asset Turnover | 16.16 | 5.56 |
| Payout Ratio | 1.14% | -23.45% |
| Dividend Yield | 0.03% | 0.21% |
Interpretation of the Ratios
NVIDIA Corporation
NVIDIA shows predominantly strong ratios with a net margin of 55.85%, ROE at 91.87%, and ROIC at 75.28%, indicating high profitability and efficient capital use. Some unfavorable ratios include a high P/E of 39.9 and a current ratio of 4.44, suggesting valuation concerns and liquidity management. The company pays dividends with a low 0.03% yield, reflecting modest shareholder returns and cautious payout.
Marvell Technology, Inc.
Marvell’s ratios reveal weakness, with a negative net margin of -15.35%, negative ROE of -6.59%, and negative ROIC of -3.88%, signaling unprofitability and capital inefficiency. Favorable liquidity ratios like a current ratio of 1.54 contrast with poor interest coverage at -3.72. Marvell pays dividends with a 0.21% yield despite losses, which may raise sustainability questions for shareholders.
Which one has the best ratios?
NVIDIA’s ratios are generally favorable, highlighting strong profitability and capital efficiency despite some valuation and liquidity concerns. In contrast, Marvell’s ratios are mostly unfavorable, with losses and negative returns overshadowing its limited strengths. Overall, NVIDIA demonstrates more robust financial health based on the available ratio analysis.
Strategic Positioning
This section compares the strategic positioning of NVIDIA Corporation and Marvell Technology, Inc. regarding market position, key segments, and exposure to technological disruption:
NVIDIA Corporation
- Dominates semiconductor industry with large market cap and high beta, facing strong competitive pressure.
- Key segments include Data Center ($115B), Gaming ($11B), Automotive ($1.7B), and Professional Visualization.
- Exposure through AI, HPC, autonomous driving platforms, and cloud-based computing, indicating high technological disruption risk.
Marvell Technology, Inc.
- Smaller market cap with moderate beta, competing in diverse semiconductor niches.
- Focuses on Data Center ($4.2B), Enterprise Networking, Carrier Infrastructure, and Automotive & Industrial segments.
- Exposure mainly in Ethernet, storage controllers, and processors, facing moderate technological disruption.
NVIDIA Corporation vs Marvell Technology Positioning
NVIDIA shows a highly diversified segment portfolio with dominant data center and gaming revenues, benefiting from advanced AI and autonomous tech. Marvell is more concentrated in networking and storage, with smaller scale but diversified across infrastructure and industrial applications.
Which has the best competitive advantage?
NVIDIA demonstrates a very favorable economic moat with growing ROIC and value creation, indicating durable competitive advantage. Marvell’s declining ROIC and value destruction indicate a very unfavorable moat and weaker competitive positioning.
Stock Comparison
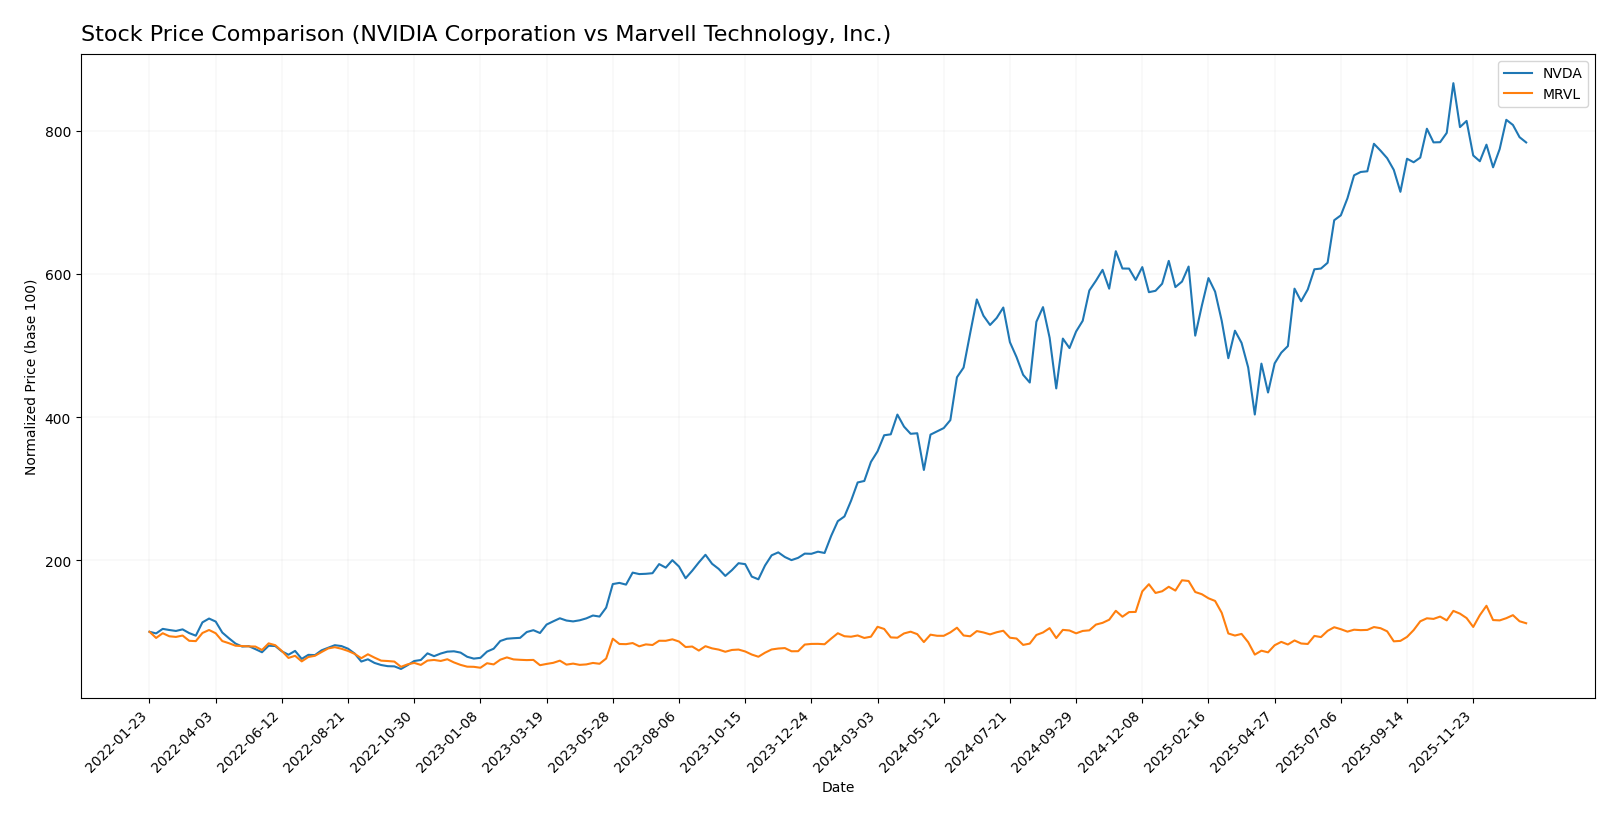
The stock price chart highlights significant bullish growth for NVIDIA Corporation and Marvell Technology, Inc. over the past year, with both experiencing recent downward corrections and shifting trading dynamics.
Trend Analysis
NVIDIA Corporation’s stock showed a strong bullish trend over the past 12 months with a 132.35% price increase but experienced a 9.56% decline recently, indicating a deceleration phase. The price ranged from 76.2 to 202.49 with high volatility (32.46 std deviation).
Marvell Technology, Inc. posted a bullish trend with a 20.17% gain over the past year but faced a 13.37% recent decline, also reflecting deceleration. Its price fluctuated between 49.43 and 124.76 with moderate volatility (16.46 std deviation).
Comparing the two, NVIDIA delivered substantially higher market performance over the past year despite recent pullbacks, outperforming Marvell in overall price appreciation.
Target Prices
Here is the current analyst target consensus for two leading semiconductor companies.
| Company | Target High | Target Low | Consensus |
|---|---|---|---|
| NVIDIA Corporation | 352 | 140 | 264.34 |
| Marvell Technology, Inc. | 156 | 80 | 117 |
Analysts expect NVIDIA’s stock to appreciate significantly from its current price of 183.14 USD, with a consensus target of 264.34 USD. Marvell’s consensus target of 117 USD also suggests potential upside from its 81.21 USD price, reflecting positive market sentiment.
Analyst Opinions Comparison
This section compares analysts’ ratings and grades for NVIDIA Corporation and Marvell Technology, Inc.:
Rating Comparison
NVIDIA Corporation Rating
- Rating: B+, considered Very Favorable by analysts.
- Discounted Cash Flow Score: 3, indicating a Moderate valuation.
- ROE Score: 5, Very Favorable, showing strong profit generation efficiency.
- ROA Score: 5, Very Favorable, demonstrating excellent asset utilization.
- Debt To Equity Score: 3, Moderate risk level.
- Overall Score: 3, Moderate overall financial standing.
Marvell Technology, Inc. Rating
- Rating: B+, considered Very Favorable by analysts.
- Discounted Cash Flow Score: 3, indicating a Moderate valuation.
- ROE Score: 4, Favorable, indicating good profit efficiency.
- ROA Score: 5, Very Favorable, demonstrating excellent asset utilization.
- Debt To Equity Score: 2, Moderate but slightly better balance sheet strength.
- Overall Score: 3, Moderate overall financial standing.
Which one is the best rated?
Both companies share the same overall rating of B+ and a moderate overall score of 3. NVIDIA excels with a higher ROE score of 5 versus Marvell’s 4, while Marvell has a slightly better debt-to-equity score at 2 compared to NVIDIA’s 3. Overall, their ratings are quite comparable.
Scores Comparison
Here is a comparison of the Altman Z-Score and Piotroski Score for NVIDIA and Marvell Technology:
NVIDIA Scores
- Altman Z-Score: 68.04, indicating a safe financial zone.
- Piotroski Score: 6, representing average financial strength.
Marvell Technology Scores
- Altman Z-Score: 6.76, also in the safe financial zone.
- Piotroski Score: 7, indicating strong financial health.
Which company has the best scores?
Marvell Technology shows a strong Piotroski Score of 7 compared to NVIDIA’s average 6, while both companies remain in the safe zone for Altman Z-Score, with NVIDIA’s score notably higher.
Grades Comparison
Here is a comparison of the latest reliable grades assigned to NVIDIA Corporation and Marvell Technology, Inc.:
NVIDIA Corporation Grades
The table below summarizes recent grades from reputable grading companies for NVIDIA Corporation:
| Grading Company | Action | New Grade | Date |
|---|---|---|---|
| Mizuho | Maintain | Outperform | 2026-01-09 |
| Truist Securities | Maintain | Buy | 2025-12-29 |
| Stifel | Maintain | Buy | 2025-12-29 |
| B of A Securities | Maintain | Buy | 2025-12-26 |
| Baird | Maintain | Outperform | 2025-12-26 |
| Bernstein | Maintain | Outperform | 2025-12-26 |
| Truist Securities | Maintain | Buy | 2025-12-19 |
| Tigress Financial | Maintain | Strong Buy | 2025-12-18 |
| Morgan Stanley | Maintain | Overweight | 2025-12-01 |
| Deutsche Bank | Maintain | Hold | 2025-11-20 |
NVIDIA’s grades consistently indicate a positive outlook, with numerous “Buy” and “Outperform” ratings and a notable “Strong Buy” from Tigress Financial.
Marvell Technology, Inc. Grades
The table below summarizes recent grades from reputable grading companies for Marvell Technology, Inc.:
| Grading Company | Action | New Grade | Date |
|---|---|---|---|
| Rosenblatt | Maintain | Buy | 2026-01-07 |
| Melius Research | Upgrade | Buy | 2026-01-05 |
| Benchmark | Downgrade | Hold | 2025-12-08 |
| B. Riley Securities | Maintain | Buy | 2025-12-03 |
| JP Morgan | Maintain | Overweight | 2025-12-03 |
| Susquehanna | Maintain | Positive | 2025-12-03 |
| Benchmark | Maintain | Buy | 2025-12-03 |
| Oppenheimer | Maintain | Outperform | 2025-12-03 |
| Stifel | Maintain | Buy | 2025-12-03 |
| Rosenblatt | Maintain | Buy | 2025-12-03 |
Marvell’s grades show a majority of “Buy” ratings with some upgrades and one recent downgrade to “Hold,” indicating a generally favorable but slightly more mixed view.
Which company has the best grades?
NVIDIA Corporation holds the stronger consensus with more frequent “Outperform” and “Strong Buy” ratings, suggesting higher confidence among analysts. Marvell Technology, Inc. shows solid “Buy” support but includes some downgrades, reflecting a more cautious stance. This difference may influence investor perceptions of risk and potential return.
Strengths and Weaknesses
Below is a comparison of key strengths and weaknesses of NVIDIA Corporation (NVDA) and Marvell Technology, Inc. (MRVL) based on the most recent financial and operational data.
| Criterion | NVIDIA Corporation (NVDA) | Marvell Technology, Inc. (MRVL) |
|---|---|---|
| Diversification | Strong diversification across Data Center (115B), Gaming (11.35B), Automotive (1.69B), and Professional Visualization segments | Moderate diversification with Data Center (4.16B), Enterprise Networking (626M), Automotive & Industrial (322M), Carrier Infrastructure, and Consumer segments |
| Profitability | Very high net margin (55.85%), ROIC 75.3%, and strong ROE (91.87%) indicating excellent profitability | Negative net margin (-15.35%), ROIC (-3.88%) and ROE (-6.59%) reflecting ongoing losses and weak profitability |
| Innovation | Very favorable moat with ROIC growing 339%, demonstrating durable competitive advantage and innovation leadership | Very unfavorable moat status with declining ROIC (-73%), suggesting challenges in sustaining innovation and competitive edge |
| Global presence | Strong global footprint supported by leadership in GPUs and AI chips | Global presence but less dominant, focused on specific networking and storage markets |
| Market share | Leading market share in GPUs and AI accelerators, especially in Data Center and Gaming | Smaller market share with niche focus on networking and storage chips |
NVIDIA clearly demonstrates superior profitability, innovation, and market leadership with broad product diversification and a very favorable economic moat. Marvell struggles with profitability and value creation despite reasonable diversification, indicating higher investment risk at this time.
Risk Analysis
Below is a comparison table outlining key risks for NVIDIA Corporation (NVDA) and Marvell Technology, Inc. (MRVL) based on the latest 2025 data.
| Metric | NVIDIA Corporation (NVDA) | Marvell Technology, Inc. (MRVL) |
|---|---|---|
| Market Risk | High beta 2.31, sensitive to tech sector volatility | Moderate beta 1.95, exposed to semiconductor cyclical trends |
| Debt level | Low debt-to-equity 0.13, debt/assets 9.2% (favorable) | Moderate debt-to-equity 0.32, debt/assets 21.5% (favorable but higher leverage) |
| Regulatory Risk | Moderate, global operations include US, China, Taiwan | Moderate, operates extensively in Asia and US, subject to export controls |
| Operational Risk | High complexity in GPU and AI product lines, strong innovation required | Moderate complexity in networking and storage chips, integration challenges |
| Environmental Risk | Moderate, semiconductor manufacturing impact, sustainability initiatives ongoing | Moderate, similar industry environmental footprint, focused on efficiency |
| Geopolitical Risk | Elevated due to US-China tensions affecting supply chains | Elevated, with significant operations and sales in Asia amid trade uncertainties |
NVIDIA faces higher market risk due to its larger scale and beta, but maintains a strong balance sheet with low debt. Marvell, while also exposed to geopolitical and regulatory pressures, shows weaker profitability and higher leverage, making operational and financial risks more impactful. Investors should weigh NVIDIA’s innovation-driven growth against Marvell’s current financial challenges.
Which Stock to Choose?
NVIDIA Corporation (NVDA) exhibits a strong income evolution with a 114.2% revenue growth in the past year and a favorable global income statement opinion. Its financial ratios are mostly favorable, showing high profitability with a 55.85% net margin, low debt, and a very favorable rating of B+. The company demonstrates a very favorable moat with ROIC substantially exceeding WACC and a growing trend in profitability.
Marvell Technology, Inc. (MRVL) shows moderate income growth with only 4.71% revenue increase recently and an unfavorable global income statement opinion due to negative margins and declining profitability. Financial ratios are largely unfavorable, with negative net margin and ROE, but some favorable liquidity ratios and a moderate rating of B+. The company’s moat evaluation is very unfavorable, indicating value destruction with ROIC below WACC and declining returns.
Investors focused on growth and seeking durable competitive advantages might find NVIDIA’s strong profitability and improving income statement more appealing, while those with a tolerance for risk and interest in turnaround potential could see Marvell’s current valuation and liquidity as factors worth monitoring. Ultimately, the choice could depend on an investor’s preference for stability versus speculative opportunity.
Disclaimer: Investment carries a risk of loss of initial capital. The past performance is not a reliable indicator of future results. Be sure to understand risks before making an investment decision.
Go Further
I encourage you to read the complete analyses of NVIDIA Corporation and Marvell Technology, Inc. to enhance your investment decisions: