Home > Comparison > Technology > MRVL vs NVEC
The strategic rivalry between Marvell Technology, Inc. and NVE Corporation shapes the semiconductor sector’s innovation landscape. Marvell operates as a capital-intensive giant, delivering broad integrated circuits and storage solutions. NVE, by contrast, specializes in spintronics, focusing on niche sensors with high technological barriers. This analysis pits scale against specialization to uncover which path offers a superior risk-adjusted return for diversified portfolios navigating technology’s evolving frontier.
Table of contents
Companies Overview
Marvell Technology and NVE Corporation lead distinct niches within the semiconductor industry, shaping key technological frontiers.
Marvell Technology, Inc.: Ethernet and Storage Powerhouse
Marvell Technology, Inc. dominates the semiconductor market with a broad suite of integrated circuits. Its core revenue stems from Ethernet solutions, storage controllers, and processors. In 2026, Marvell sharpens its focus on advancing network infrastructure and data storage technologies, leveraging global operations to sustain its competitive edge.
NVE Corporation: Spintronic Innovator
NVE Corporation specializes in spintronics-based sensors and couplers, catering mainly to factory automation and medical device sectors. It generates revenue through innovative spintronic products and R&D contracts. In 2026, NVE emphasizes expanding applications in industrial IoT and medical technologies, maintaining its niche leadership despite a small workforce.
Strategic Collision: Similarities & Divergences
Marvell pursues a broad, diversified semiconductor strategy, while NVE targets specialized spintronic tech, reflecting a classic scale versus innovation trade-off. Both compete indirectly in industrial automation markets but from different technological angles. Marvell offers scale and breadth; NVE delivers niche innovation, creating divergent risk and growth profiles for investors.
Income Statement Comparison
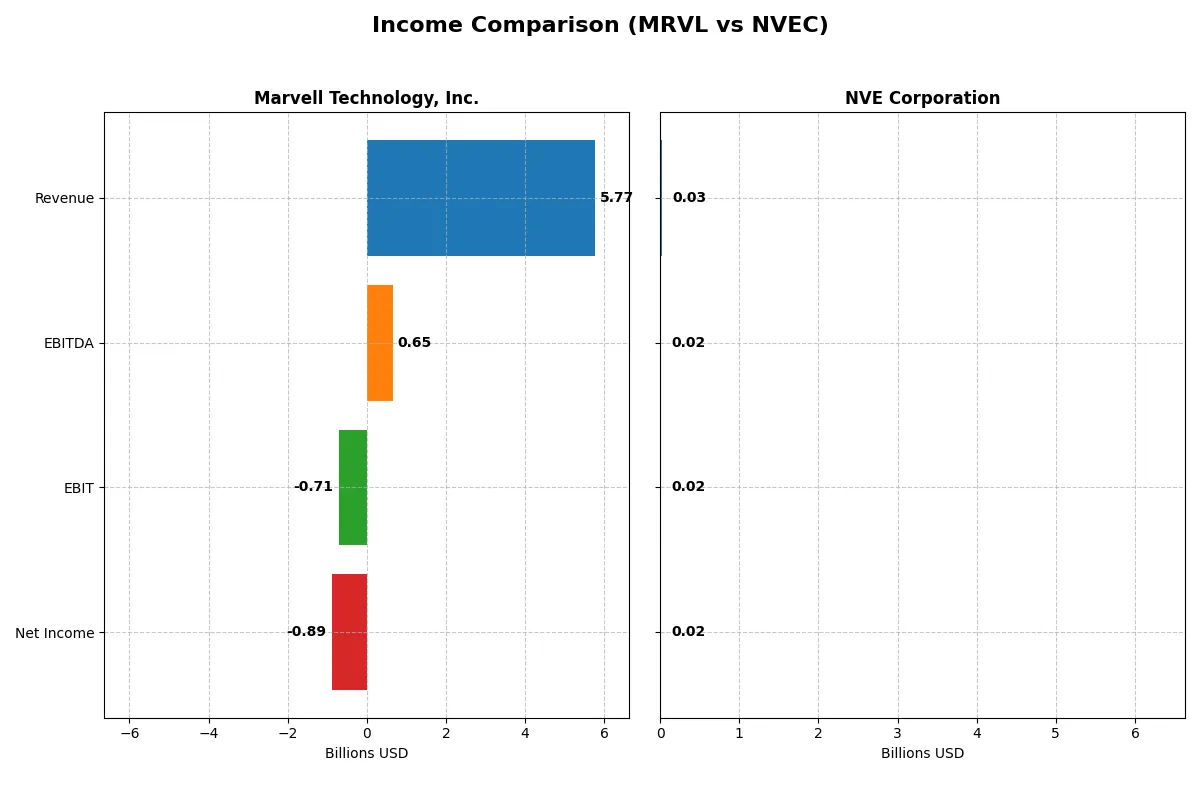
This data dissects the core profitability and scalability of both corporate engines to reveal who dominates the bottom line:
| Metric | Marvell Technology, Inc. (MRVL) | NVE Corporation (NVEC) |
|---|---|---|
| Revenue | 5.77B | 25.9M |
| Cost of Revenue | 3.39B | 4.24M |
| Operating Expenses | 3.10B | 5.64M |
| Gross Profit | 2.38B | 21.6M |
| EBITDA | 652M | 16.3M |
| EBIT | -705M | 16.0M |
| Interest Expense | 189M | 0 |
| Net Income | -885M | 15.1M |
| EPS | -1.02 | 3.12 |
| Fiscal Year | 2025 | 2025 |
Income Statement Analysis: The Bottom-Line Duel
This income statement comparison reveals which company operates its business more efficiently and generates superior profitability.
Marvell Technology, Inc. Analysis
Marvell’s revenue grew steadily to $5.77B in 2025, up 4.7% from 2024, but net income remains negative at -$885M. Gross margin holds firm at 41.3%, yet the net margin of -15.4% signals ongoing profitability challenges. Operating income declined sharply, reflecting rising expenses and a 29% drop in EBIT, indicating weakened momentum.
NVE Corporation Analysis
NVE’s revenue dropped 13.2% to $25.9M in 2025, yet it sustains a robust gross margin of 83.6% and an impressive net margin of 58.2%. Net income fell slightly to $15.1M but remains strong. EBIT declined 13.6%, mirroring revenue softness, but overall margin strength and consistent profitability underscore operational efficiency.
Verdict: Margin Power vs. Revenue Scale
Marvell boasts substantial scale with nearly $6B revenue but struggles with negative profitability and margin compression. NVE operates at a smaller scale but delivers consistently high margins and solid net income growth. For investors, NVE’s efficient profit generation and margin resilience provide a clearer fundamental advantage over Marvell’s top-line growth without earnings stability.
Financial Ratios Comparison
These vital ratios act as a diagnostic tool to expose the underlying fiscal health, valuation premiums, and capital efficiency of the companies compared below:
| Ratios | Marvell Technology, Inc. (MRVL) | NVE Corporation (NVEC) |
|---|---|---|
| ROE | -6.6% (2025) | 24.2% (2025) |
| ROIC | -3.9% (2025) | 21.1% (2025) |
| P/E | -110.4 (2025) | 20.5 (2025) |
| P/B | 7.27 (2025) | 4.95 (2025) |
| Current Ratio | 1.54 (2025) | 28.4 (2025) |
| Quick Ratio | 1.03 (2025) | 22.0 (2025) |
| D/E | 0.32 (2025) | 0.015 (2025) |
| Debt-to-Assets | 21.5% (2025) | 1.4% (2025) |
| Interest Coverage | -3.8 (2025) | 0 (no debt) (2025) |
| Asset Turnover | 0.29 (2025) | 0.40 (2025) |
| Fixed Asset Turnover | 5.56 (2025) | 8.91 (2025) |
| Payout ratio | -23.4% (2025) | 128.4% (2025) |
| Dividend yield | 0.21% (2025) | 6.28% (2025) |
| Fiscal Year | 2025 | 2025 |
Efficiency & Valuation Duel: The Vital Signs
Ratios act as a company’s DNA, revealing hidden risks and operational excellence beyond headline financials.
Marvell Technology, Inc.
Marvell shows negative profitability with a -6.59% ROE and -15.35% net margin, signaling operational challenges. Its valuation appears stretched despite a favorable P/E ratio of -110.37 due to losses. Shareholders receive a minimal 0.21% dividend yield; the firm heavily reinvests in R&D (34% of sales), aiming for future growth.
NVE Corporation
NVE demonstrates strong profitability with a 24.19% ROE and 58.22% net margin, reflecting efficient capital use. Its P/E of 20.46 is neutral but reasonable given solid returns. NVE’s 6.28% dividend yield offers attractive income, supported by low debt and impressive asset turnover, highlighting disciplined capital allocation.
Premium Valuation vs. Operational Safety
NVE balances robust profitability and a reasonable valuation with steady dividends, presenting lower operational risk. Marvell’s negative returns and stretched valuation expose shareholders to higher risk despite reinvestment efforts. Investors seeking income and stability may prefer NVE’s profile, while risk-tolerant growth seekers might watch Marvell’s turnaround potential.
Which one offers the Superior Shareholder Reward?
I compare Marvell Technology and NVE Corporation on dividends and buybacks. Marvell yields a meager 0.21% with negative payout ratios, signaling dividend losses or reinvestment. Its buyback program is modest given free cash flow of 1.6/share. NVE yields 6.28%, with payout ratios above 100%, showing aggressive shareholder distributions funded by robust free cash flow of 2.7/share. NVE’s buybacks complement payouts, sustaining a high total return. Marvell’s payout model is unsustainable amid losses and low cash coverage. NVE’s strong margins and cash flows underpin durable dividends and buybacks. I conclude NVE offers a more attractive total shareholder return profile in 2026.
Comparative Score Analysis: The Strategic Profile
The radar chart reveals the fundamental DNA and trade-offs of Marvell Technology and NVE Corporation, highlighting their distinct financial strengths and risks:
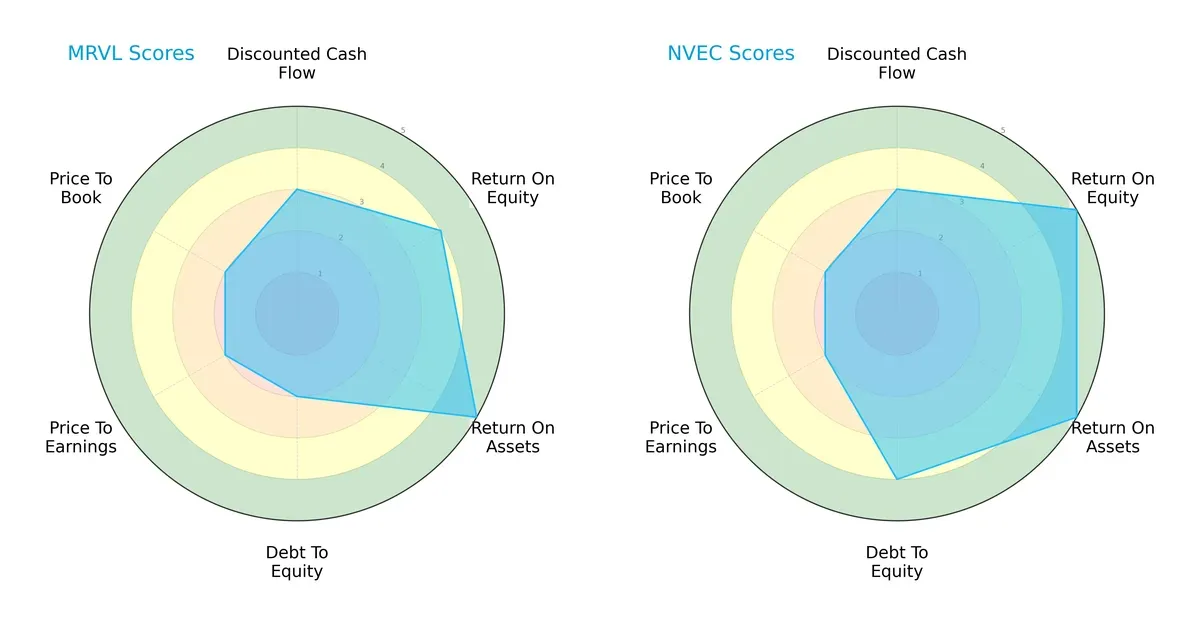
Marvell Technology exhibits a very favorable ROA and strong ROE, but it carries higher debt risk with a weaker debt-to-equity score. NVE Corporation shows a more balanced profile, excelling in ROE, ROA, and maintaining a healthier leverage position. Marvell leans on asset efficiency, while NVE delivers steadier financial stability overall.
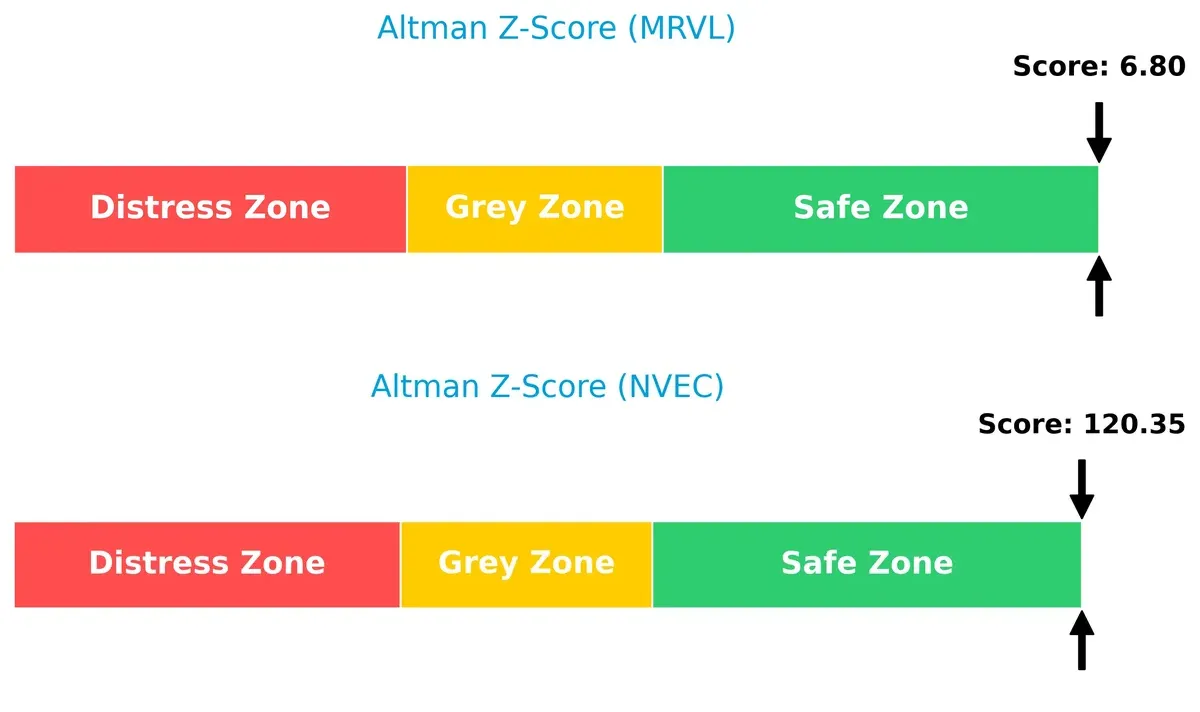
Bankruptcy Risk: Solvency Showdown
NVE Corporation’s Altman Z-Score vastly outpaces Marvell’s, signaling a significantly stronger buffer against bankruptcy in this volatile cycle:
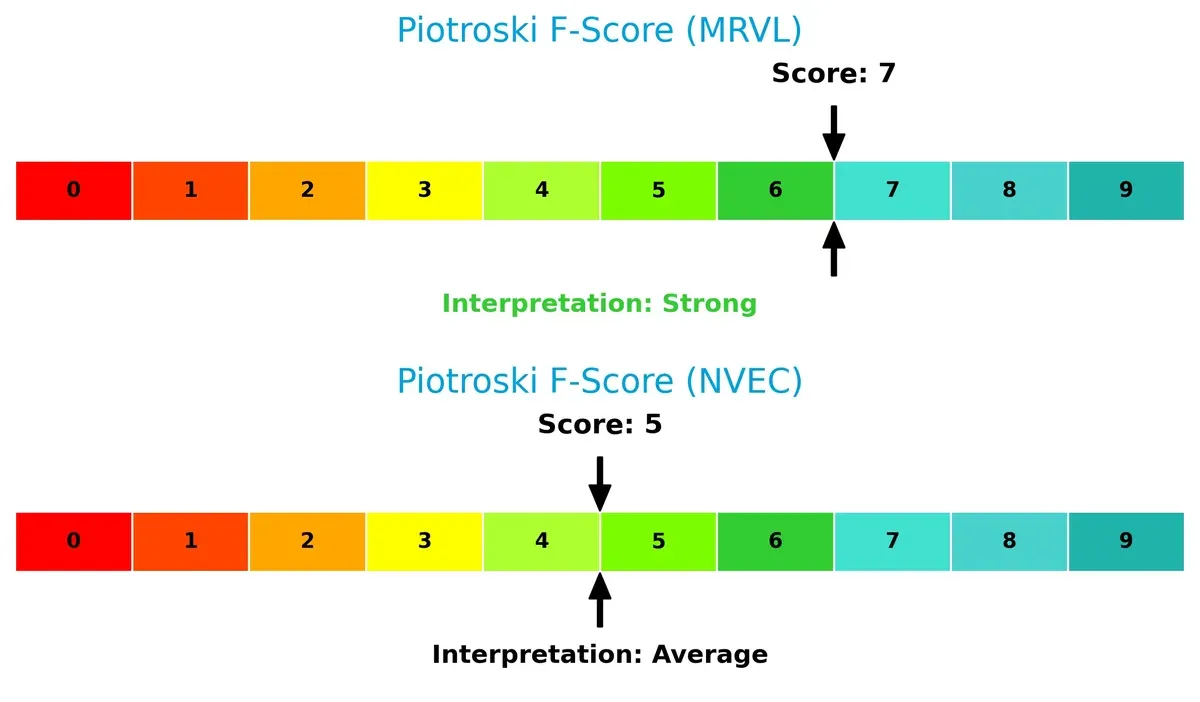
Financial Health: Quality of Operations
Marvell scores a robust 7 on the Piotroski scale, suggesting solid operational quality. NVE’s 5 indicates average financial health, with some internal metrics warranting caution:
How are the two companies positioned?
This section dissects Marvell Technology and NVE Corporation’s operational DNA by comparing their revenue distribution and internal strengths and weaknesses. The goal is to confront their economic moats to identify which model offers the most resilient competitive advantage today.
Revenue Segmentation: The Strategic Mix
The following comparison dissects how Marvell Technology, Inc. and NVE Corporation diversify their income streams and where their primary sector bets lie:
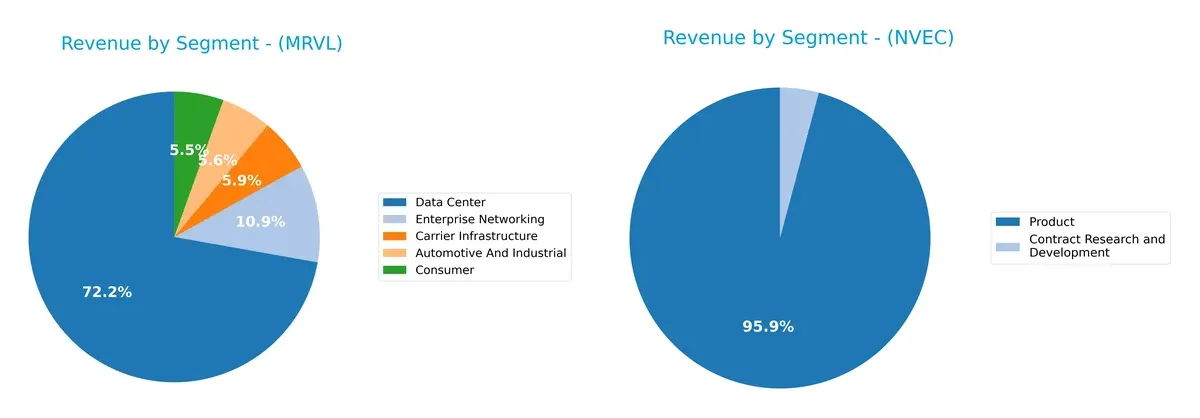
Marvell anchors its revenue in Data Center with $4.16B in 2025, dwarfing other segments like Enterprise Networking ($626M) and Carrier Infrastructure ($338M). This points to ecosystem lock-in focused on cloud infrastructure. In contrast, NVE relies heavily on a single Product segment generating $25.9M in 2022, with minimal Contract R&D ($1.1M). Marvell’s diversified portfolio mitigates concentration risk, while NVE’s revenue concentration suggests vulnerability to product cycle shifts.
Strengths and Weaknesses Comparison
This table compares the strengths and weaknesses of Marvell Technology, Inc. and NVE Corporation:
Marvell Technology Strengths
- Diverse product segments including Data Center and Enterprise Networking
- Strong presence in China and multiple Asian markets
- Favorable current and quick ratios indicate liquidity
NVE Corporation Strengths
- High net margin and ROE reflect strong profitability
- Very low debt to assets ratio supports financial stability
- Excellent interest coverage and fixed asset turnover
Marvell Technology Weaknesses
- Negative profitability metrics including net margin and ROIC
- Unfavorable interest coverage signals financial stress
- High price-to-book ratio suggests overvaluation
NVE Corporation Weaknesses
- Extremely high current ratio may indicate inefficient asset use
- Unfavorable price-to-book ratio
- Moderate asset turnover limits operational efficiency
Both companies exhibit clear competitive strengths but face distinct financial challenges. Marvell’s broad diversification contrasts with profitability weaknesses, while NVE shows strong profit metrics yet potential efficiency and valuation concerns. These factors shape their strategic priorities moving forward.
The Moat Duel: Analyzing Competitive Defensibility
A structural moat is the sole barrier protecting long-term profits from relentless competitive erosion. Let’s dissect how two semiconductor firms defend their turf:
Marvell Technology, Inc.: Scale and Integration Moat
Marvell leverages broad product integration and scale, reflected in stable gross margins near 41%. Yet, declining ROIC signals weakening capital efficiency, threatening its moat in 2026 amid rising expenses.
NVE Corporation: Niche Innovation Moat
NVE’s spintronics niche creates a high-margin moat, boasting an 83.6% gross margin and growing ROIC. Unlike Marvell, NVE’s focused innovation drives durable value and expanding profitability prospects.
Scale Integration vs. Niche Innovation: Which Moat Holds Stronger?
NVE’s growing ROIC and superior margins reveal a deeper, more sustainable moat than Marvell’s declining capital returns. NVE stands better positioned to protect and expand its market share in 2026.
Which stock offers better returns?
The past year saw Marvell Technology, Inc. gain 17.63%, showing a strong but slowing uptrend. NVE Corporation fell 17.56%, reversing earlier gains with accelerating declines.
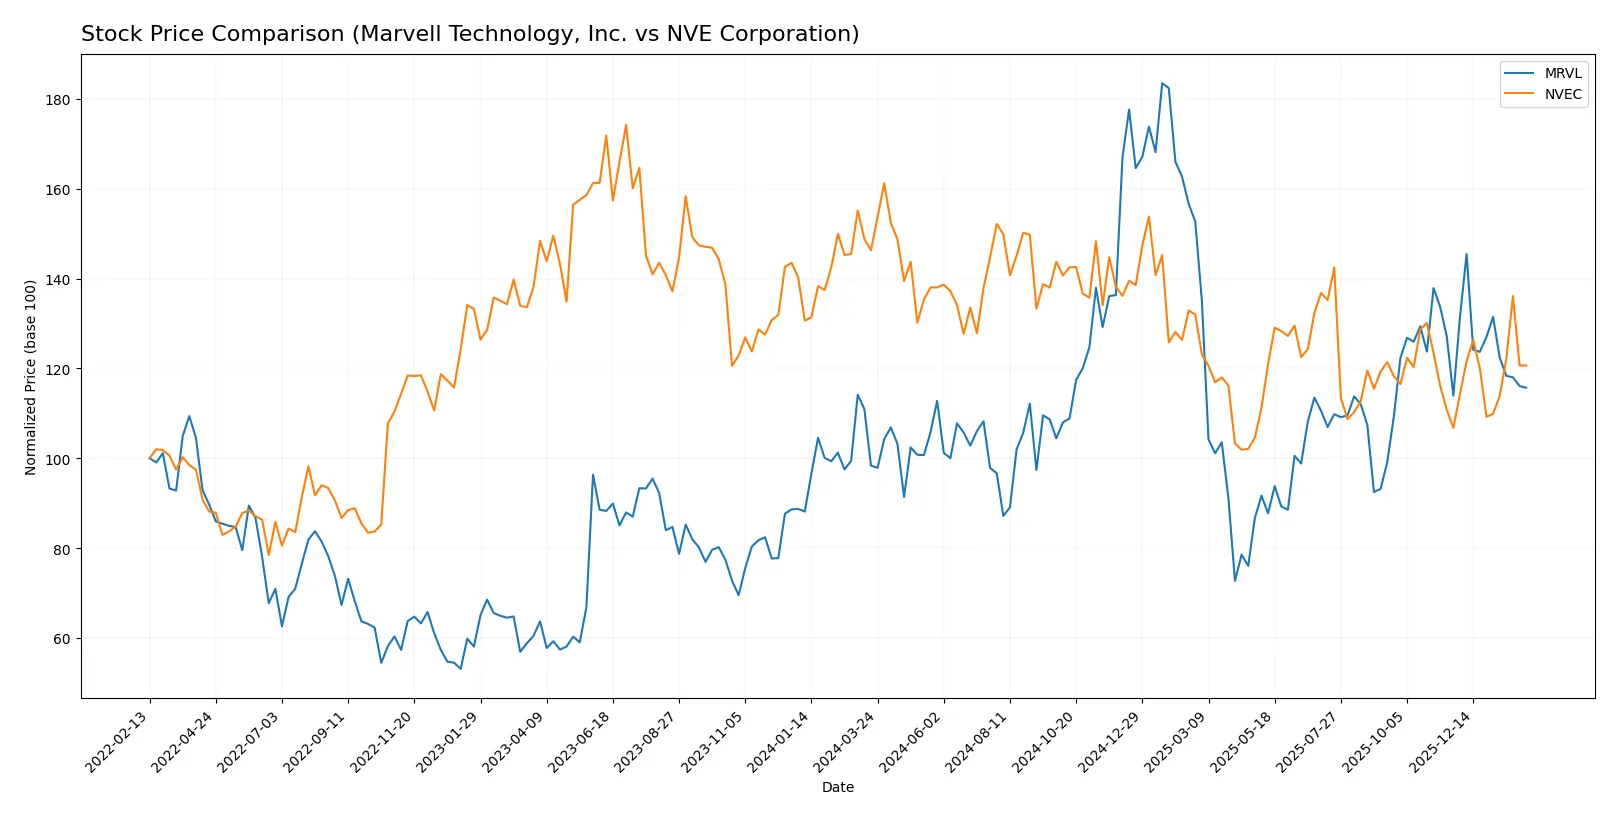
Trend Comparison
Marvell Technology, Inc. shows a bullish 17.63% rise over 12 months, though momentum is slowing. Its price ranged from 49.43 to 124.76, with high volatility at 16.41% standard deviation.
NVE Corporation declined 17.56% over the same period, marking a bearish trend with accelerating losses. The stock fluctuated between 56.99 and 90.18, with lower volatility at 7.55%.
Marvell outperformed NVE by a wide margin, delivering the highest market return despite a recent deceleration in gains.
Target Prices
Analysts present a clear target price consensus for Marvell Technology, Inc., signaling a strong growth outlook.
| Company | Target Low | Target High | Consensus |
|---|---|---|---|
| Marvell Technology, Inc. | 80 | 156 | 117 |
The target consensus for Marvell implies a 49% upside from the current price of $78.66, reflecting robust confidence in its semiconductor market position. No verified target price data is available from recognized analysts for NVE Corporation.

Don’t Let Luck Decide Your Entry Point
Optimize your entry points with our advanced ProRealTime indicators. You’ll get efficient buy signals with precise price targets for maximum performance. Start outperforming now!
How do institutions grade them?
The following summarizes the latest institutional grades for both companies:
Marvell Technology, Inc. Grades
The table below details recent grades from recognized financial institutions for Marvell Technology:
| Grading Company | Action | New Grade | Date |
|---|---|---|---|
| Rosenblatt | Maintain | Buy | 2026-01-07 |
| Melius Research | Upgrade | Buy | 2026-01-05 |
| Benchmark | Downgrade | Hold | 2025-12-08 |
| JP Morgan | Maintain | Overweight | 2025-12-03 |
| Rosenblatt | Maintain | Buy | 2025-12-03 |
| Roth Capital | Maintain | Buy | 2025-12-03 |
| Oppenheimer | Maintain | Outperform | 2025-12-03 |
| B. Riley Securities | Maintain | Buy | 2025-12-03 |
| Wells Fargo | Maintain | Overweight | 2025-12-03 |
| Susquehanna | Maintain | Positive | 2025-12-03 |
NVE Corporation Grades
No reliable institutional grades are available for NVE Corporation at this time.
Which company has the best grades?
Marvell Technology holds a diverse set of mostly positive grades, including multiple “Buy” and “Overweight” ratings. NVE Corporation lacks institutional grading data, which limits investor insight into its current market perception. This disparity may affect investors’ confidence levels and portfolio decisions.
Risks specific to each company
The following categories identify critical pressure points and systemic threats facing Marvell Technology, Inc. and NVE Corporation in the 2026 market environment:
1. Market & Competition
Marvell Technology, Inc.
- Faces intense competition in semiconductors with rapid innovation cycles and pressure on margins.
NVE Corporation
- Operates in niche spintronics market, limiting direct competition but also growth scale.
2. Capital Structure & Debt
Marvell Technology, Inc.
- Moderate leverage with D/E of 0.32 and manageable debt-to-assets at 21.5%. Interest coverage negative, signaling risk.
NVE Corporation
- Extremely low leverage (D/E 0.01) and debt-to-assets at 1.43%. Strong interest coverage; very low financial risk.
3. Stock Volatility
Marvell Technology, Inc.
- High beta at 1.978 implies greater sensitivity to market swings and higher volatility risk.
NVE Corporation
- Lower beta of 1.219 reflects more stable stock price movements relative to the market.
4. Regulatory & Legal
Marvell Technology, Inc.
- Global operations expose it to complex international regulations and trade tensions, especially in Asia.
NVE Corporation
- Primarily US-based with limited global footprint, reducing regulatory complexity and international legal risks.
5. Supply Chain & Operations
Marvell Technology, Inc.
- Extensive global supply chain vulnerable to geopolitical disruptions and semiconductor shortages.
NVE Corporation
- Smaller scale operations reduce exposure, but reliance on specialized components risks supply bottlenecks.
6. ESG & Climate Transition
Marvell Technology, Inc.
- Larger firm faces increasing pressure to meet ESG standards and reduce carbon footprint amid investor scrutiny.
NVE Corporation
- Smaller company likely has lower ESG impact but may lack resources for aggressive climate initiatives.
7. Geopolitical Exposure
Marvell Technology, Inc.
- Significant exposure to Asia-Pacific geopolitical tensions due to manufacturing and sales presence.
NVE Corporation
- Limited international exposure minimizes geopolitical risk but may constrain growth opportunities.
Which company shows a better risk-adjusted profile?
NVE Corporation’s strongest risk for investors lies in its concentrated niche market and limited scale, which may cap growth potential. Marvell Technology faces considerable geopolitical and operational risks due to its global footprint and negative interest coverage, raising concerns about financial stability. However, NVE’s pristine balance sheet, lower volatility, and stronger profitability support a superior risk-adjusted profile. Notably, Marvell’s negative interest coverage signals financial strain, underscoring the need for caution despite its larger scale.
Final Verdict: Which stock to choose?
Marvell Technology’s superpower lies in its aggressive investment in R&D and scale, positioning it as a tech innovator with potential for future breakthroughs. Yet, its negative profitability and declining capital returns are points of vigilance. It suits aggressive growth portfolios willing to weather volatility for possible tech leadership.
NVE Corporation boasts a robust moat through exceptional profitability, efficient capital use, and a pristine balance sheet. Its consistent value creation and strong income metrics offer better stability than Marvell. NVE fits portfolios seeking GARP—growth paired with financial discipline and lower risk.
If you prioritize breakthrough innovation and can tolerate near-term earnings pressure, Marvell might be compelling for growth seekers. However, if you seek durable profitability and financial resilience, NVE outshines Marvell by delivering superior stability and value creation. Both present distinct strategic profiles, making investor fit key.
Disclaimer: Investment carries a risk of loss of initial capital. The past performance is not a reliable indicator of future results. Be sure to understand risks before making an investment decision.
Go Further
I encourage you to read the complete analyses of Marvell Technology, Inc. and NVE Corporation to enhance your investment decisions: