In the dynamic semiconductor industry, Marvell Technology, Inc. and Nova Ltd. stand out as innovators shaping the future of technology. Marvell focuses on integrated circuits and storage solutions, while Nova specializes in advanced process control systems for semiconductor manufacturing. Both companies address critical needs in the tech supply chain, making their comparison essential for investors seeking growth and innovation. This article will help you identify which company offers the most compelling investment opportunity.
Table of contents
Companies Overview
I will begin the comparison between Marvell Technology, Inc. and Nova Ltd. by providing an overview of these two companies and their main differences.
Marvell Technology, Inc. Overview
Marvell Technology, Inc. focuses on designing, developing, and selling a broad range of integrated circuits including analog, mixed-signal, and digital signal processing products. Its portfolio covers Ethernet solutions, storage controllers, and application processors. Headquartered in Wilmington, Delaware, Marvell operates globally across multiple countries and serves diverse technology sectors.
Nova Ltd. Overview
Nova Ltd. specializes in process control systems for semiconductor manufacturing, offering metrology platforms for dimensional, film, and chemical measurements. The company supports various semiconductor process steps such as lithography and etch. Based in Rehovot, Israel, Nova serves integrated circuit manufacturers and process equipment makers worldwide.
Key similarities and differences
Both Marvell and Nova operate in the semiconductor industry and trade on NASDAQ. Marvell’s business centers on integrated circuits and Ethernet solutions, while Nova focuses on process control and metrology systems for semiconductor fabrication. Marvell is significantly larger by market capitalization and employee count, reflecting broader product diversity compared to Nova’s specialized manufacturing equipment focus.
Income Statement Comparison
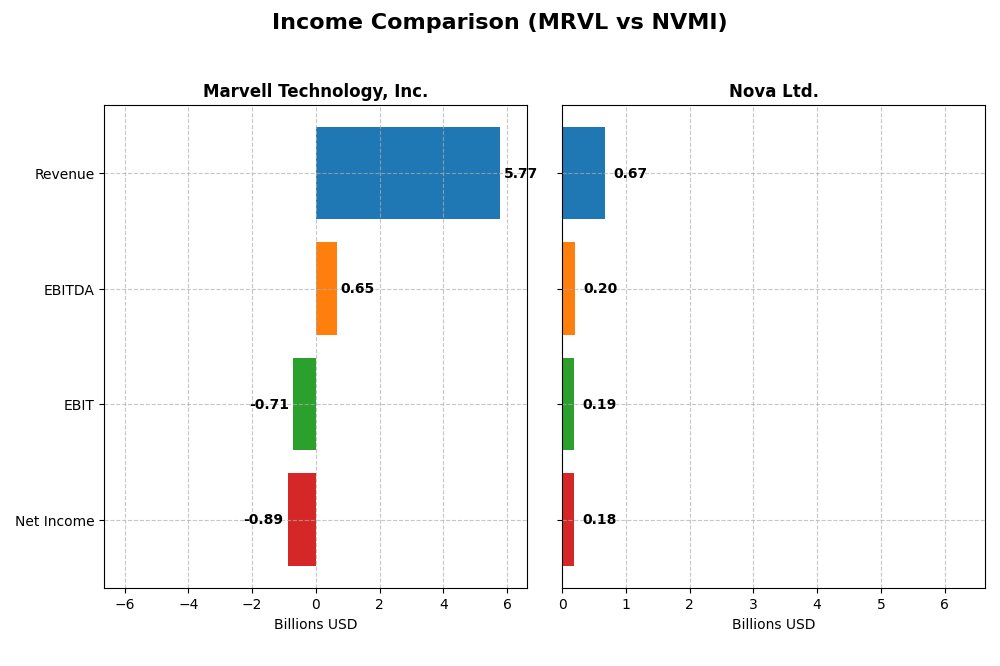
The following table presents a side-by-side comparison of the key income statement metrics for Marvell Technology, Inc. and Nova Ltd. based on their most recent fiscal year data.
| Metric | Marvell Technology, Inc. | Nova Ltd. |
|---|---|---|
| Market Cap | 69.3B | 12.9B |
| Revenue | 5.77B | 672M |
| EBITDA | 652M | 205M |
| EBIT | -705M | 188M |
| Net Income | -885M | 185M |
| EPS | -1.02 | 6.31 |
| Fiscal Year | 2025 | 2024 |
Income Statement Interpretations
Marvell Technology, Inc.
From 2021 to 2025, Marvell Technology’s revenue nearly doubled from $2.97B to $5.77B, showing robust top-line growth. However, net income remained negative throughout this period, worsening from -$277M to -$885M in 2025. Gross margin stayed stable around 41%, but EBIT and net margins were consistently unfavorable. The latest year saw modest revenue growth of 4.7%, but EBIT declined by 29%, reflecting increased operating pressures.
Nova Ltd.
Nova Ltd. exhibited solid revenue growth from $269M in 2020 to $672M in 2024, with a particularly strong 30% increase in the latest year. Net income grew substantially, reaching $184M in 2024, supported by a stable and favorable gross margin of 57.6%. EBIT and net margins remained positive and improved, with EBIT margin at 27.9% in 2024. EPS growth was robust at 34% year-over-year, indicating strong profitability gains.
Which one has the stronger fundamentals?
Nova Ltd. demonstrates stronger fundamentals with consistent revenue and net income growth, high and improving margins, and a favorable overall income statement evaluation. Marvell Technology, despite revenue growth, shows persistent net losses and unfavorable EBIT and net margins, reflecting ongoing profitability challenges. The contrast in margin stability and bottom-line results clearly favors Nova Ltd. in fundamental strength.
Financial Ratios Comparison
Below is a comparative overview of key financial ratios for Marvell Technology, Inc. (MRVL) and Nova Ltd. (NVMI) based on their most recent fiscal year data.
| Ratios | Marvell Technology, Inc. (2025) | Nova Ltd. (2024) |
|---|---|---|
| ROE | -6.59% | 19.81% |
| ROIC | -3.88% | 13.39% |
| P/E | -110.4 | 31.20 |
| P/B | 7.27 | 6.18 |
| Current Ratio | 1.54 | 2.32 |
| Quick Ratio | 1.03 | 1.92 |
| D/E (Debt/Equity) | 0.32 | 0.25 |
| Debt-to-Assets Ratio | 21.50% | 16.98% |
| Interest Coverage | -3.80 | 116.20 |
| Asset Turnover | 0.29 | 0.48 |
| Fixed Asset Turnover | 5.56 | 5.06 |
| Payout ratio | -23.45% | 0% |
| Dividend yield | 0.21% | 0% |
Interpretation of the Ratios
Marvell Technology, Inc.
Marvell Technology shows mixed ratio results with more unfavorable indicators, including negative net margin (-15.35%), negative return on equity (-6.59%), and weak interest coverage (-3.72). Positive aspects include a solid current ratio (1.54) and low debt-to-equity (0.32). The company pays dividends with a low yield of 0.21%, suggesting cautious shareholder returns amid profitability challenges.
Nova Ltd.
Nova Ltd. reports predominantly favorable ratios, with a strong net margin of 27.33%, return on equity at 19.81%, and excellent interest coverage (116.2). It maintains a healthy liquidity position with a current ratio of 2.32. The company does not pay dividends, likely reflecting a reinvestment or growth strategy common in its sector, supported by stable free cash flow and capital structure.
Which one has the best ratios?
Nova Ltd. demonstrates a more favorable overall ratio profile, with 64.29% favorable ratios compared to Marvell’s 42.86%. Nova’s profitability, liquidity, and interest coverage metrics stand out, while Marvell faces challenges in profitability and coverage despite some liquidity strengths. Therefore, Nova’s financial ratios appear stronger based on the latest data.
Strategic Positioning
This section compares the strategic positioning of Marvell Technology, Inc. and Nova Ltd., including market position, key segments, and exposure to technological disruption:
Marvell Technology, Inc.
- Large market cap of 69B USD with competitive pressure in semiconductors industry
- Diverse revenue streams: Data Center, Enterprise Networking, Automotive, Consumer, Carrier Infrastructure
- Exposure to semiconductor industry technology shifts through integrated circuits and storage controllers
Nova Ltd.
- Smaller market cap of 13B USD focusing on semiconductor process control systems
- Single product segment offering metrology platforms for semiconductor manufacturing process control
- Exposure focused on metrology technology for advanced semiconductor manufacturing steps
Marvell Technology, Inc. vs Nova Ltd. Positioning
Marvell pursues a diversified semiconductor product approach across multiple segments, providing broader market exposure but facing varied competitive pressures. Nova concentrates on niche process control metrology, limiting its scope but specializing in critical manufacturing technology.
Which has the best competitive advantage?
Marvell shows a very unfavorable moat with declining profitability, indicating value destruction. Nova has a slightly favorable moat with growing profitability, suggesting improving competitive positioning despite smaller scale.
Stock Comparison
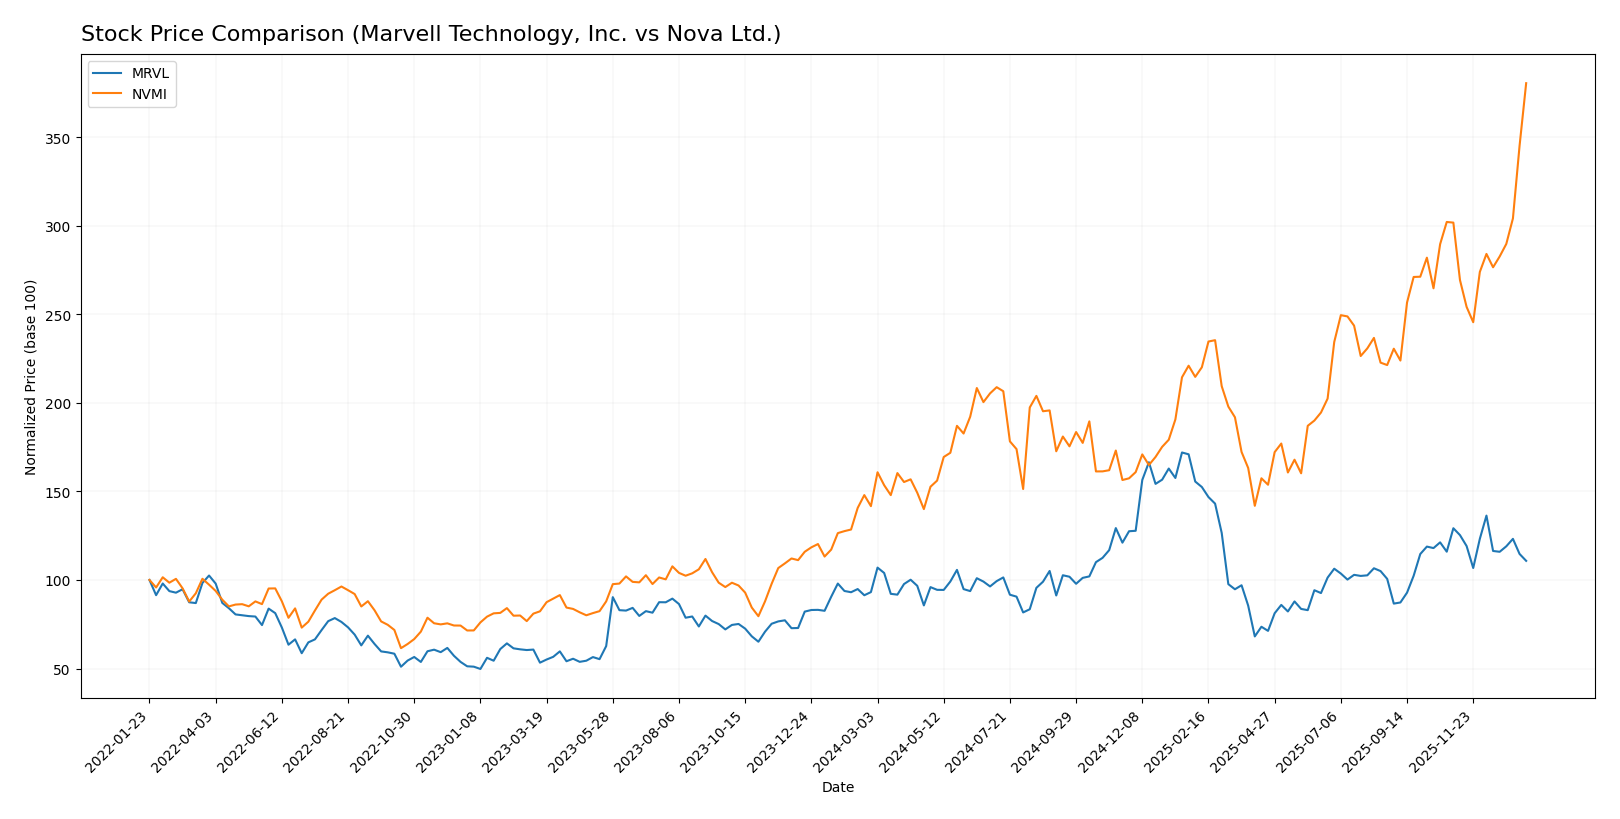
The stock price dynamics over the past 12 months reveal significant bullish momentum for both Marvell Technology, Inc. and Nova Ltd., with distinct acceleration patterns and pronounced trading volume shifts.
Trend Analysis
Marvell Technology, Inc. (MRVL) shows a bullish trend over the past year with an 18.94% price increase, though the trend is decelerating. The stock traded between a low of 49.43 and a high of 124.76, supported by moderate volatility (std deviation 16.46).
Nova Ltd. (NVMI) experienced a strong bullish trend with a 168.54% price increase over the same period, exhibiting acceleration and higher volatility (std deviation 55.86). The price ranged from 159.92 to 434.55, with recent gains of 26.09%.
Comparing both stocks, NVMI delivered the highest market performance with substantially greater price appreciation and acceleration, outperforming MRVL in total price growth and recent upward momentum.
Target Prices
Analysts present a bullish consensus for Marvell Technology, Inc. and a moderately optimistic outlook for Nova Ltd.
| Company | Target High | Target Low | Consensus |
|---|---|---|---|
| Marvell Technology, Inc. | 156 | 80 | 117 |
| Nova Ltd. | 390 | 335 | 362.5 |
Marvell’s target consensus of 117 suggests potential upside from the current 80.38 USD price, indicating room for growth. Nova’s consensus at 362.5 is below the current 434.55 USD price, implying a more cautious stance from analysts.
Analyst Opinions Comparison
This section compares analysts’ ratings and grades for Marvell Technology, Inc. and Nova Ltd.:
Rating Comparison
MRVL Rating
- Rating: B+, considered very favorable by analysts.
- Discounted Cash Flow Score: Moderate rating of 3, indicating fair valuation.
- ROE Score: Favorable score of 4, showing efficient profit generation.
- ROA Score: Very favorable score of 5, reflecting effective asset utilization.
- Debt To Equity Score: Moderate score of 2, indicating moderate financial risk.
- Overall Score: Moderate score of 3, summarizing financial standing.
NVMI Rating
- Rating: B-, also considered very favorable by analysts.
- Discounted Cash Flow Score: Moderate rating of 3, indicating fair valuation.
- ROE Score: Favorable score of 4, showing efficient profit generation.
- ROA Score: Very favorable score of 5, reflecting effective asset utilization.
- Debt To Equity Score: Very unfavorable score of 1, indicating higher financial risk.
- Overall Score: Moderate score of 3, summarizing financial standing.
Which one is the best rated?
Based strictly on the provided data, Marvell Technology, Inc. holds a higher overall rating (B+) compared to Nova Ltd. (B-). Both companies share similar scores except for debt-to-equity, where Marvell shows a more moderate risk profile.
Scores Comparison
The comparison of the Altman Z-Score and Piotroski Score for Marvell Technology and Nova Ltd. is as follows:
Marvell Technology Scores
- Altman Z-Score: 6.76, indicating a safe financial zone with low bankruptcy risk.
- Piotroski Score: 7, reflecting strong financial health and good investment potential.
Nova Ltd. Scores
- Altman Z-Score: 7.76, also in the safe zone with very low bankruptcy risk.
- Piotroski Score: 7, showing strong financial health and good investment potential.
Which company has the best scores?
Both Marvell Technology and Nova Ltd. have Altman Z-Scores in the safe zone and identical Piotroski Scores of 7, indicating equally strong financial health based on the provided data.
Grades Comparison
Here is a summary of the latest grades assigned by reputable grading companies for the two companies:
Marvell Technology, Inc. Grades
The table below shows recent grades awarded by recognized grading firms for Marvell Technology, Inc.:
| Grading Company | Action | New Grade | Date |
|---|---|---|---|
| Rosenblatt | Maintain | Buy | 2026-01-07 |
| Melius Research | Upgrade | Buy | 2026-01-05 |
| Benchmark | Downgrade | Hold | 2025-12-08 |
| B. Riley Securities | Maintain | Buy | 2025-12-03 |
| JP Morgan | Maintain | Overweight | 2025-12-03 |
| Susquehanna | Maintain | Positive | 2025-12-03 |
| Benchmark | Maintain | Buy | 2025-12-03 |
| Oppenheimer | Maintain | Outperform | 2025-12-03 |
| Stifel | Maintain | Buy | 2025-12-03 |
| Rosenblatt | Maintain | Buy | 2025-12-03 |
The overall trend for Marvell Technology indicates a strong buy consensus with occasional downgrades to hold, demonstrating mostly positive analyst sentiment.
Nova Ltd. Grades
The table below shows recent grades awarded by recognized grading firms for Nova Ltd.:
| Grading Company | Action | New Grade | Date |
|---|---|---|---|
| B of A Securities | Maintain | Buy | 2026-01-13 |
| Jefferies | Maintain | Buy | 2025-12-15 |
| Evercore ISI Group | Maintain | Outperform | 2025-11-07 |
| Benchmark | Maintain | Buy | 2025-11-07 |
| Cantor Fitzgerald | Maintain | Overweight | 2025-06-24 |
| B of A Securities | Maintain | Buy | 2025-06-24 |
| Benchmark | Maintain | Buy | 2025-05-09 |
| Citigroup | Maintain | Buy | 2025-05-09 |
| B of A Securities | Maintain | Buy | 2025-04-16 |
| Cantor Fitzgerald | Maintain | Overweight | 2025-03-14 |
Nova Ltd. shows a consistent buy rating trend with multiple firms maintaining positive outlooks, reflecting stable analyst confidence.
Which company has the best grades?
Both Marvell Technology, Inc. and Nova Ltd. have predominantly received buy ratings from reputable firms. Marvell has a larger volume of buy ratings but includes some hold and mixed signals, while Nova presents a consistent buy and outperform pattern without downgrades. This consistency may suggest steadier analyst confidence for Nova, potentially influencing investor perceptions of lower risk or steadier growth.
Strengths and Weaknesses
Below is a comparative overview of key strengths and weaknesses for Marvell Technology, Inc. (MRVL) and Nova Ltd. (NVMI) based on the most recent financial and operational data.
| Criterion | Marvell Technology, Inc. (MRVL) | Nova Ltd. (NVMI) |
|---|---|---|
| Diversification | Highly diversified across Data Center ($4.16B), Enterprise Networking ($626M), Carrier Infrastructure ($338M), Consumer ($316M), Automotive & Industrial ($322M) | Low diversification; single product line generating $538M in 2024 |
| Profitability | Negative net margin (-15.35%), negative ROIC (-3.88%), shedding value with declining ROIC | Strong profitability: net margin 27.33%, ROIC 13.39%, growing profitability |
| Innovation | Moderate innovation implied by fixed asset turnover (5.56) but declining economic moat | Improving innovation potential with growing ROIC and favorable interest coverage (116.2) |
| Global presence | Broad market exposure in multiple sectors and geographies | More focused market presence, possibly niche specialization |
| Market Share | Significant presence in data center and networking markets but value destroying | Smaller market share but increasing value creation and profitability |
Key takeaways: Marvell Technology shows broad diversification but struggles with declining profitability and value destruction. Nova Ltd. is less diversified but demonstrates improving profitability and a slightly favorable economic moat, suggesting better capital efficiency and growth potential. Investors should weigh Marvell’s scale against its financial challenges and consider Nova’s growth trajectory despite its narrower focus.
Risk Analysis
The table below summarizes key risks for Marvell Technology, Inc. (MRVL) and Nova Ltd. (NVMI) based on their latest financial and operational profiles.
| Metric | Marvell Technology, Inc. (MRVL) | Nova Ltd. (NVMI) |
|---|---|---|
| Market Risk | High beta (1.945) indicating elevated market volatility exposure | High beta (1.832) indicating elevated market volatility exposure |
| Debt level | Moderate debt-to-equity ratio (0.32), manageable leverage | Lower debt-to-equity ratio (0.25), but weak debt rating |
| Regulatory Risk | Operations across multiple countries including China and US; exposure to tech export regulations | Headquarters in Israel with global operations, subject to complex trade policies |
| Operational Risk | Large workforce (7K+) and global supply chain may face disruptions | Smaller workforce (~1.2K), but niche semiconductor metrology focus may be vulnerable |
| Environmental Risk | Standard industry risks, no major disclosures | No significant environmental risk reported |
| Geopolitical Risk | Exposure to US-China tensions affecting semiconductor supply chains | Higher geopolitical risk given Israel base and supply chain in Asia |
Most impactful risks include Marvell’s high market volatility and operational complexity, while Nova benefits from lower debt but faces geopolitical uncertainties due to its Israel headquarters and supply exposure. Investors should weigh Marvell’s financial challenges against Nova’s geopolitical risks carefully.
Which Stock to Choose?
Marvell Technology, Inc. (MRVL) shows modest revenue growth of 4.7% in 2025 but suffers from unfavorable profitability with a net margin of -15.35% and declining returns on equity and invested capital. Its debt levels are moderate, supported by a favorable debt-to-equity ratio of 0.32 and current ratio of 1.54. Despite a very favorable company rating of B+, its overall financial ratios and income statement evaluations remain unfavorable, signaling value destruction with declining ROIC.
Nova Ltd. (NVMI) exhibits strong income growth of nearly 30% in 2024 with robust profitability metrics, including a net margin of 27.33% and a return on equity close to 20%. The company maintains a low debt burden with a debt-to-equity ratio of 0.25 and a solid current ratio of 2.32. Its rating stands at B- with favorable overall financial ratios and income statement evaluations, reflecting improving profitability and a slightly favorable moat due to growing ROIC.
Investors with a growth-oriented profile might find NVMI’s strong income growth, profitability, and improving competitive position more appealing, while those focusing on financial stability and debt management could interpret MRVL’s moderate debt levels and current rating as a mitigating factor despite its unfavorable profitability and value destruction signals.
Disclaimer: Investment carries a risk of loss of initial capital. The past performance is not a reliable indicator of future results. Be sure to understand risks before making an investment decision.
Go Further
I encourage you to read the complete analyses of Marvell Technology, Inc. and Nova Ltd. to enhance your investment decisions: