Marvell Technology, Inc. and Microchip Technology Incorporated are two influential players in the semiconductor industry, each driving innovation in integrated circuits and embedded control solutions. Both companies serve overlapping markets such as automotive, industrial, and communications sectors, making their strategies and growth potential worth comparing. In this article, I will analyze their strengths and risks to help you decide which stock may best complement your investment portfolio.
Table of contents
Companies Overview
I will begin the comparison between Marvell Technology, Inc. and Microchip Technology Incorporated by providing an overview of these two companies and their main differences.
Marvell Technology, Inc. Overview
Marvell Technology, Inc. is a semiconductor company focused on designing, developing, and selling integrated circuits including analog, mixed-signal, and digital signal processing products. Its portfolio covers Ethernet solutions, storage controllers, and processors. Founded in 1995 and headquartered in Wilmington, Delaware, Marvell operates globally with a workforce of about 7K employees, positioning itself as a key player in the technology sector.
Microchip Technology Incorporated Overview
Microchip Technology Incorporated develops and manufactures embedded control solutions, including microcontrollers, microprocessors, and analog products for a variety of applications such as automotive, industrial, and communications. Founded in 1989 and based in Chandler, Arizona, Microchip employs roughly 22.3K people. The company offers a wide range of semiconductor components and engineering services, catering to a diverse global market in the technology industry.
Key similarities and differences
Both companies operate in the semiconductor industry, focusing on integrated circuits and embedded solutions. Marvell emphasizes networking and storage technologies, while Microchip provides a broader array of microcontrollers, analog devices, and development tools. Marvell has a smaller workforce and a higher market capitalization ($69.3B vs. $40.2B for Microchip), reflecting differences in scale and product specialization within the sector.
Income Statement Comparison
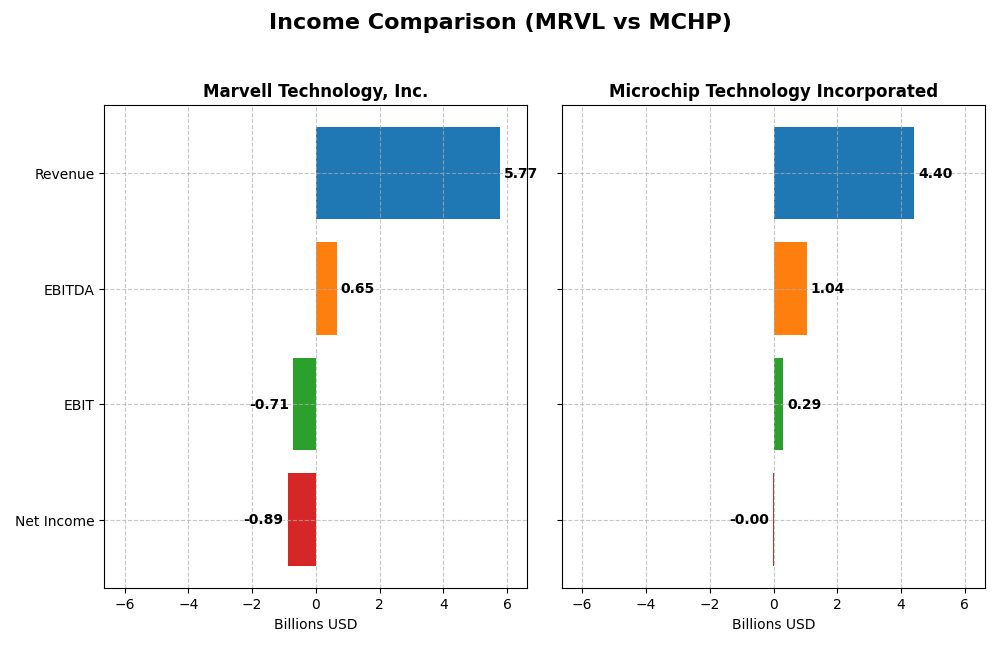
This table presents a side-by-side comparison of key income statement metrics for Marvell Technology, Inc. and Microchip Technology Incorporated for the most recent fiscal year available.
| Metric | Marvell Technology, Inc. | Microchip Technology Incorporated |
|---|---|---|
| Market Cap | 69.3B | 40.2B |
| Revenue | 5.77B | 4.40B |
| EBITDA | 652M | 1.04B |
| EBIT | -705M | 290M |
| Net Income | -885M | -500K |
| EPS | -1.02 | -0.005 |
| Fiscal Year | 2025 | 2025 |
Income Statement Interpretations
Marvell Technology, Inc.
Marvell’s revenue nearly doubled from 2021 to 2025, reaching $5.77B in 2025, but net income remained negative throughout, with a loss of $885M in 2025. Gross margin stayed relatively stable around 41%, while EBIT and net margins were consistently negative. Despite a slight revenue growth slowdown in 2025, net margin and EPS showed some improvement.
Microchip Technology Incorporated
Microchip experienced a revenue decline overall, with $4.40B in 2025, down from $5.44B in 2021, and net income dropped sharply, turning negative at -$3M in 2025 after positive earnings in earlier years. Gross margin remained strong above 56%, but EBIT margin weakened and net margin turned slightly negative. The latest year showed significant declines in profit metrics and margins.
Which one has the stronger fundamentals?
Both companies face challenges with unfavorable net margins and profitability trends. Marvell shows steady revenue growth and maintains a solid gross margin despite losses, while Microchip displays a steep revenue and earnings decline with a higher gross margin but worsening net margin. Overall, Marvell’s growth and margin stability contrast with Microchip’s sharper downturns.
Financial Ratios Comparison
Below is a comparison of key financial ratios for Marvell Technology, Inc. and Microchip Technology Incorporated for their most recent fiscal years.
| Ratios | Marvell Technology, Inc. (2025) | Microchip Technology Incorporated (2025) |
|---|---|---|
| ROE | -6.59% | -0.01% |
| ROIC | -3.88% | -0.03% |
| P/E | -110.4 | -52,021 |
| P/B | 7.27 | 3.67 |
| Current Ratio | 1.54 | 2.59 |
| Quick Ratio | 1.03 | 1.47 |
| D/E | 0.32 | 0.80 |
| Debt-to-Assets | 21.5% | 36.9% |
| Interest Coverage | -3.80 | 1.18 |
| Asset Turnover | 0.29 | 0.29 |
| Fixed Asset Turnover | 5.56 | 3.72 |
| Payout ratio | -23.4% | -1951.4% |
| Dividend yield | 0.21% | 3.75% |
Interpretation of the Ratios
Marvell Technology, Inc.
Marvell Technology shows a mixed picture with 42.86% favorable ratios but 57.14% unfavorable, signaling caution. Key concerns include negative net margin (-15.35%) and return on equity (-6.59%), alongside weak interest coverage (-3.72). The current ratio (1.54) and debt-to-equity (0.32) remain positive. Dividend yield is low at 0.21%, reflecting modest shareholder returns.
Microchip Technology Incorporated
Microchip’s ratios present a slightly unfavorable stance, with 35.71% favorable, 42.86% unfavorable, and 21.43% neutral. Negative net margin (-0.01%) and return on equity (-0.01%) raise concerns, despite a strong current ratio (2.59) and quick ratio (1.47). The dividend yield is 3.75%, indicating a more attractive income profile for shareholders compared to its peer.
Which one has the best ratios?
Neither company exhibits a fully favorable ratio set, but Marvell displays a higher proportion of unfavorable metrics and weaker profitability ratios. Microchip’s slightly unfavorable overall evaluation benefits from better liquidity and a higher dividend yield, although it also faces profitability challenges. The choice depends on specific investor priorities regarding risk and income.
Strategic Positioning
This section compares the strategic positioning of Marvell Technology and Microchip Technology, including market position, key segments, and exposure to disruption:
Marvell Technology, Inc.
- Larger market cap of 69.3B facing competitive semiconductor industry pressures.
- Diverse segments: Data Center, Enterprise Networking, Carrier Infrastructure, Automotive & Industrial, Consumer products.
- Exposure through complex integrated circuits and Ethernet solutions; operates globally in multiple countries.
Microchip Technology Incorporated
- Smaller market cap of 40.2B operating in competitive semiconductor markets.
- Concentrated on embedded control solutions, microcontrollers, licensing, and analog products.
- Exposure via embedded microcontrollers and specialized microprocessors across numerous applications worldwide.
Marvell Technology, Inc. vs Microchip Technology Incorporated Positioning
Marvell shows a diversified product portfolio with significant revenue from data center and networking, while Microchip focuses on embedded control and microcontroller solutions. Marvell’s broad segment exposure contrasts with Microchip’s more specialized technology licensing and semiconductor product concentration.
Which has the best competitive advantage?
Both companies have very unfavorable MOAT evaluations, with declining ROIC and value destruction. Neither currently demonstrates a sustainable competitive advantage based on ROIC versus WACC trends from 2021 to 2025.
Stock Comparison
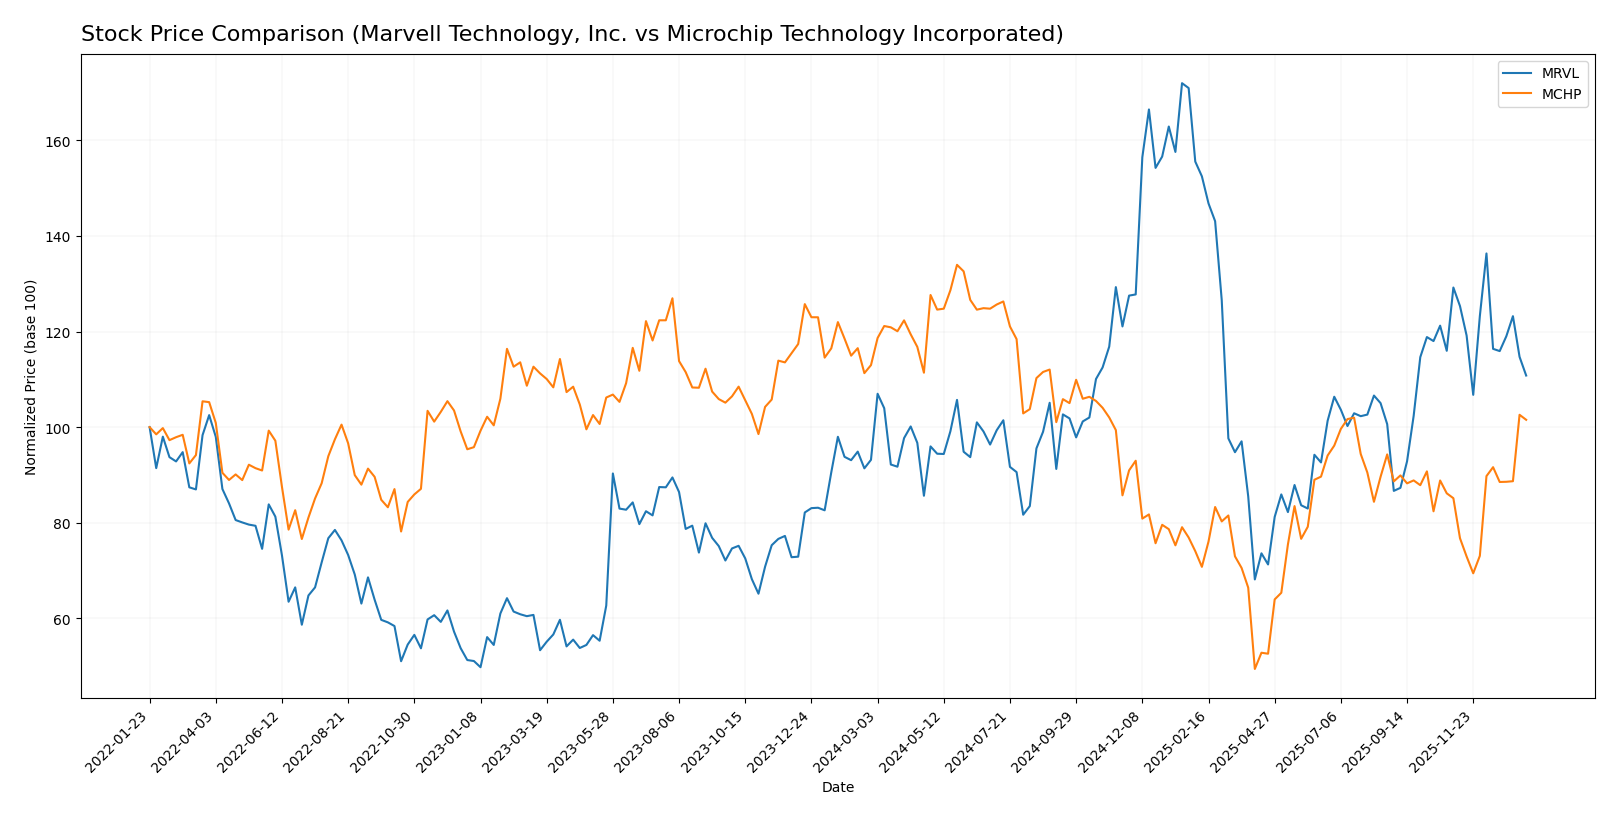
The stock prices of Marvell Technology, Inc. and Microchip Technology Incorporated have exhibited contrasting trends over the past 12 months, with notable price fluctuations and shifting trading dynamics in recent weeks.
Trend Analysis
Marvell Technology, Inc. showed a bullish trend over the past year with an 18.94% price increase, albeit with decelerating momentum and significant volatility indicated by a 16.46 std deviation. The stock peaked at 124.76 and bottomed at 49.43.
Microchip Technology Incorporated experienced a bearish trend with a 10.13% price decline over the year but showed accelerating momentum and moderate volatility (14.38 std deviation). Its highest price reached 98.23 while the lowest was 36.22.
Comparing both, Marvell Technology delivered the highest market performance with a positive 18.94% gain, outperforming Microchip’s negative 10.13% over the same 12-month period.
Target Prices
The current analyst consensus provides a cautiously optimistic outlook for these semiconductor companies.
| Company | Target High | Target Low | Consensus |
|---|---|---|---|
| Marvell Technology, Inc. | 156 | 80 | 117 |
| Microchip Technology Incorporated | 85 | 60 | 77.44 |
Analysts expect Marvell Technology’s stock price to rise significantly from its current 80.38 USD, while Microchip Technology’s target consensus of 77.44 USD also suggests modest upside from its present 74.45 USD.
Analyst Opinions Comparison
This section compares analysts’ ratings and grades for Marvell Technology, Inc. (MRVL) and Microchip Technology Incorporated (MCHP):
Rating Comparison
MRVL Rating
- Rating: B+ indicating a very favorable outlook.
- Discounted Cash Flow Score: Moderate at 3.
- ROE Score: Favorable at 4, showing efficient profit generation.
- ROA Score: Very favorable at 5, indicating excellent asset utilization.
- Debt To Equity Score: Moderate at 2, suggesting moderate financial risk.
- Overall Score: Moderate at 3, reflecting balanced financial standing.
MCHP Rating
- Rating: C- indicating a very unfavorable outlook.
- Discounted Cash Flow Score: Moderate at 3.
- ROE Score: Very unfavorable at 1, reflecting weak efficiency.
- ROA Score: Very unfavorable at 1, indicating poor asset use.
- Debt To Equity Score: Very unfavorable at 1, implying high financial risk.
- Overall Score: Very unfavorable at 1, indicating weak financial health.
Which one is the best rated?
Based strictly on the provided data, MRVL is clearly better rated with a B+ rating and stronger scores across ROE, ROA, and overall financial metrics compared to MCHP’s C- rating and mostly very unfavorable scores.
Scores Comparison
Here is a comparison of Marvell Technology and Microchip Technology scores:
Marvell Technology Scores
- Altman Z-Score: 6.76, in the safe zone, low risk of bankruptcy
- Piotroski Score: 7, indicating strong financial health
Microchip Technology Scores
- Altman Z-Score: 4.00, in the safe zone, low risk of bankruptcy
- Piotroski Score: 3, considered very weak financial strength
Which company has the best scores?
Marvell Technology shows a higher Altman Z-Score and a stronger Piotroski Score compared to Microchip Technology, indicating better overall financial health based on these metrics.
Grades Comparison
Here is a detailed comparison of the latest grades awarded to the two companies by recognized grading firms:
Marvell Technology, Inc. Grades
The table below shows recent grades from reputable financial analysts for Marvell Technology, Inc.:
| Grading Company | Action | New Grade | Date |
|---|---|---|---|
| Rosenblatt | Maintain | Buy | 2026-01-07 |
| Melius Research | Upgrade | Buy | 2026-01-05 |
| Benchmark | Downgrade | Hold | 2025-12-08 |
| B. Riley Securities | Maintain | Buy | 2025-12-03 |
| JP Morgan | Maintain | Overweight | 2025-12-03 |
| Susquehanna | Maintain | Positive | 2025-12-03 |
| Benchmark | Maintain | Buy | 2025-12-03 |
| Oppenheimer | Maintain | Outperform | 2025-12-03 |
| Stifel | Maintain | Buy | 2025-12-03 |
| Rosenblatt | Maintain | Buy | 2025-12-03 |
Marvell Technology’s grades mostly remain positive with multiple “Buy” and equivalent ratings, despite a single downgrade to “Hold” from Benchmark.
Microchip Technology Incorporated Grades
The table below summarizes recent grades from credible research firms for Microchip Technology Incorporated:
| Grading Company | Action | New Grade | Date |
|---|---|---|---|
| Piper Sandler | Maintain | Overweight | 2026-01-15 |
| B. Riley Securities | Maintain | Buy | 2026-01-12 |
| Mizuho | Maintain | Outperform | 2026-01-09 |
| Wells Fargo | Maintain | Equal Weight | 2026-01-07 |
| JP Morgan | Maintain | Overweight | 2026-01-06 |
| Morgan Stanley | Maintain | Equal Weight | 2026-01-06 |
| Stifel | Maintain | Buy | 2026-01-06 |
| Rosenblatt | Maintain | Buy | 2026-01-06 |
| Needham | Maintain | Buy | 2026-01-06 |
| Cantor Fitzgerald | Upgrade | Overweight | 2025-12-16 |
Microchip Technology shows a stable and generally positive rating trend with multiple “Buy” and “Overweight” ratings maintained or upgraded.
Which company has the best grades?
Both companies hold a consensus “Buy” rating from analysts. Marvell Technology has a larger number of “Buy” ratings but includes a few cautious views like “Hold.” Microchip Technology’s grades are steady with a combination of “Buy,” “Overweight,” and “Outperform,” showing fewer downgrades. Investors may note that both companies have strong analyst support, suggesting favorable market views but with minor variations in analyst conviction.
Strengths and Weaknesses
Below is a comparison of Marvell Technology, Inc. (MRVL) and Microchip Technology Incorporated (MCHP) based on key criteria relevant to investors.
| Criterion | Marvell Technology, Inc. (MRVL) | Microchip Technology Incorporated (MCHP) |
|---|---|---|
| Diversification | Revenue spread across Data Center (4.16B), Enterprise Networking (626M), Carrier Infrastructure (338M), Automotive & Industrial (322M), and Consumer (316M) | Predominantly Semiconductor Products (4.27B) with minor Technology Licensing (131M) |
| Profitability | Negative net margin (-15.35%), negative ROE (-6.59%), and declining ROIC (-3.88%) indicating value destruction | Near breakeven net margin (-0.01%), negative ROE (-0.01%), slightly negative ROIC (-0.03%), showing marginal profitability challenges |
| Innovation | Significant investment in Data Center and Networking segments suggests focus on advanced tech, but declining ROIC (-73%) implies innovation struggles | Stable semiconductor product revenues with slight decline in ROIC (-100%), indicating innovation pressure but steady core business |
| Global presence | Strong in Data Center and Networking globally, with diversified end markets | Broad semiconductor market exposure but less diversified by segment |
| Market Share | Leading in Data Center segment with 4.16B revenue, but overall declining profitability may impact competitive standing | Large semiconductor product revenue (4.27B) but slower growth and profitability challenges may affect market share |
Key takeaways: Both companies face profitability and value creation challenges, with Marvell showing greater diversification but sharper declines in returns. Microchip maintains steady core revenues but also struggles with profitability, suggesting cautious investment with focus on risk management.
Risk Analysis
Below is a comparative table highlighting key risk factors for Marvell Technology, Inc. (MRVL) and Microchip Technology Incorporated (MCHP) based on the most recent data from 2025.
| Metric | Marvell Technology, Inc. (MRVL) | Microchip Technology Incorporated (MCHP) |
|---|---|---|
| Market Risk | High beta at 1.945 indicates higher volatility than the market | Moderate beta at 1.445 suggests moderate market volatility |
| Debt Level | Low debt-to-equity ratio (0.32), favorable leverage | Moderate debt-to-equity ratio (0.80), neutral leverage risk |
| Regulatory Risk | Exposure to multiple countries including China and Taiwan increases regulatory complexity | Global operations but less geopolitical exposure than MRVL |
| Operational Risk | Negative net margin (-15.35%) and low asset turnover (0.29) highlight operational challenges | Nearly break-even net margin (-0.01%) with similar asset turnover (0.29) |
| Environmental Risk | Standard semiconductor industry risks, no major environmental concerns flagged | Similar industry exposure, no specific environmental risks noted |
| Geopolitical Risk | Significant presence in Asia-Pacific regions with geopolitical tensions | Less exposed but still affected by global semiconductor supply chain risks |
The most impactful and likely risks include Marvell’s high market volatility and negative profitability, which could pressure its stock price. Microchip shows operational strain with almost zero net margin and a weaker financial rating, posing moderate financial risk. Geopolitical tensions in Asia remain a key concern for both, especially Marvell due to its extensive exposure in sensitive regions. Investors should closely monitor profitability trends and geopolitical developments.
Which Stock to Choose?
Marvell Technology, Inc. (MRVL) shows a moderate market cap growth from 35.4B in 2021 to 97.7B in 2025, but with unfavorable profitability ratios including negative ROE (-6.59%) and ROIC (-3.88%). Its debt levels remain favorable, and it holds a very favorable rating of B+ despite an overall unfavorable income statement and declining moat.
Microchip Technology Incorporated (MCHP) presents a smaller market cap of 26B in 2025 with a bearish overall stock trend, slightly unfavorable financial ratios, and a very unfavorable overall income statement. Its debt indicators are neutral to unfavorable, and the company holds a lower rating of C- with signs of value destruction and a declining ROIC.
Investors focused on financial strength and moderate growth might see MRVL’s strong rating and safer financial scores as potential positives, while those more cautious about profitability trends and value creation might interpret MCHP’s metrics and recent recovery in price trend as signaling different opportunities depending on risk tolerance.
Disclaimer: Investment carries a risk of loss of initial capital. The past performance is not a reliable indicator of future results. Be sure to understand risks before making an investment decision.
Go Further
I encourage you to read the complete analyses of Marvell Technology, Inc. and Microchip Technology Incorporated to enhance your investment decisions: