Home > Comparison > Technology > MRVL vs MXL
The strategic rivalry between Marvell Technology, Inc. and MaxLinear, Inc. shapes the semiconductor industry’s evolution. Marvell exemplifies a large-scale, diversified chip designer with extensive Ethernet and storage solutions. MaxLinear operates as a focused innovator in RF and mixed-signal communications SoCs for connectivity infrastructure. This analysis contrasts their operational models to identify which offers superior risk-adjusted returns amid sector growth and technological integration. The goal: reveal the optimal portfolio choice.
Table of contents
Companies Overview
Marvell Technology and MaxLinear both occupy critical roles in the semiconductor sector, powering key communications infrastructure worldwide.
Marvell Technology, Inc.: Semiconductor Infrastructure Leader
Marvell Technology drives its core business by designing and selling integrated circuits across Ethernet, storage, and networking applications. Its revenue stems from high-performance controllers, ASICs, and application processors. In 2026, Marvell focuses strategically on expanding its Ethernet solutions and storage controller portfolio to reinforce its leadership in data center and cloud infrastructure markets.
MaxLinear, Inc.: Communications Systems Innovator
MaxLinear specializes in high-performance analog and mixed-signal SoCs for connected home and wireless infrastructure. Its revenue engine integrates RF front ends, data converters, and security engines into broadband modems and 4G/5G infrastructure. The company’s 2026 strategy emphasizes end-to-end communication platform solutions for wired and wireless networks, targeting growth through system integration and diversified market applications.
Strategic Collision: Similarities & Divergences
Both firms focus on semiconductor solutions for communication, but Marvell pursues a broad, scalable infrastructure approach, while MaxLinear adopts a highly integrated, system-level design philosophy. Their primary competition unfolds in network connectivity hardware. Marvell’s scale and Ethernet dominance contrast with MaxLinear’s niche in RF and broadband SoCs, defining distinct risk-return profiles for investors.
Income Statement Comparison
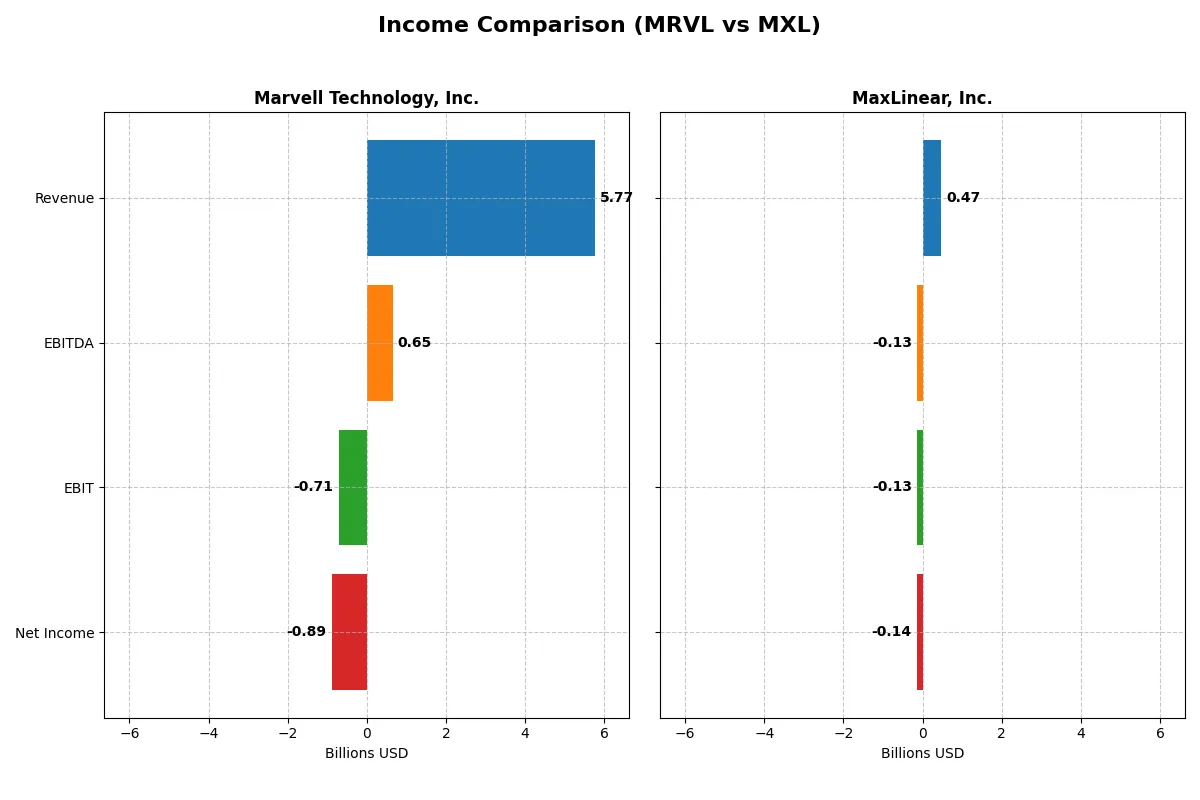
The following data dissects the core profitability and scalability of both corporate engines to reveal who dominates the bottom line:
| Metric | Marvell Technology, Inc. (MRVL) | MaxLinear, Inc. (MXL) |
|---|---|---|
| Revenue | 5.77B | 468M |
| Cost of Revenue | 3.39B | 202M |
| Operating Expenses | 3.10B | 393M |
| Gross Profit | 2.38B | 266M |
| EBITDA | 652M | -131M |
| EBIT | -705M | -131M |
| Interest Expense | 189M | 10M |
| Net Income | -885M | -137M |
| EPS | -1.02 | -1.58 |
| Fiscal Year | 2025 | 2025 |
Income Statement Analysis: The Bottom-Line Duel
This income statement comparison reveals how efficiently each company converts revenue into profit and manages operational costs under evolving market conditions.
Marvell Technology, Inc. Analysis
Marvell’s revenue climbed steadily to 5.77B in 2025, up 4.7% from 2024, reflecting solid top-line growth over five years. However, net income remains deep in the red at -885M, with a negative net margin of -15.35%. Gross margin holds firm at 41.3%, but operating losses widened, signaling challenges in controlling expenses despite revenue gains.
MaxLinear, Inc. Analysis
MaxLinear’s revenue rebounded strongly by 29.7% to 468M in 2025, after a sharp decline over the prior years. The company improved gross margin to 56.8%, outperforming Marvell on efficiency. Despite losses of -137M and a net margin of -29.2%, MaxLinear’s positive momentum in both revenue and EBIT growth indicates operational improvements underway.
Margin Strength vs. Growth Trajectory
Marvell delivers greater scale with consistent revenue growth but struggles with profitability and margin compression. MaxLinear shows more volatile revenue but superior gross margins and recent gains in earnings trajectory. For investors, Marvell’s scale offers stability, while MaxLinear’s improving margins highlight a turnaround story with higher risk and reward potential.
Financial Ratios Comparison
These vital ratios act as a diagnostic tool to expose the underlying fiscal health, valuation premiums, and capital efficiency of the companies compared:
| Ratios | Marvell Technology, Inc. (MRVL) | MaxLinear, Inc. (MXL) |
|---|---|---|
| ROE | -6.6% (2025) | -47.5% (2024) |
| ROIC | -3.9% (2025) | -24.3% (2024) |
| P/E | -110.4 (2025) | -6.7 (2024) |
| P/B | 7.27 (2025) | 3.20 (2024) |
| Current Ratio | 1.54 (2025) | 1.77 (2024) |
| Quick Ratio | 1.03 (2025) | 1.28 (2024) |
| D/E | 0.32 (2025) | 0.29 (2024) |
| Debt-to-Assets | 21.5% (2025) | 17.2% (2024) |
| Interest Coverage | -3.80 (2025) | -15.52 (2024) |
| Asset Turnover | 0.29 (2025) | 0.42 (2024) |
| Fixed Asset Turnover | 5.56 (2025) | 4.65 (2024) |
| Payout Ratio | -23.4% (2025) | 0% (2024) |
| Dividend Yield | 0.21% (2025) | 0% (2024) |
| Fiscal Year | 2025 | 2024 |
Efficiency & Valuation Duel: The Vital Signs
Financial ratios serve as the company’s DNA, exposing hidden risks and operational excellence beyond surface-level figures.
Marvell Technology, Inc.
Marvell shows weak profitability with a negative ROE of -6.59% and a net margin of -15.35%. Its valuation seems stretched with a negative P/E of -110.37 but a high P/B at 7.27. The company maintains a modest 0.21% dividend yield, signaling limited shareholder returns amid ongoing heavy R&D investment.
MaxLinear, Inc.
MaxLinear suffers from severe profitability issues, posting a -47.49% ROE and a -68.01% net margin. Its P/E is also negative at -6.74, suggesting market skepticism. The firm pays no dividends and channels significant resources into R&D (62.46% of revenue), reflecting a growth-driven but high-risk reinvestment strategy.
Profitability Struggles Amid High Valuations
Both companies face profitability headwinds with unfavorable returns and negative earnings yields. Marvell’s valuation is more stretched, while MaxLinear’s lower P/B ratio and lack of dividends point to deeper operational challenges. Investors seeking a balance between operational stability and growth might lean toward Marvell’s modest yield and R&D commitment, while MaxLinear fits a higher-risk growth profile.
Which one offers the Superior Shareholder Reward?
I compare Marvell Technology, Inc. (MRVL) and MaxLinear, Inc. (MXL) based on their shareholder reward strategies. Marvell offers a modest dividend yield around 0.35% with negative payout ratios, indicating dividends are covered by free cash flow, not earnings. Marvell also executes consistent buybacks, enhancing total returns despite recent profitability challenges. MaxLinear pays no dividends, reinvesting heavily in growth, as shown by negative free cash flow and erratic operating cash flow margins. MXL’s lack of buybacks and persistent losses raise sustainability concerns for shareholder reward. I find Marvell’s balanced dividend-plus-buyback model more sustainable and attractive for total return in 2026.
Comparative Score Analysis: The Strategic Profile
The radar chart reveals the fundamental DNA and trade-offs of Marvell Technology, Inc. and MaxLinear, Inc., illustrating their distinct financial strengths and weaknesses:
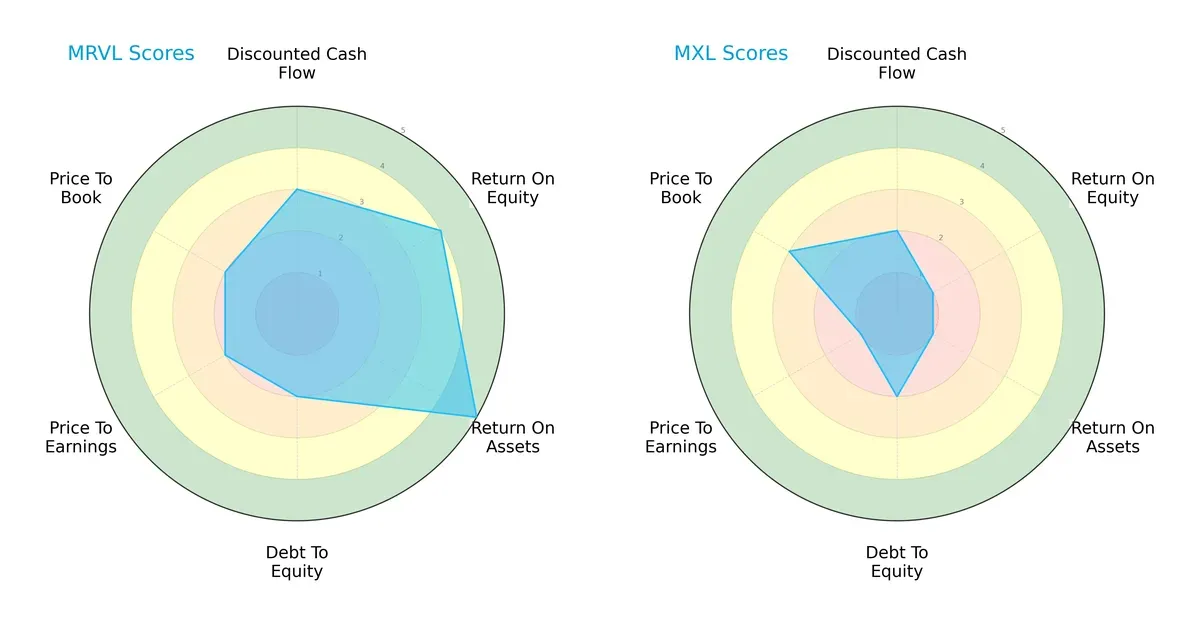
Marvell Technology shows a balanced profile with strong ROE (4) and ROA (5) scores, indicating efficient profit generation and asset use. MaxLinear relies heavily on moderate debt management (Debt/Equity score 2) but suffers from very weak profitability metrics (ROE 1, ROA 1). Marvell’s valuation scores (P/E and P/B at 2) suggest reasonable pricing, whereas MaxLinear’s low P/E (1) implies undervaluation but may indicate underlying risks. Overall, Marvell dominates with more consistent financial health and operational efficiency.
Bankruptcy Risk: Solvency Showdown
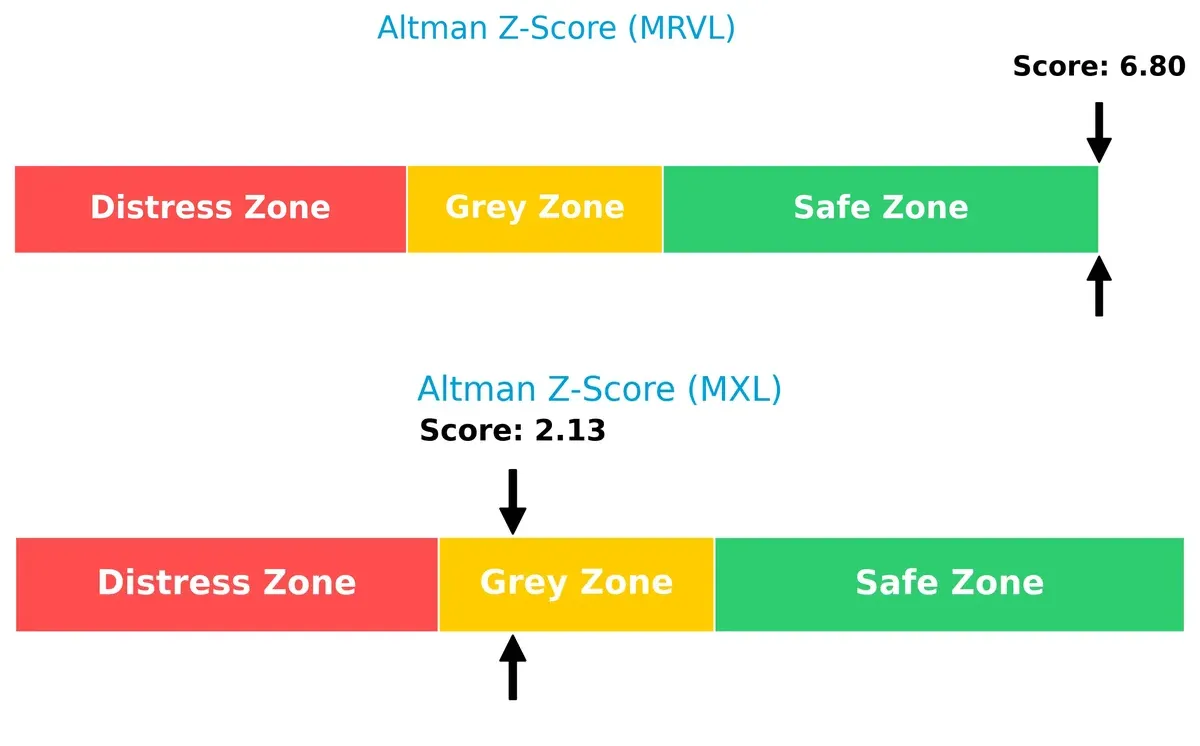
Marvell’s Altman Z-Score of 6.8 places it firmly in the safe zone, signaling robust solvency and a low bankruptcy risk. MaxLinear’s score of 2.13 lands in the grey zone, implying moderate financial distress and a higher vulnerability in the current market cycle:
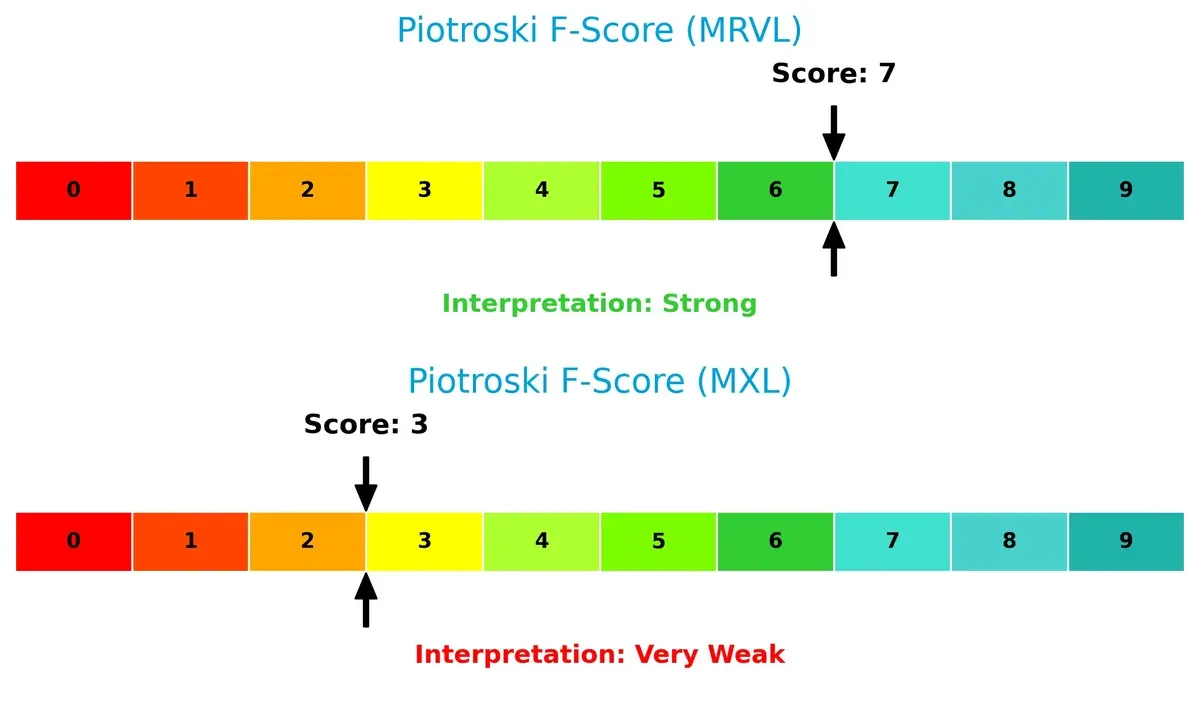
Financial Health: Quality of Operations
Marvell’s Piotroski F-Score of 7 signals strong financial health, reflecting solid profitability, liquidity, and operational efficiency. MaxLinear’s low score of 3 raises red flags, suggesting internal weaknesses and potential distress compared to Marvell’s robust metrics:
How are the two companies positioned?
This section dissects the operational DNA of Marvell and MaxLinear by comparing their revenue distribution by segment and internal dynamics, including strengths and weaknesses. The goal is to confront their economic moats to identify which model delivers the most resilient and sustainable competitive advantage today.
Revenue Segmentation: The Strategic Mix
This visual comparison dissects how Marvell Technology and MaxLinear diversify their income streams and where their primary sector bets lie:
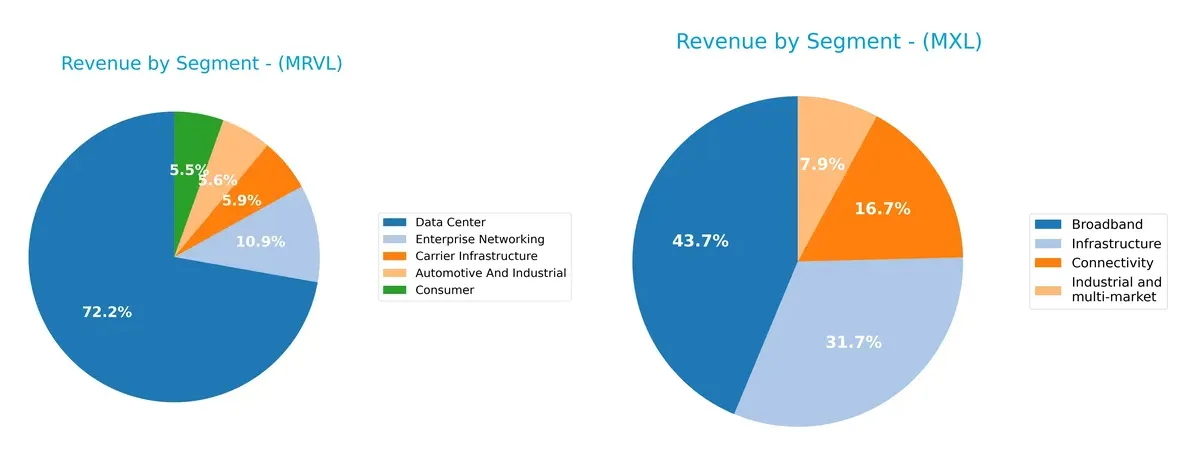
Marvell Technology anchors its revenue in Data Center with $4.16B, dwarfing other segments like Enterprise Networking at $626M. This concentration signals a strong ecosystem lock-in with infrastructure dominance. MaxLinear shows a more balanced mix, led by Broadband at $204M but with meaningful contributions from Infrastructure and Connectivity. MaxLinear’s diversification reduces concentration risk but limits scale compared to Marvell’s dominant data center footprint.
Strengths and Weaknesses Comparison
This table compares the Strengths and Weaknesses of Marvell Technology, Inc. and MaxLinear, Inc.:
Marvell Technology, Inc. Strengths
- Diverse revenue streams across Data Center, Enterprise Networking, Automotive and Industrial
- Solid global presence with significant sales in China and the US
- Favorable liquidity ratios indicate sound short-term financial health
- Low debt-to-assets ratio supports financial stability
- Strong fixed asset turnover suggests efficient use of property and equipment
MaxLinear, Inc. Strengths
- Diversified product segments including Broadband, Connectivity, and Infrastructure
- Favorable current and quick ratios reflect good short-term liquidity
- Conservative debt levels with low debt-to-assets ratio
- Efficient fixed asset utilization indicated by favorable turnover
- Global presence concentrated in Asia with some US exposure
Marvell Technology, Inc. Weaknesses
- Negative net margin, ROE, and ROIC demonstrate profitability challenges
- High WACC relative to returns implies value destruction
- Unfavorable interest coverage ratio indicates difficulty servicing debt
- Negative asset turnover points to underutilization of assets
- Elevated price-to-book ratio may suggest overvaluation
- Minimal dividend yield limits income appeal
MaxLinear, Inc. Weaknesses
- Significantly negative net margin, ROE, and ROIC highlight severe profitability issues
- High WACC exceeds returns, signaling poor capital efficiency
- Very weak interest coverage ratio raises financial risk concerns
- Unfavorable asset turnover shows inefficiency in asset use
- Zero dividend yield limits shareholder returns
- Lower price-to-book ratio but still unfavorable
Both companies suffer from profitability and capital efficiency weaknesses despite solid liquidity and asset use. Their diversified product lines and geographic reach support resilience. However, negative returns and high capital costs call for strategic focus on improving operational profitability and capital allocation.
The Moat Duel: Analyzing Competitive Defensibility
A structural moat alone shields long-term profits from relentless competitive pressure and market disruption. Let’s dissect the moats of two semiconductor players:
Marvell Technology, Inc.: Network Effects and Scale Economies
Marvell leverages network effects through integrated Ethernet and storage solutions, reflected in stable, above-40% gross margins. However, declining ROIC signals weakening capital efficiency, risking moat erosion in 2026 amid intensifying innovation demands.
MaxLinear, Inc.: Specialized Analog and Mixed-Signal Expertise
MaxLinear’s moat stems from specialized RF and high-performance analog SoCs, granting higher gross margins near 57%. Despite a sharper ROIC decline, recent double-digit revenue and profit growth suggest tactical agility to capture emerging 5G and broadband infrastructure niches.
Verdict: Network Effects vs. Niche Specialization
Both firms suffer value destruction as ROIC lags WACC significantly. Yet, Marvell’s broader product ecosystem offers a deeper moat, better cushioning it against disruption. MaxLinear’s narrower focus yields quicker gains but less durable defensibility. Marvell is better positioned to defend market share long term.
Which stock offers better returns?
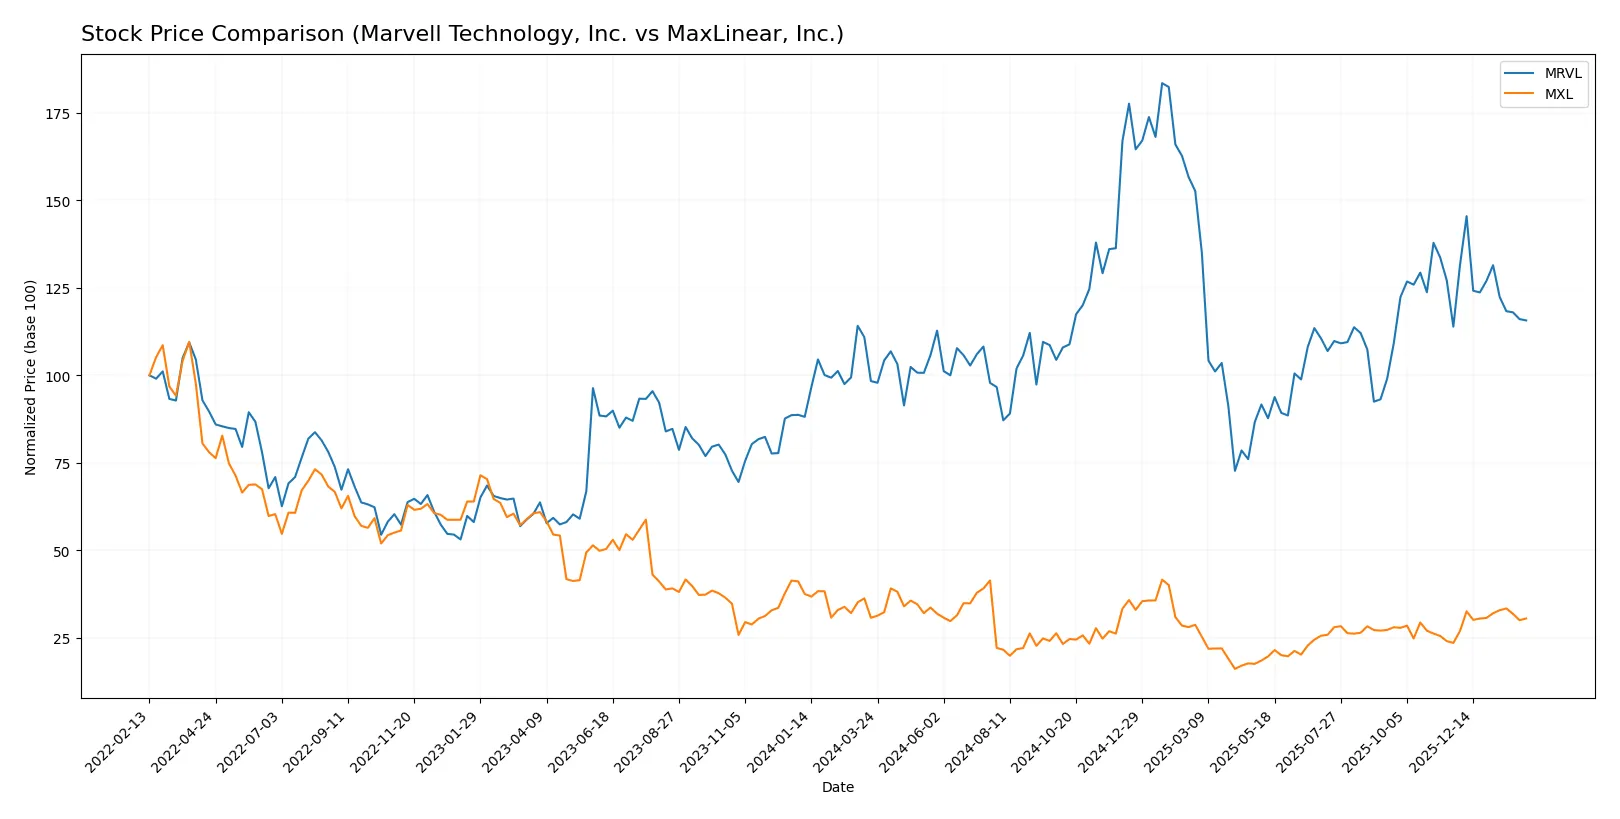
The past year shows distinct price movements for Marvell Technology and MaxLinear, highlighting divergent trading dynamics and momentum shifts.
Trend Comparison
Marvell Technology’s stock rose 17.63% over the past 12 months, indicating a bullish trend with decelerating momentum. Price volatility is high, ranging from 49.43 to 124.76.
MaxLinear’s stock declined 0.62% over the same period, signaling a bearish trend but with accelerating movement. Price fluctuated between 9.31 and 24.05, showing lower volatility.
Marvell delivered stronger overall market performance, despite recent mild deceleration, while MaxLinear’s trend is bearish but gained notable recent strength.
Target Prices
Analysts present a moderately optimistic consensus for Marvell Technology and MaxLinear, reflecting growth expectations in semiconductors.
| Company | Target Low | Target High | Consensus |
|---|---|---|---|
| Marvell Technology, Inc. | 80 | 156 | 117 |
| MaxLinear, Inc. | 15 | 25 | 21 |
Marvell’s consensus target sits about 49% above its current price of 78.66, signaling potential upside. MaxLinear’s consensus target also exceeds its current price of 17.64 by nearly 19%, indicating moderate analyst confidence.

Don’t Let Luck Decide Your Entry Point
Optimize your entry points with our advanced ProRealTime indicators. You’ll get efficient buy signals with precise price targets for maximum performance. Start outperforming now!
How do institutions grade them?
The following tables summarize the latest grades assigned to Marvell Technology, Inc. and MaxLinear, Inc. by reputable grading companies:
Marvell Technology, Inc. Grades
This table displays recent grade updates from recognized financial institutions for Marvell Technology, Inc.
| Grading Company | Action | New Grade | Date |
|---|---|---|---|
| Rosenblatt | Maintain | Buy | 2026-01-07 |
| Melius Research | Upgrade | Buy | 2026-01-05 |
| Benchmark | Downgrade | Hold | 2025-12-08 |
| JP Morgan | Maintain | Overweight | 2025-12-03 |
| Rosenblatt | Maintain | Buy | 2025-12-03 |
| Roth Capital | Maintain | Buy | 2025-12-03 |
| Oppenheimer | Maintain | Outperform | 2025-12-03 |
| B. Riley Securities | Maintain | Buy | 2025-12-03 |
| Wells Fargo | Maintain | Overweight | 2025-12-03 |
| Susquehanna | Maintain | Positive | 2025-12-03 |
MaxLinear, Inc. Grades
This table outlines recent grade assessments from established financial firms for MaxLinear, Inc.
| Grading Company | Action | New Grade | Date |
|---|---|---|---|
| Wells Fargo | Maintain | Equal Weight | 2026-01-30 |
| Benchmark | Maintain | Buy | 2026-01-16 |
| Benchmark | Maintain | Buy | 2025-10-24 |
| Benchmark | Maintain | Buy | 2025-10-17 |
| Benchmark | Maintain | Buy | 2025-09-02 |
| Loop Capital | Maintain | Hold | 2025-08-04 |
| Wells Fargo | Maintain | Equal Weight | 2025-07-24 |
| Benchmark | Maintain | Buy | 2025-07-24 |
| Susquehanna | Maintain | Neutral | 2025-07-24 |
| Susquehanna | Maintain | Neutral | 2025-07-22 |
Which company has the best grades?
Marvell Technology, Inc. holds predominantly Buy and Outperform ratings, indicating stronger institutional confidence. MaxLinear, Inc. presents a mix of Buy and Equal Weight grades, reflecting more cautious endorsements. Investors may interpret Marvell’s higher-grade frequency as a signal of greater market favorability.
Risks specific to each company
The following categories identify the critical pressure points and systemic threats facing both firms in the 2026 market environment:
1. Market & Competition
Marvell Technology, Inc.
- Larger market cap and diversified product portfolio provide stronger competitive positioning.
MaxLinear, Inc.
- Smaller scale and niche focus limit competitive moats amid intense semiconductor rivalry.
2. Capital Structure & Debt
Marvell Technology, Inc.
- Moderate debt-to-equity at 0.32 and favorable debt ratios imply manageable leverage risk.
MaxLinear, Inc.
- Slightly lower debt-to-equity at 0.29 but weaker interest coverage signals potential debt servicing challenges.
3. Stock Volatility
Marvell Technology, Inc.
- Beta near 1.98 indicates higher sensitivity to market swings, increasing volatility risk.
MaxLinear, Inc.
- Lower beta at 1.71 suggests comparatively reduced but still elevated volatility exposure.
4. Regulatory & Legal
Marvell Technology, Inc.
- Global operations in sensitive regions like China and Taiwan increase regulatory complexity.
MaxLinear, Inc.
- US-centric operations reduce geopolitical regulatory risk but expose company to domestic policy shifts.
5. Supply Chain & Operations
Marvell Technology, Inc.
- Extensive Asia-Pacific presence risks supply chain disruptions amid geopolitical tensions.
MaxLinear, Inc.
- Smaller global footprint and focused product lines limit supply chain complexity but increase dependency on key suppliers.
6. ESG & Climate Transition
Marvell Technology, Inc.
- Larger firm likely faces greater ESG scrutiny; transition risks could impact costs and reputation.
MaxLinear, Inc.
- Smaller scale may ease ESG compliance but limits resources to invest in sustainable innovations.
7. Geopolitical Exposure
Marvell Technology, Inc.
- Operations in multiple Asian countries expose firm to trade tensions and cross-border risks.
MaxLinear, Inc.
- Concentrated US base reduces direct geopolitical exposure but limits diversification benefits.
Which company shows a better risk-adjusted profile?
Marvell’s main risk is its complex global supply chain amid geopolitical tensions. MaxLinear suffers from severe profitability and financial distress signals. Marvell’s robust Altman Z-Score (6.8, safe zone) contrasts with MaxLinear’s borderline Grey Zone (2.13). Marvell thus exhibits a superior risk-adjusted profile despite higher market volatility. The widening gap in interest coverage ratios highlights MaxLinear’s financial strain as a key concern for investors.
Final Verdict: Which stock to choose?
Marvell Technology’s superpower lies in its scale and operational efficiency, manifesting in robust gross margins and a sizable market footprint. However, its declining profitability and value destruction signal a point of vigilance. It suits investors comfortable with cyclical tech exposure and aggressive growth ambitions.
MaxLinear’s strategic moat is its niche focus and solid gross margins, which provide a recurring revenue safety net. Relative to Marvell, it offers a more conservative balance sheet and a stronger recent income statement trajectory. It fits portfolios seeking growth at a reasonable price with a tilt toward stability.
If you prioritize scale and market leadership in semiconductor technology, Marvell outshines due to its dominant operational platform despite current profitability challenges. However, if you seek steadier financial health and improving earnings momentum in a smaller-cap context, MaxLinear offers better stability and a more cautious growth profile. Both require careful risk management given their financial headwinds.
Disclaimer: Investment carries a risk of loss of initial capital. The past performance is not a reliable indicator of future results. Be sure to understand risks before making an investment decision.
Go Further
I encourage you to read the complete analyses of Marvell Technology, Inc. and MaxLinear, Inc. to enhance your investment decisions: