In the competitive world of construction materials, Vulcan Materials Company (VMC) and Martin Marietta Materials, Inc. (MLM) stand out as industry leaders. Both companies supply essential aggregates and building products, serving infrastructure and commercial projects across the United States. Their overlapping markets and innovation in sustainable materials make them prime candidates for comparison. Join me as we analyze which of these giants offers the most compelling opportunity for your investment portfolio.

Table of contents
Companies Overview
I will begin the comparison between Vulcan Materials Company and Martin Marietta Materials, Inc. by providing an overview of these two companies and their main differences.
Vulcan Materials Company Overview
Vulcan Materials Company, founded in 1909 and headquartered in Birmingham, Alabama, produces and supplies construction aggregates primarily in the United States. It operates through four segments: Aggregates, Asphalt, Concrete, and Calcium, serving infrastructure, housing, and industrial construction markets. The company focuses on crushed stones, sand, gravel, asphalt mix, ready-mixed concrete, and calcium products for various industries.
Martin Marietta Materials, Inc. Overview
Martin Marietta Materials, Inc., established in 1939 and based in Raleigh, North Carolina, supplies aggregates and heavy-side building materials both in the U.S. and internationally. Its product range includes crushed stone, sand, gravel, ready-mixed concrete, asphalt, paving products, specialty cement, and magnesia-based chemicals. The company serves infrastructure, residential, nonresidential construction, railroad, agricultural, utility, and environmental sectors.
Key similarities and differences
Both companies operate in the construction materials industry with a focus on aggregates, concrete, and asphalt products primarily in the U.S. Vulcan has a specific Calcium segment targeting animal feed and water treatment, while Martin Marietta offers a broader chemical product line including magnesia-based chemicals for industrial and environmental uses. Vulcan’s operations concentrate on domestic markets, whereas Martin Marietta extends its reach internationally. Both are NYSE-listed with comparable market caps around 39B and 38B respectively.
Income Statement Comparison
The table below presents a side-by-side comparison of key income statement metrics for Vulcan Materials Company and Martin Marietta Materials, Inc. for the fiscal year 2024.

| Metric | Vulcan Materials Company (VMC) | Martin Marietta Materials, Inc. (MLM) |
|---|---|---|
| Market Cap | 39.5B | 38.4B |
| Revenue | 7.42B | 6.54B |
| EBITDA | 1.98B | 3.34B |
| EBIT | 1.36B | 2.77B |
| Net Income | 912M | 1.99B |
| EPS | 6.89 | 32.5 |
| Fiscal Year | 2024 | 2024 |
Income Statement Interpretations
Vulcan Materials Company
Vulcan Materials Company showed a 53% revenue increase from 2020 to 2024, alongside a 56% net income growth. Margins remained relatively stable with a gross margin near 27% and net margin around 12%. However, 2024 saw a slight revenue decline of 4.7% and a modest 2.5% rise in net margin, indicating mixed recent performance.
Martin Marietta Materials, Inc.
Martin Marietta experienced a 38% revenue growth and a remarkable 177% net income increase over five years. The company maintains stronger margins, with gross margin close to 29% and net margin above 30%. Despite a 3.6% revenue dip in 2024, EBIT and net margin surged significantly, reflecting improved profitability last year.
Which one has the stronger fundamentals?
Martin Marietta displays stronger fundamentals with higher margins, robust net income growth, and favorable profitability trends, especially in the latest year. Vulcan shows solid growth and stable margins but faced recent revenue contraction and less pronounced margin improvements. Overall, Martin Marietta presents more consistent favorable income statement indicators.
Financial Ratios Comparison
The following table presents a side-by-side comparison of key financial ratios for Vulcan Materials Company (VMC) and Martin Marietta Materials, Inc. (MLM) for the fiscal year ended 2024, providing insights into their profitability, liquidity, leverage, and market valuation.
| Ratios | Vulcan Materials Company (VMC) | Martin Marietta Materials, Inc. (MLM) |
|---|---|---|
| ROE | 11.2% | 21.1% |
| ROIC | 6.6% | 12.0% |
| P/E | 37.3 | 15.9 |
| P/B | 4.19 | 3.35 |
| Current Ratio | 1.83 | 2.50 |
| Quick Ratio | 1.28 | 1.40 |
| D/E | 0.72 | 0.61 |
| Debt-to-Assets | 34.1% | 31.9% |
| Interest Coverage | 7.14 | 16.0 |
| Asset Turnover | 0.43 | 0.36 |
| Fixed Asset Turnover | 0.83 | 0.62 |
| Payout ratio | 26.8% | 9.5% |
| Dividend yield | 0.72% | 0.60% |
Interpretation of the Ratios
Vulcan Materials Company
Vulcan Materials shows a balanced mix of strong and weak ratios, with favorable net margin (12.29%) and current liquidity ratios, but unfavorable valuation multiples like PE (37.32) and PB (4.19). Its dividend yield is modest at 0.72%, suggesting cautious shareholder returns. The payout appears covered but with risks from high valuation and asset turnover concerns.
Martin Marietta Materials, Inc.
Martin Marietta’s ratios generally outperform, with very favorable profitability measures: net margin at 30.52%, ROE 21.1%, and ROIC 12.01%. Liquidity and interest coverage are also strong. Despite a low dividend yield of 0.6%, the company maintains a slight favorable rating overall, with some concerns over valuation (PB 3.35) and asset turnover metrics.
Which one has the best ratios?
Martin Marietta Materials holds a slight advantage with more favorable profitability and liquidity ratios, and a lower PE relative to Vulcan Materials. Vulcan presents a more neutral profile due to mixed ratio signals and higher valuation multiples. Both show weaknesses in asset turnover and modest dividend yields, but Martin Marietta’s stronger returns underline its more favorable ratio standing.
Strategic Positioning
This section compares the strategic positioning of Vulcan Materials Company and Martin Marietta Materials, Inc. regarding market position, key segments, and exposure to technological disruption:
Vulcan Materials Company
- Leading US aggregates producer facing typical construction industry competition.
- Operates four segments: Aggregates, Asphalt, Concrete, Calcium products.
- Limited explicit exposure to technological disruption mentioned.
Martin Marietta Materials, Inc.
- Major US and international supplier of aggregates and building materials.
- Focuses on building materials and magnesia specialties with diversified industrial uses.
- No explicit technological disruption exposure detailed.
Vulcan Materials Company vs Martin Marietta Materials, Inc. Positioning
Vulcan Materials shows a diversified segment approach including calcium products, while Martin Marietta concentrates mainly on building materials and specialty chemicals. Vulcan’s broader segment mix contrasts with Martin Marietta’s geographic and product scope diversification.
Which has the best competitive advantage?
Martin Marietta demonstrates a strong and durable competitive advantage with ROIC above WACC and a significant growth trend, unlike Vulcan Materials, which is slightly unfavorable despite improving profitability.
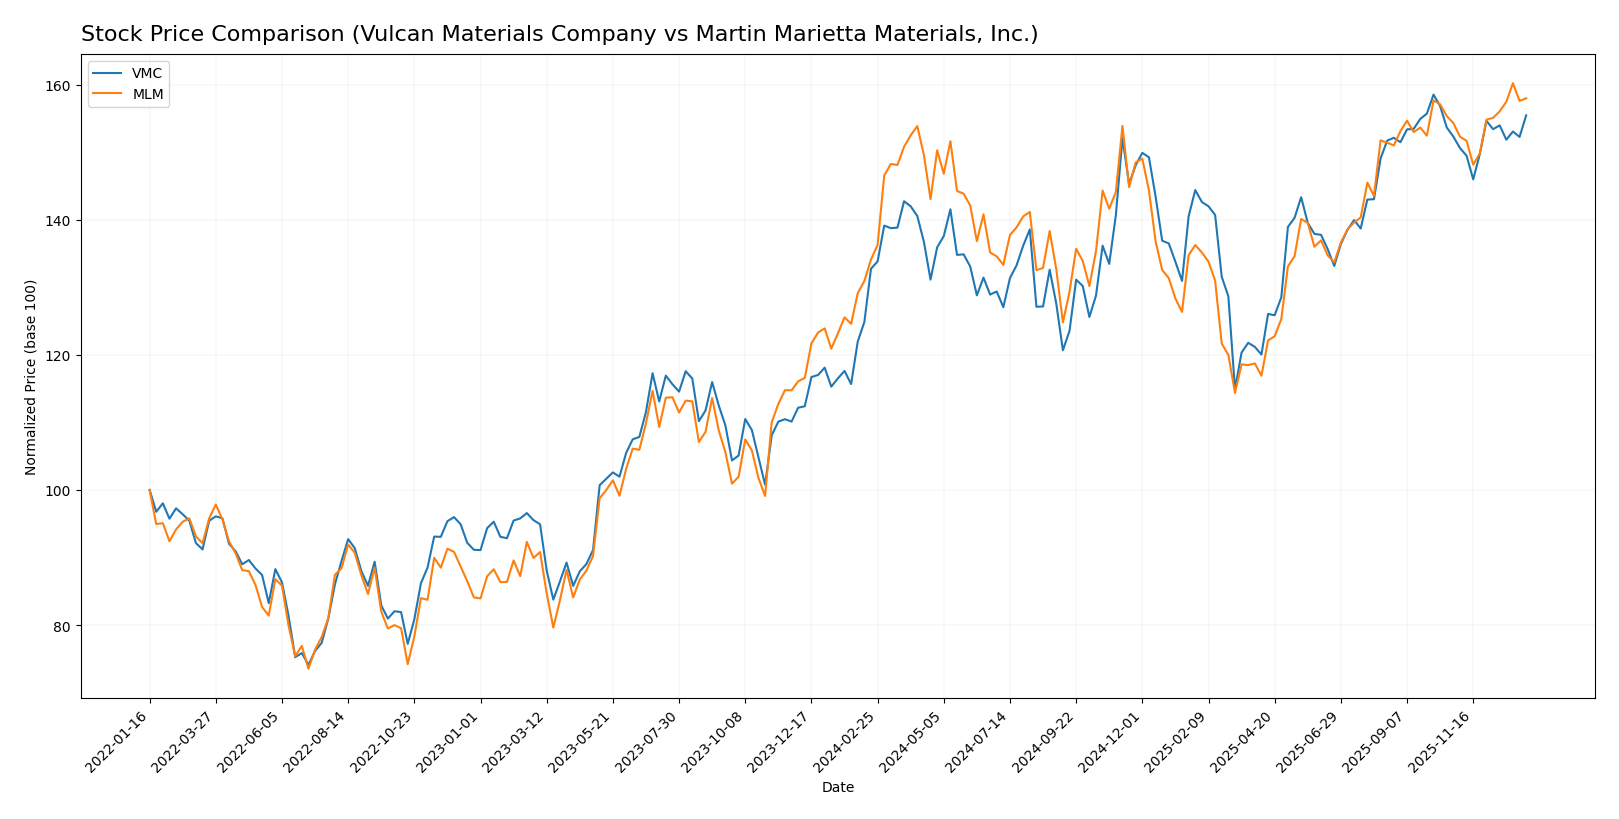
Stock Comparison
Over the past 12 months, both Vulcan Materials Company and Martin Marietta Materials, Inc. exhibited strong bullish trends marked by accelerating price gains, with Martin Marietta showing higher volatility and a steeper recent upward slope.
Trend Analysis
Vulcan Materials Company’s stock rose 17.1% over the past year, confirming a bullish trend with accelerating momentum. The price fluctuated between 220.9 and 304.7, with a standard deviation of 19.39 indicating moderate volatility.
Martin Marietta Materials, Inc. recorded a 17.81% gain over the same period, also bullish with acceleration. Its price ranged from 460.39 to 645.01, accompanied by higher volatility at 44.3 standard deviation.
Comparing the two, Martin Marietta delivered a slightly higher market performance and greater price volatility than Vulcan Materials over the past year.
Target Prices
Analysts present a confident target price consensus for Vulcan Materials Company and Martin Marietta Materials, Inc.
| Company | Target High | Target Low | Consensus |
|---|---|---|---|
| Vulcan Materials Company | 330 | 311 | 322 |
| Martin Marietta Materials, Inc. | 730 | 620 | 690 |
The consensus targets suggest moderate upside potential for both stocks compared to their current prices of $298.77 (VMC) and $636.25 (MLM), indicating positive analyst sentiment amid construction materials sector dynamics.
Analyst Opinions Comparison
This section compares analysts’ ratings and grades for Vulcan Materials Company (VMC) and Martin Marietta Materials, Inc. (MLM):
Rating Comparison
VMC Rating
- Rating: B, considered Very Favorable overall.
- Discounted Cash Flow Score: 4, Favorable indication of valuation.
- ROE Score: 5, Very Favorable, showing high efficiency in generating profit.
- ROA Score: 5, Very Favorable, effective asset utilization.
- Debt To Equity Score: 1, Very Unfavorable, indicates high financial risk.
- Overall Score: 3, Moderate overall financial standing.
MLM Rating
- Rating: B, considered Very Favorable overall.
- Discounted Cash Flow Score: 4, Favorable indication of valuation.
- ROE Score: 4, Favorable, indicating good profit generation efficiency.
- ROA Score: 5, Very Favorable, similarly effective asset utilization.
- Debt To Equity Score: 1, Very Unfavorable, indicating high financial risk.
- Overall Score: 3, Moderate overall financial standing.
Which one is the best rated?
Both VMC and MLM share the same overall rating of B and an equal overall score of 3. VMC has a higher ROE score of 5 compared to MLM’s 4, while both have identical DCF, ROA, and debt to equity scores. Thus, VMC is slightly better rated on profitability metrics.
Scores Comparison
Here is a comparison of the Altman Z-Score and Piotroski Score for Vulcan Materials Company and Martin Marietta Materials, Inc.:
VMC Scores
- Altman Z-Score: 4.12, indicating a safe zone status.
- Piotroski Score: 6, showing average financial strength.
MLM Scores
- Altman Z-Score: 3.82, indicating a safe zone status.
- Piotroski Score: 7, showing strong financial strength.
Which company has the best scores?
MLM has a slightly lower Altman Z-Score but still in the safe zone, and a higher Piotroski Score indicating stronger financial health compared to VMC. Based on these scores, MLM appears financially stronger.
Grades Comparison
Here is a comparison of the latest stock grades from reputable grading companies for both companies:
Vulcan Materials Company Grades
The table below summarizes recent grades assigned by well-known financial institutions for Vulcan Materials Company:
| Grading Company | Action | New Grade | Date |
|---|---|---|---|
| DA Davidson | Maintain | Buy | 2025-11-04 |
| Citigroup | Maintain | Buy | 2025-11-03 |
| RBC Capital | Maintain | Sector Perform | 2025-10-31 |
| JP Morgan | Maintain | Overweight | 2025-10-21 |
| Raymond James | Maintain | Outperform | 2025-10-21 |
| Barclays | Maintain | Overweight | 2025-10-20 |
| JP Morgan | Maintain | Overweight | 2025-08-26 |
| Citigroup | Maintain | Buy | 2025-08-04 |
| UBS | Maintain | Buy | 2025-08-01 |
| Barclays | Maintain | Overweight | 2025-08-01 |
Overall, Vulcan Materials Company shows a consistent pattern of buy and overweight ratings, indicating general positive sentiment among analysts.
Martin Marietta Materials, Inc. Grades
The table below summarizes recent grades assigned by well-established grading firms for Martin Marietta Materials, Inc.:
| Grading Company | Action | New Grade | Date |
|---|---|---|---|
| Morgan Stanley | Maintain | Overweight | 2025-12-22 |
| Jefferies | Maintain | Buy | 2025-12-15 |
| Morgan Stanley | Maintain | Overweight | 2025-12-01 |
| Stifel | Maintain | Buy | 2025-11-11 |
| JP Morgan | Maintain | Neutral | 2025-11-11 |
| UBS | Maintain | Buy | 2025-11-07 |
| Wells Fargo | Maintain | Equal Weight | 2025-11-06 |
| Raymond James | Maintain | Outperform | 2025-10-21 |
| Barclays | Maintain | Overweight | 2025-10-20 |
| Stifel | Maintain | Buy | 2025-08-12 |
Martin Marietta Materials, Inc. also receives mostly buy and overweight grades, with some neutral and equal weight ratings, reflecting a broadly positive but slightly more mixed analyst consensus.
Which company has the best grades?
Both Vulcan Materials Company and Martin Marietta Materials, Inc. receive predominantly buy and overweight ratings, with no sell or strong sell grades. Vulcan Materials shows a slightly higher concentration of buy and overweight grades, suggesting marginally stronger analyst confidence. This may influence investors seeking stocks with stable positive analyst sentiment.
Strengths and Weaknesses
Below is a comparison table highlighting key strengths and weaknesses of Vulcan Materials Company (VMC) and Martin Marietta Materials, Inc. (MLM) based on recent financial and operational data.
| Criterion | Vulcan Materials Company (VMC) | Martin Marietta Materials, Inc. (MLM) |
|---|---|---|
| Diversification | Moderate product diversification with strong reliance on Aggregates (5.95B USD in 2024) and Asphalt (1.25B USD) | Focused mainly on Building Materials (6.22B USD) with smaller Magnesia Specialties segment (320M USD) |
| Profitability | Net Margin 12.29% (favorable), ROIC 6.59% (neutral), currently shedding value (ROIC < WACC) but improving | Net Margin 30.52% (favorable), ROIC 12.01% (favorable), creating value with strong profitability growth |
| Innovation | Limited innovation indicated, traditional materials business with stable but modest asset turnover | Innovation less emphasized, but strong operational efficiency reflected in growing ROIC trend |
| Global presence | Primarily US-focused with regional operations | Mainly US-focused, but with a slightly broader product range targeting niche markets like Magnesia |
| Market Share | Leading position in aggregates and asphalt markets | Strong market share in building materials, supported by consistent revenue growth |
Key takeaways: MLM stands out with superior profitability and value creation, supported by a very favorable competitive moat and growing ROIC. VMC shows improving profitability but currently destroys value, reflecting mixed financial health. Investors seeking stable growth and value creation may prefer MLM, while cautious monitoring is advised for VMC.
Risk Analysis
Below is a comparison of key risks for Vulcan Materials Company (VMC) and Martin Marietta Materials, Inc. (MLM) based on the most recent 2024 data:
| Metric | Vulcan Materials Company (VMC) | Martin Marietta Materials, Inc. (MLM) |
|---|---|---|
| Market Risk | Beta 1.06, moderate exposure to market volatility | Beta 1.16, slightly higher market sensitivity |
| Debt Level | Debt-to-Equity 0.72, neutral risk with moderate leverage | Debt-to-Equity 0.61, slightly lower leverage, neutral risk |
| Regulatory Risk | Moderate, subject to US construction and environmental regulations | Moderate, similar regulatory environment in US and international markets |
| Operational Risk | Unfavorable asset turnover and fixed asset turnover | Similar operational efficiency challenges, lower asset turnover ratios |
| Environmental Risk | Exposure due to mining and aggregates production, subject to sustainability pressures | Similar environmental challenges with chemical product lines adding complexity |
| Geopolitical Risk | Primarily US-focused, limited geopolitical risk | US and some international exposure, slightly increased geopolitical considerations |
Both companies face typical industry risks such as regulatory and environmental pressures due to their activities in construction materials and mining. Market risk remains moderate with betas slightly above 1, indicating sensitivity to market swings. Operational risks are notable given below-average asset turnover metrics. Debt levels are manageable but require monitoring. Environmental regulations remain the most impactful risk, especially as sustainability demands increase.
Which Stock to Choose?
Vulcan Materials Company (VMC) shows a favorable income evolution over 2020-2024 with a 52.7% revenue growth and 56% net income increase. Its financial ratios are mixed, with strong liquidity and interest coverage but unfavorable valuation multiples. Profitability is moderate, and debt levels are neutral. The company holds a very favorable B rating.
Martin Marietta Materials, Inc. (MLM) exhibits strong income growth, notably a 176.7% net income increase and 180.9% EPS growth over the period. Financial ratios are slightly favorable, supported by excellent profitability and liquidity metrics, though some valuation ratios remain unfavorable. Debt is managed neutrally, and MLM also has a very favorable B rating.
Considering ratings and comprehensive financials, MLM’s superior profitability and income growth might appeal to growth-oriented investors, while VMC’s stable liquidity and moderate profitability could be more suitable for risk-averse profiles. Both companies display positive outlooks, with MLM showing a very favorable moat and VMC a slightly unfavorable moat despite improving profitability.
Disclaimer: Investment carries a risk of loss of initial capital. The past performance is not a reliable indicator of future results. Be sure to understand risks before making an investment decision.
Go Further
I encourage you to read the complete analyses of Vulcan Materials Company and Martin Marietta Materials, Inc. to enhance your investment decisions: