Home > Comparison > Financial Services > MMC vs WTW
The strategic rivalry between Marsh & McLennan Companies, Inc. and Willis Towers Watson Public Limited Company defines the current trajectory of the insurance brokerage sector. Marsh & McLennan operates as a global professional services powerhouse, blending risk management and consulting, while Willis Towers Watson combines advisory with advanced risk and benefits solutions. This analysis will reveal which business model offers superior risk-adjusted returns for a diversified portfolio amid evolving industry dynamics.
Table of contents
Companies Overview
Marsh & McLennan Companies and Willis Towers Watson shape the global insurance brokerage market with distinct strengths.
Marsh & McLennan Companies, Inc.: Global Risk and Consulting Leader
Marsh & McLennan Companies dominates the insurance brokerage and consulting sector. Its core revenue derives from risk management, insurance broking, and consulting services spanning health, wealth, and career advice. In 2026, the company emphasizes integrated risk solutions and advisory excellence to serve diverse clients worldwide, leveraging its broad expertise and legacy since 1871.
Willis Towers Watson Public Limited Company: Advisory and Broking Specialist
Willis Towers Watson excels as a global advisory, broking, and solutions provider. It generates revenue through actuarial services, risk advice, insurance brokerage, and benefits outsourcing. The firm’s 2026 strategy focuses on delivering data-driven solutions for health, wealth, and career management, alongside advanced risk and capital modeling, reinforcing its position in insurance consulting and technology innovation.
Strategic Collision: Similarities & Divergences
Both firms compete fiercely in risk advisory and insurance brokerage, yet their philosophies diverge. Marsh & McLennan prioritizes a broad consulting ecosystem, while Willis Towers Watson leans into data analytics and technology-driven benefits management. Their battleground centers on integrating risk solutions with employee benefits. Investors should note the larger scale and diversified consulting strength of Marsh versus Willis Tower Watson’s focused innovation in actuarial and benefits services.
Income Statement Comparison
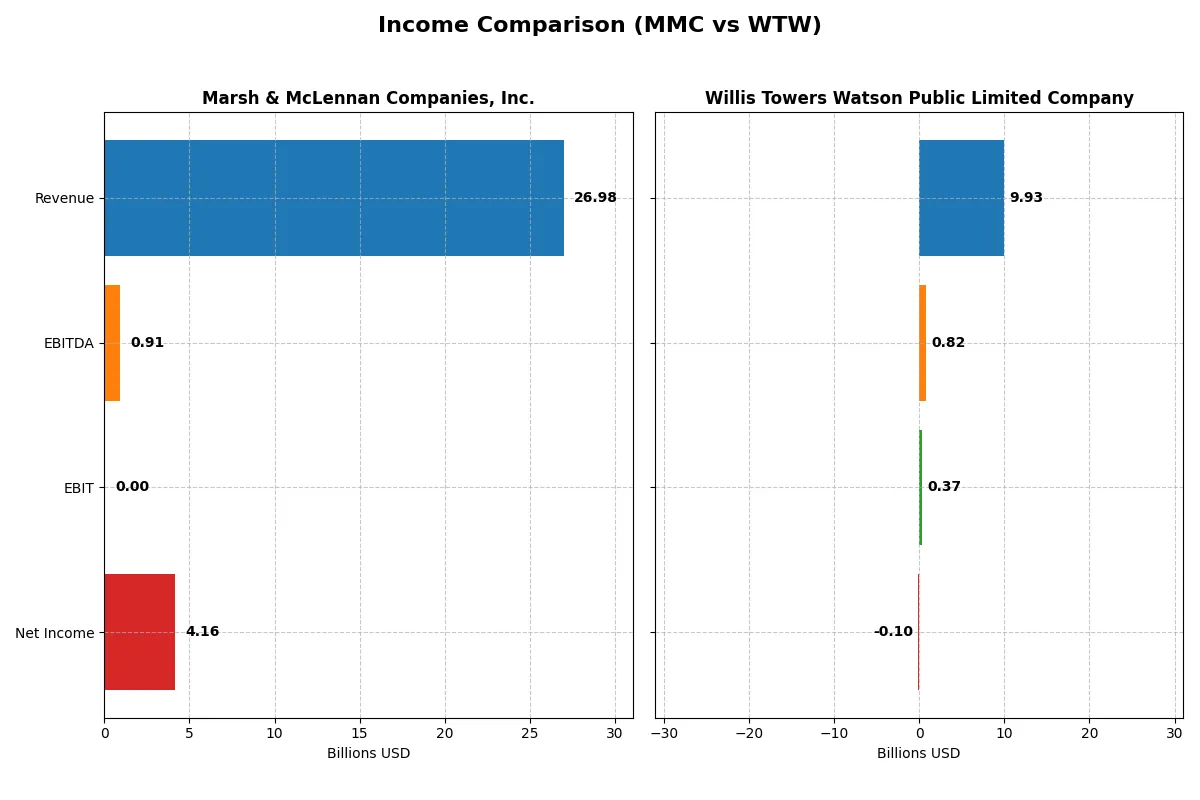
The following data dissects the core profitability and scalability of both corporate engines to reveal who dominates the bottom line:
| Metric | Marsh & McLennan Companies, Inc. (MMC) | Willis Towers Watson Public Limited Company (WTW) |
|---|---|---|
| Revenue | 27B | 9.93B |
| Cost of Revenue | 0 | 5.5B |
| Operating Expenses | 20.76B | 3.8B |
| Gross Profit | 0 | 4.43B |
| EBITDA | 910M | 823M |
| EBIT | 0 | 367M |
| Interest Expense | 960M | 263M |
| Net Income | 4.16B | -98M |
| EPS | 8.48 | -0.96 |
| Fiscal Year | 2025 | 2024 |
Income Statement Analysis: The Bottom-Line Duel
The forthcoming income statement comparison reveals how effectively each company converts revenue into profit, exposing the true strength of their corporate engines.
Marsh & McLennan Companies, Inc. Analysis
Marsh & McLennan shows a strong upward trajectory, with revenue growing from $19.8B in 2021 to nearly $27B in 2025. Net income follows suit, reaching $4.16B in 2025. Despite an unfavorable gross margin reporting in 2025, the company maintains a robust net margin of 15.4%, demonstrating efficient cost control and steady momentum in profitability.
Willis Towers Watson Public Limited Company Analysis
Willis Towers Watson’s revenue increased moderately from $8.6B in 2020 to $9.9B in 2024. However, net income turned negative in 2024, with a loss of $98M compared to a $1.05B profit in 2023. The gross margin remains favorable at 44.6%, but a sharp decline in EBIT and net margins signals challenges in operational efficiency and profit retention in the latest year.
Margin Resilience vs. Profit Volatility
Marsh & McLennan outpaces Willis Towers Watson in revenue scale and profitability, delivering consistent net income growth and a stable net margin. Willis Towers Watson’s recent net loss and margin compression highlight operational weaknesses despite solid gross margins. For investors, Marsh & McLennan’s profile exemplifies resilience and steady profit generation, offering a more reliable earnings foundation.
Financial Ratios Comparison
These vital ratios act as a diagnostic tool to expose the underlying fiscal health, valuation premiums, and capital efficiency of the companies compared below:
| Ratios | Marsh & McLennan Companies, Inc. (MMC) | Willis Towers Watson Public Limited Company (WTW) |
|---|---|---|
| ROE | 30.4% (2024) | -1.2% (2024) |
| ROIC | 11.6% (2024) | -3.5% (2024) |
| P/E | 25.7 (2024) | -326.0 (2024) |
| P/B | 7.83 (2024) | 4.02 (2024) |
| Current Ratio | 1.13 (2024) | 1.20 (2024) |
| Quick Ratio | 1.13 (2024) | 1.20 (2024) |
| D/E | 1.64 (2024) | 0.75 (2024) |
| Debt-to-Assets | 38.7% (2024) | 21.4% (2024) |
| Interest Coverage | 8.31 (2024) | 2.38 (2024) |
| Asset Turnover | 0.43 (2024) | 0.36 (2024) |
| Fixed Asset Turnover | 10.38 (2024) | 8.66 (2024) |
| Payout ratio | 37.3% (2024) | -361.2% (2024) |
| Dividend yield | 1.45% (2024) | 1.11% (2024) |
| Fiscal Year | 2024 | 2024 |
Efficiency & Valuation Duel: The Vital Signs
Financial ratios act as the company’s DNA, revealing hidden risks and operational strengths behind headline figures.
Marsh & McLennan Companies, Inc.
Marsh & McLennan shows strong profitability with a 30.4% ROE and solid margins. The stock trades at a stretched valuation, with a 5.07 EV-to-sales multiple reflecting premium pricing. Shareholder returns focus on growth reinvestment, as dividends are absent and capital flows into intangible assets and R&D.
Willis Towers Watson Public Limited Company
Willis Towers Watson struggles with negative profitability metrics, including a -1.23% ROE and unfavorable returns on invested capital. Its valuation appears mixed: a low negative P/E contrasts with a high 4.02 price-to-book ratio. The company maintains a modest 1.11% dividend yield, balancing shareholder returns amidst operational challenges.
Premium Valuation vs. Operational Safety
Marsh & McLennan delivers superior profitability with premium valuation, while Willis Towers Watson faces operational headwinds despite some dividend income. Investors seeking growth may lean toward Marsh’s efficient model, whereas those preferring income might consider Willis’s modest yield amid risk.
Which one offers the Superior Shareholder Reward?
I compare Marsh & McLennan Companies, Inc. (MMC) and Willis Towers Watson Public Limited Company (WTW) on their shareholder reward strategies. MMC pays a 1.87% dividend yield with a sustainable 41% payout ratio, backed by strong free cash flow of 10.2 per share. Its modest buybacks complement dividends for total return. WTW yields 1.11%, with a payout ratio around 36%, but recent net losses in 2024 raise sustainability concerns despite robust free cash flow of 12.4 per share supporting buybacks. MMC’s balanced dividend and buyback approach aligns better with durable value creation. I find MMC offers a superior total return profile in 2026.
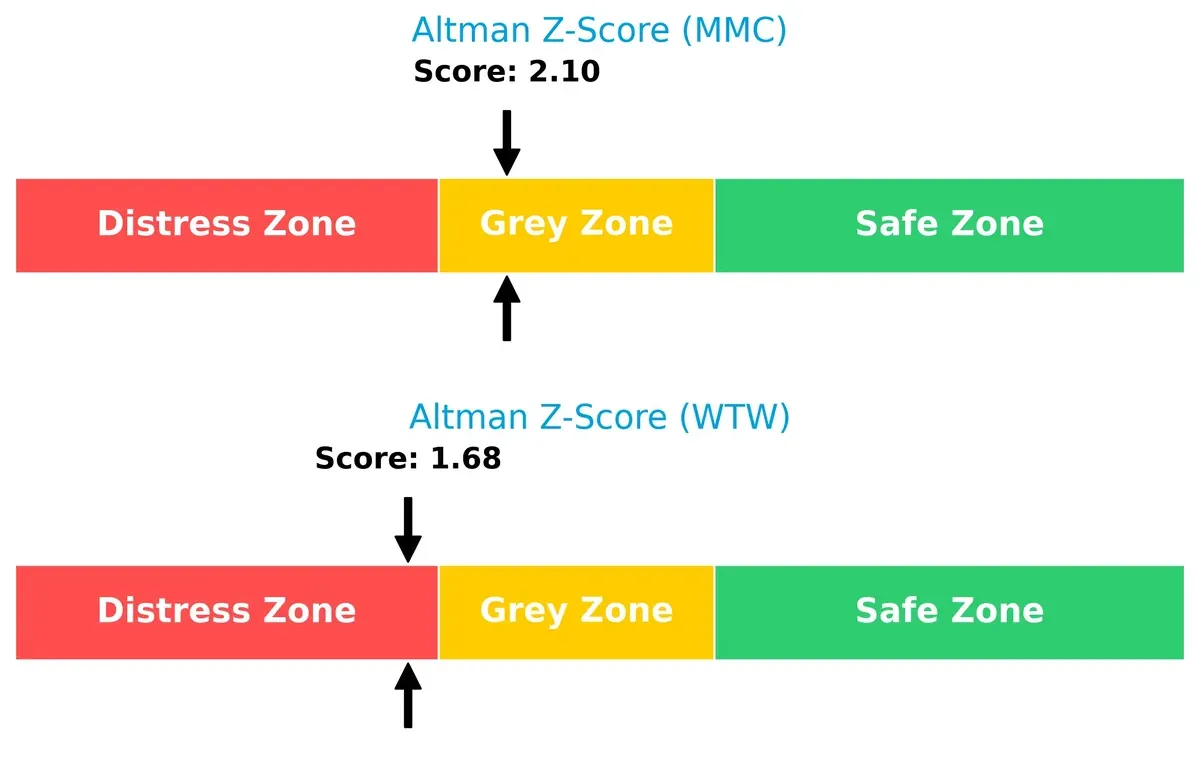
Bankruptcy Risk Duel (Altman Z-Score)
Bankruptcy Risk: Solvency Showdown
Marsh & McLennan’s Altman Z-Score sits in the grey zone at 2.10, signaling moderate bankruptcy risk. Willis Towers Watson scores 1.68, deep in the distress zone, raising red flags for survival in this cycle:
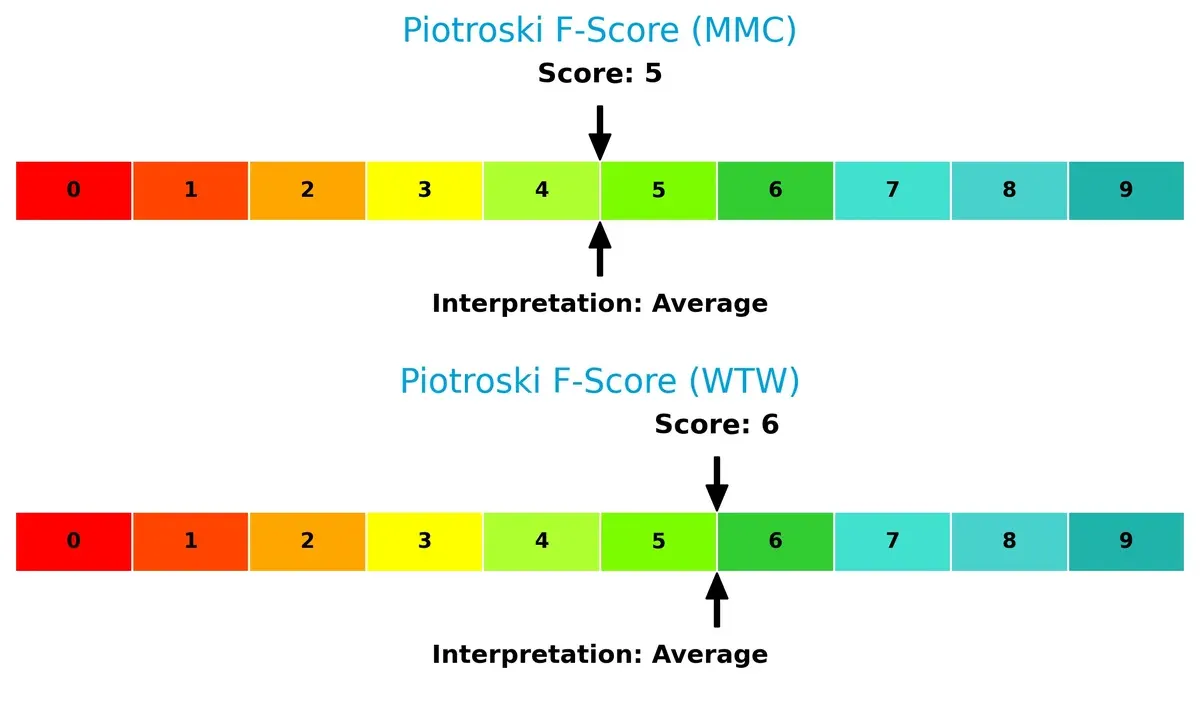
Financial Strength Showdown (Piotroski F-Score)
Financial Health: Quality of Operations
Both companies show average Piotroski scores with Marsh & McLennan at 5 and Willis Towers Watson at 6. Neither stands out as exceptionally strong, but MMC’s slightly lower score suggests marginally more internal operational risks:
—
I cannot generate a Comparative Global Scores block because Marsh & McLennan lacks the required score data.
How are the two companies positioned?
This section dissects MMC and WTW’s operational DNA by comparing revenue distribution and internal dynamics, including strengths and weaknesses. The goal is to confront their economic moats and identify which business model offers the most resilient competitive advantage today.
Revenue Segmentation: The Strategic Mix
This visual comparison dissects how Marsh & McLennan Companies and Willis Towers Watson diversify income streams and where their primary sector bets lie:
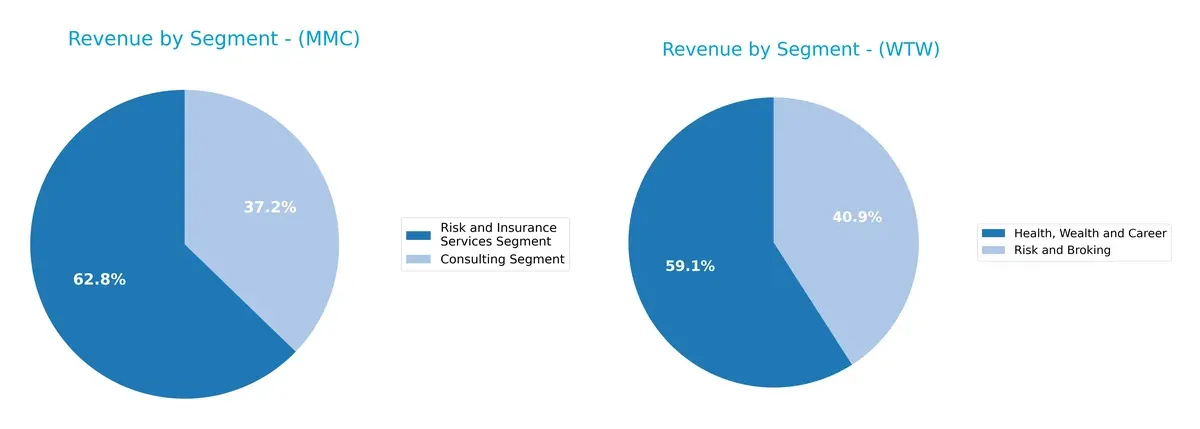
Marsh & McLennan anchors revenue in Risk and Insurance Services ($15.4B) and Consulting ($9.1B), showing a balanced yet concentrated approach. Willis Towers Watson pivots mainly on Health, Wealth and Career ($5.8B) and Risk and Broking ($4.1B), revealing a narrower focus. MMC’s mix supports ecosystem lock-in, while WTW’s reliance on fewer segments signals higher concentration risk amid evolving market demands.
Strengths and Weaknesses Comparison
This table compares the strengths and weaknesses of Marsh & McLennan Companies, Inc. (MMC) and Willis Towers Watson Public Limited Company (WTW):
MMC Strengths
- Diversified revenue from Risk & Insurance and Consulting segments
- Strong global presence with significant US and UK revenues
- Consistent revenue growth over years
WTW Strengths
- Favorable weighted average cost of capital (WACC) at 6.2%
- Quick ratio indicating good short-term liquidity
- Favorable fixed asset turnover reflecting efficient asset use
MMC Weaknesses
- No available financial ratios to assess profitability or efficiency
- Geographic concentration with heavy US reliance
- Limited profitability information restricts risk evaluation
WTW Weaknesses
- Negative profitability metrics: net margin, ROE, and ROIC all unfavorable
- Interest coverage ratio weak at 1.4, indicating risk in debt servicing
- High price-to-book ratio at 4.02 suggests possible overvaluation
Overall, MMC shows strength in diversification and global reach but lacks current financial ratio data for in-depth profitability assessment. WTW presents liquidity and capital efficiency strengths but faces significant profitability and valuation challenges, which could impact strategic decisions.
The Moat Duel: Analyzing Competitive Defensibility
A structural moat is the only thing protecting long-term profits from the erosion of competition. Let’s examine the moats of two insurance brokers:
Marsh & McLennan Companies, Inc.: Intangible Assets Powerhouse
MMC’s competitive advantage stems from deep intangible assets like trusted brand and client relationships. This manifests in stable net margins near 15% and consistent revenue growth above 10%. In 2026, new consulting services could deepen this moat but margin pressures remain a risk.
Willis Towers Watson Public Limited Company: Cost and Scale Challenger
WTW relies on scale and cost advantages, yet its ROIC trails WACC by nearly 10%, signaling value destruction. Its moat weakens as margins shrink and net income declines. Expansion into data-driven solutions offers upside but must reverse profitability headwinds.
Intangible Assets vs. Cost Efficiency: Who Holds the Stronger Moat?
MMC’s intangible asset moat is deeper and more durable than WTW’s eroding cost advantage. MMC’s consistent profitability and growth position it better to defend market share against intensifying competition.
Which stock offers better returns?
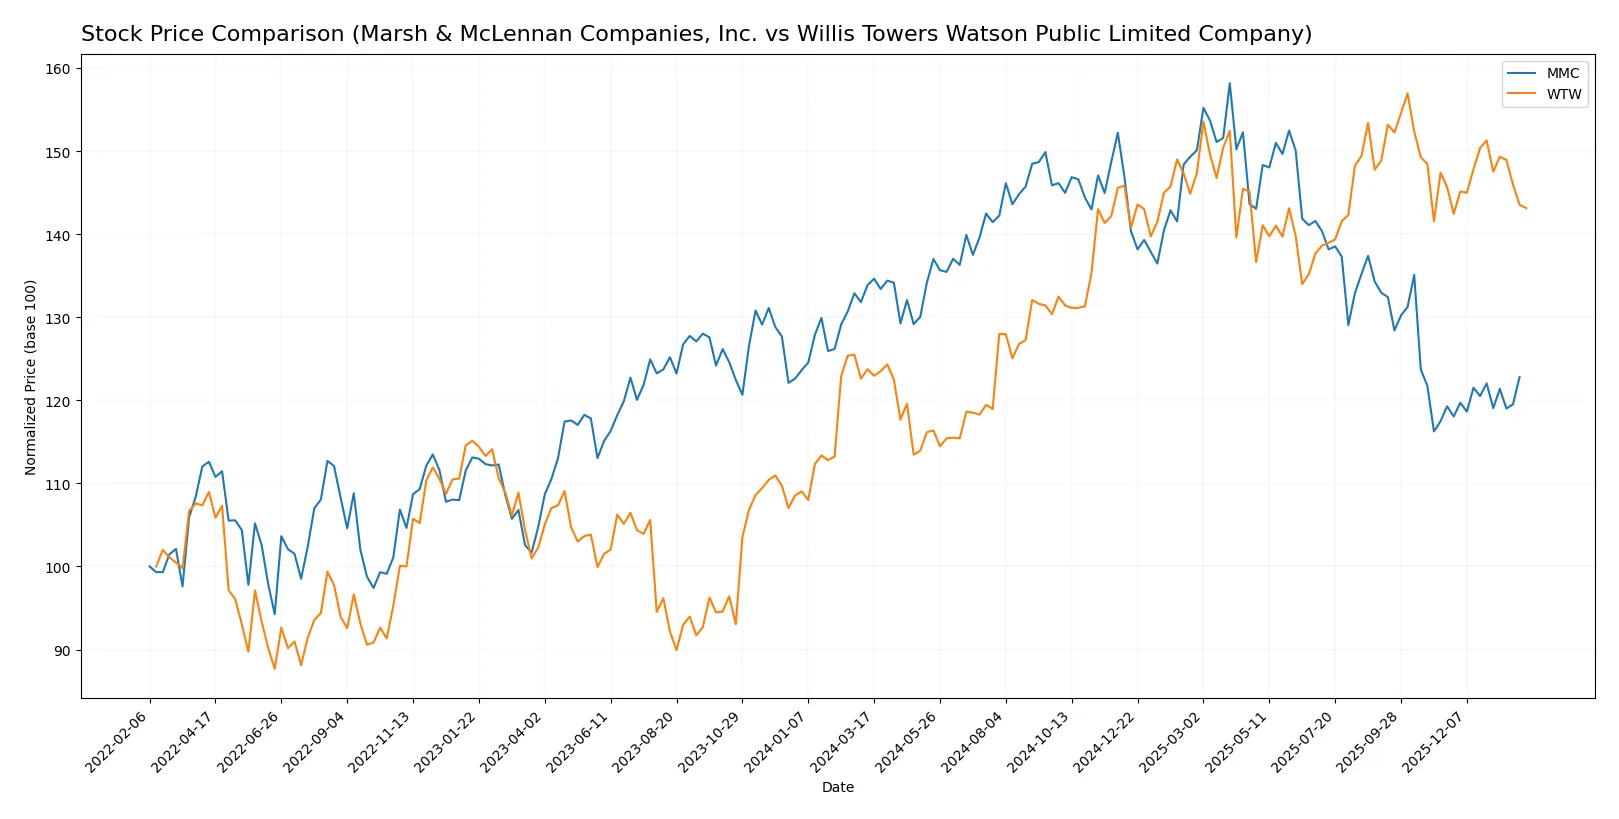
Over the past 12 months, Marsh & McLennan Companies and Willis Towers Watson showed contrasting price trends, with notable highs and lows shaping their trading dynamics.
Trend Comparison
Marsh & McLennan’s stock fell 8.27% over the past year, exhibiting a bearish trend with accelerating decline and a high volatility of 15.76. Recent months show a modest recovery of 2.94%.
Willis Towers Watson’s stock rose 16.42% over the same period, maintaining a bullish trend despite decelerating gains and higher volatility at 25.96. The recent trend is nearly flat with a 0.5% increase.
Willis Towers Watson outperformed Marsh & McLennan by a wide margin in the last year, delivering stronger market returns with sustained positive momentum.
Target Prices
Analysts show a bullish outlook for both Marsh & McLennan Companies and Willis Towers Watson with solid target price ranges.
| Company | Target Low | Target High | Consensus |
|---|---|---|---|
| Marsh & McLennan Companies, Inc. | 190 | 257 | 211.1 |
| Willis Towers Watson Public Limited Company | 318 | 398 | 367.22 |
The consensus targets for MMC and WTW exceed current prices by roughly 15% and 16%, respectively, signaling analyst confidence in their growth prospects.

Don’t Let Luck Decide Your Entry Point
Optimize your entry points with our advanced ProRealTime indicators. You’ll get efficient buy signals with precise price targets for maximum performance. Start outperforming now!
How do institutions grade them?
Marsh & McLennan Companies, Inc. Grades
Here are the latest institutional grades for Marsh & McLennan Companies, Inc.:
| Grading Company | Action | New Grade | Date |
|---|---|---|---|
| Cantor Fitzgerald | Maintain | Overweight | 2026-01-14 |
| Wells Fargo | Maintain | Equal Weight | 2026-01-13 |
| Barclays | Maintain | Overweight | 2026-01-08 |
| Evercore ISI Group | Maintain | Outperform | 2026-01-07 |
| JP Morgan | Maintain | Overweight | 2026-01-07 |
| Keefe, Bruyette & Woods | Maintain | Market Perform | 2026-01-06 |
| Citigroup | Maintain | Neutral | 2025-12-04 |
| Barclays | Upgrade | Overweight | 2025-11-20 |
| B of A Securities | Downgrade | Underperform | 2025-11-03 |
| TD Cowen | Maintain | Hold | 2025-11-03 |
Willis Towers Watson Public Limited Company Grades
Here are the latest institutional grades for Willis Towers Watson Public Limited Company:
| Grading Company | Action | New Grade | Date |
|---|---|---|---|
| Cantor Fitzgerald | Maintain | Neutral | 2026-01-14 |
| Wells Fargo | Maintain | Overweight | 2026-01-13 |
| Barclays | Maintain | Underweight | 2026-01-08 |
| Evercore ISI Group | Maintain | Outperform | 2026-01-07 |
| Keefe, Bruyette & Woods | Maintain | Outperform | 2026-01-06 |
| Keefe, Bruyette & Woods | Maintain | Outperform | 2025-12-12 |
| Wells Fargo | Maintain | Overweight | 2025-12-12 |
| Barclays | Maintain | Underweight | 2025-11-20 |
| TD Cowen | Maintain | Buy | 2025-11-10 |
| Keefe, Bruyette & Woods | Maintain | Outperform | 2025-11-04 |
Which company has the best grades?
Marsh & McLennan generally holds Overweight and Outperform ratings, but includes a notable Underperform downgrade. Willis Towers Watson shows a mix of Outperform and Overweight grades, balanced by Underweight ratings from Barclays. Investors should weigh the consistency and range of grades when evaluating risks and potential returns.
Risks specific to each company
The following categories identify critical pressure points and systemic threats facing both firms in the 2026 market environment:
1. Market & Competition
Marsh & McLennan Companies, Inc.
- Large market cap supports competitive resilience but faces intense sector rivalry.
Willis Towers Watson Public Limited Company
- Smaller market cap limits scale; high competition pressures margins and client retention.
2. Capital Structure & Debt
Marsh & McLennan Companies, Inc.
- Data unavailable, creating uncertainty on leverage and financial flexibility.
Willis Towers Watson Public Limited Company
- Moderate debt-to-equity (0.75) with favorable debt-to-assets (21.43%) signals manageable leverage risk.
3. Stock Volatility
Marsh & McLennan Companies, Inc.
- Beta at 0.75 indicates below-market volatility, reducing systemic risk exposure.
Willis Towers Watson Public Limited Company
- Lower beta of 0.62 further reduces stock volatility risk relative to market benchmarks.
4. Regulatory & Legal
Marsh & McLennan Companies, Inc.
- Operating primarily in the US exposes MMC to evolving insurance regulations and compliance costs.
Willis Towers Watson Public Limited Company
- UK base subjects WTW to Brexit-related legal uncertainties and stricter EU/UK regulatory frameworks.
5. Supply Chain & Operations
Marsh & McLennan Companies, Inc.
- Large workforce (90K) demands robust operational efficiency and risk management.
Willis Towers Watson Public Limited Company
- Smaller workforce (49K) may allow more agile operations but limits scale advantages.
6. ESG & Climate Transition
Marsh & McLennan Companies, Inc.
- ESG initiatives critical to maintain client trust amid rising climate-related risk advisory demand.
Willis Towers Watson Public Limited Company
- ESG integration essential, though less publicly documented, posing potential reputational risk.
7. Geopolitical Exposure
Marsh & McLennan Companies, Inc.
- US-centric operations face domestic political shifts and global trade tensions.
Willis Towers Watson Public Limited Company
- UK headquarters expose WTW to geopolitical risks including Brexit fallout and currency fluctuations.
Which company shows a better risk-adjusted profile?
Marsh & McLennan’s main risk is regulatory complexity and scale-related operational demands. Willis Towers Watson faces financial distress risk, reflected by a weak Altman Z-score and unfavorable profitability metrics. Despite data gaps for MMC, its lower stock volatility and larger market cap suggest a more stable risk profile. WTW’s financial weakness and distress zone rating are red flags. Recent WTW financial ratios show a negative ROIC (-3.49%) versus a favorable WACC (6.2%), highlighting poor capital efficiency as a key concern. Overall, MMC appears better positioned to manage risks prudently in 2026.
Final Verdict: Which stock to choose?
Marsh & McLennan Companies, Inc. (MMC) stands out as a cash-generating powerhouse with a strong return on equity near 30%. Its superpower lies in delivering solid profitability and steady revenue growth. However, the negative working capital and occasional cash flow volatility remain points of vigilance. MMC suits an aggressive growth portfolio willing to tolerate some operational quirks.
Willis Towers Watson (WTW) benefits from a strategic moat anchored in its specialized consulting and risk management services. Its recurring revenue streams provide a cushion of stability compared to MMC’s more cyclical profile. Yet, WTW’s declining ROIC and unfavorable profitability metrics signal caution. This stock fits a GARP (Growth at a Reasonable Price) investor seeking long-term resilience with moderate risk.
If you prioritize high profitability and growth momentum, MMC is the compelling choice due to its robust capital returns and cash flow generation. However, if you seek better stability and a defensible moat, WTW offers superior resilience despite near-term profitability challenges. Each appeals to distinct investor profiles, requiring careful alignment with portfolio objectives.
Disclaimer: Investment carries a risk of loss of initial capital. The past performance is not a reliable indicator of future results. Be sure to understand risks before making an investment decision.
Go Further
I encourage you to read the complete analyses of Marsh & McLennan Companies, Inc. and Willis Towers Watson Public Limited Company to enhance your investment decisions: