Home > Comparison > Energy > PSX vs MPC
The strategic rivalry between Phillips 66 and Marathon Petroleum Corporation shapes the dynamics of the Oil & Gas Refining & Marketing sector. Phillips 66 operates a diversified energy manufacturing and logistics model with chemicals and midstream assets. Marathon Petroleum focuses on integrated downstream refining and marketing with a large branded retail footprint. This analysis will assess which company’s operational strategy offers a superior risk-adjusted return for a balanced investment portfolio.
Table of contents
Companies Overview
Phillips 66 and Marathon Petroleum Corporation stand as pivotal players in the U.S. refining and marketing sector, shaping energy supply chains.
Phillips 66: Diversified Energy Manufacturer and Logistics Leader
Phillips 66 dominates as an energy manufacturing and logistics company. Its core revenue stems from refining crude oil into petroleum products and marketing specialty chemicals. In 2026, the company strategically focuses on expanding its Midstream segment, enhancing crude oil transportation and storage capabilities. This diversified approach underpins its competitive advantage across refining, chemicals, and marketing.
Marathon Petroleum Corporation: Integrated Downstream Energy Giant
Marathon Petroleum operates primarily in refining and marketing within the U.S. Its revenue engine combines refining crude oil into fuels and reselling refined products through a vast distribution network, including 7,159 branded outlets. In 2026, Marathon emphasizes optimizing its Midstream logistics and expanding market reach via branded retail outlets, reinforcing its market position in transportation fuels and asphalt.
Strategic Collision: Similarities & Divergences
Both companies pursue integrated downstream models but differ in scope; Phillips 66 emphasizes chemical production alongside refining, while Marathon concentrates on refining and branded retail distribution. Their primary battleground lies in refining efficiency and logistics control. Phillips 66 offers a more diversified portfolio, whereas Marathon’s strength is its extensive retail footprint—each presents a distinct investment profile shaped by these strategic focuses.
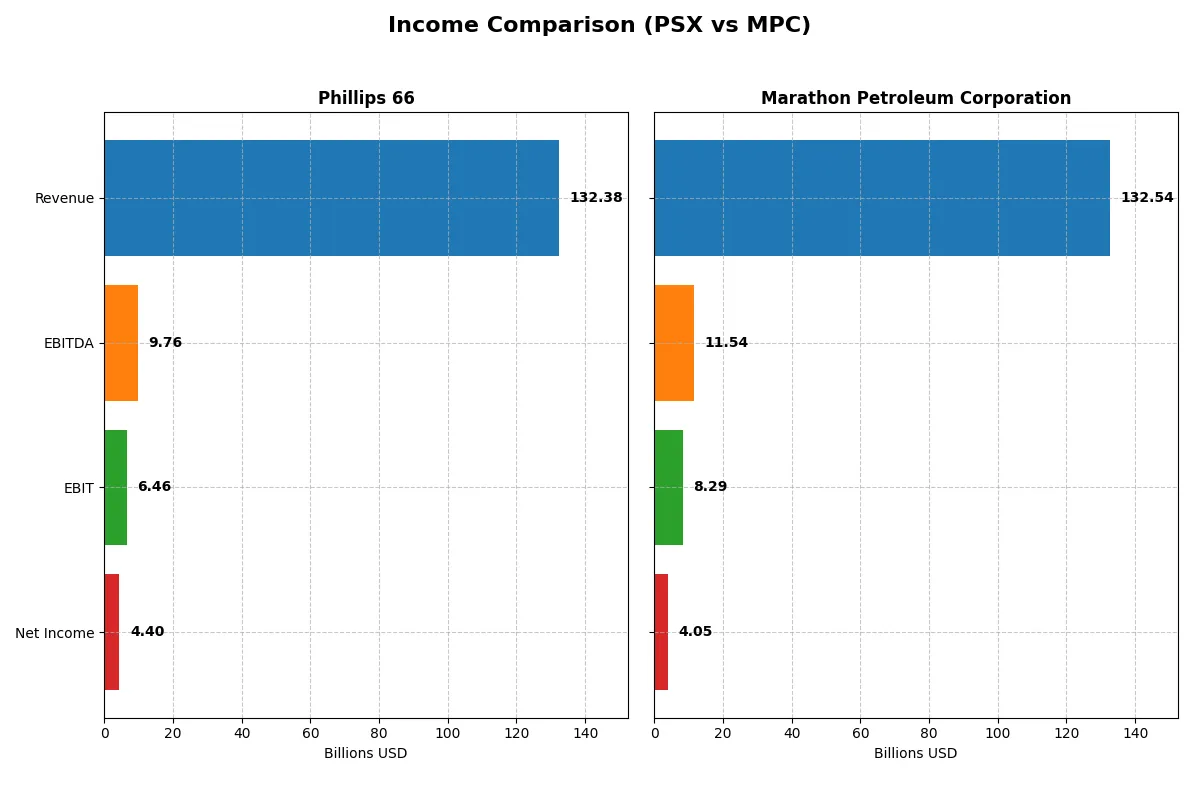
Income Statement Comparison
This data dissects the core profitability and scalability of both corporate engines to reveal who dominates the bottom line:
| Metric | Phillips 66 (PSX) | Marathon Petroleum Corporation (MPC) |
|---|---|---|
| Revenue | 132.4B | 132.5B |
| Cost of Revenue | 125.8B | 122.7B |
| Operating Expenses | 3.23B | 3.35B |
| Gross Profit | 6.56B | 9.85B |
| EBITDA | 9.76B | 11.54B |
| EBIT | 6.46B | 8.29B |
| Interest Expense | 1.04B | 1.28B |
| Net Income | 4.40B | 4.05B |
| EPS | 10.84 | 13.27 |
| Fiscal Year | 2025 | 2025 |
Income Statement Analysis: The Bottom-Line Duel
This income statement comparison reveals which company runs a more efficient corporate engine by examining revenue, margins, and profitability trends.
Phillips 66 Analysis
Phillips 66’s revenue grew 18.25% from 2021 to 2025, but declined 7.5% in 2025 alone. Net income surged 235% over five years, doubling in the latest year. Gross and net margins remain stable around 5% and 3.3%, respectively. The 2025 net margin jumped 125%, signaling improved cost control and efficiency momentum.
Marathon Petroleum Corporation Analysis
Marathon’s revenue rose 10.5% over five years but dipped 4.5% in 2025. Gross margin at 7.4% surpasses Phillips 66, though net margin at 3.05% is slightly lower. Despite a 58% net income decline over five years, 2025 showed 23% net margin growth and 31.5% EPS growth, reflecting operational resilience amid margin pressures.
Margin Strength vs. Earnings Momentum
Phillips 66 exhibits stronger net income growth and margin expansion, indicating superior bottom-line efficiency. Marathon offers higher gross margins with steadier revenue but struggles with net income decline. For investors prioritizing earnings momentum and margin improvement, Phillips 66’s profile currently holds more appeal.
Financial Ratios Comparison
These vital ratios act as a diagnostic tool to expose the underlying fiscal health, valuation premiums, and capital efficiency of each company:
| Ratios | Phillips 66 (PSX) | Marathon Petroleum Corp (MPC) |
|---|---|---|
| ROE | 7.72% (2024) | 19.41% (2024) |
| ROIC | 3.19% (2024) | 7.26% (2024) |
| P/E | 22.61 (2024) | 13.81 (2024) |
| P/B | 1.75 (2024) | 2.68 (2024) |
| Current Ratio | 1.19 (2024) | 1.17 (2024) |
| Quick Ratio | 0.92 (2024) | 0.71 (2024) |
| D/E | 0.73 (2024) | 1.62 (2024) |
| Debt-to-Assets | 27.64% (2024) | 36.47% (2024) |
| Interest Coverage | 2.56 (2024) | 3.90 (2024) |
| Asset Turnover | 1.97 (2024) | 1.76 (2024) |
| Fixed Asset Turnover | 4.06 (2024) | 3.82 (2024) |
| Payout Ratio | 88.90% (2024) | 33.50% (2024) |
| Dividend Yield | 3.93% (2024) | 2.43% (2024) |
| Fiscal Year | 2024 | 2024 |
Efficiency & Valuation Duel: The Vital Signs
Financial ratios serve as a company’s DNA, exposing underlying risks and operational efficiency that raw numbers alone cannot reveal.
Phillips 66
Phillips 66 shows a modest net margin of 3.33% and an ROE of 0%, signaling weak profitability. Its P/E ratio of 11.9 suggests the stock is reasonably valued. The company supports shareholders with a solid 3.67% dividend yield, reflecting a preference for income over aggressive reinvestment.
Marathon Petroleum Corporation
Marathon Petroleum posts a slightly lower net margin of 2.99% and also a 0% ROE, indicating limited profitability. Its P/E ratio of 12.26 implies a fairly valued stock. The 2.29% dividend yield indicates some shareholder return, though less generous than Phillips 66, suggesting moderate income focus.
Dividend Yield Supremacy vs. Valuation Parity
Both companies present similar valuation metrics and slightly unfavorable profitability ratios. Phillips 66 offers a higher dividend yield, favoring income investors, while Marathon Petroleum trades at a comparable valuation with a smaller payout. Investors prioritizing yield may lean toward Phillips 66; those seeking parity might consider either.
Which one offers the Superior Shareholder Reward?
I see Phillips 66 (PSX) yields a higher dividend at 3.67%, with a payout ratio of 44% backed by strong free cash flow coverage (1.19x), indicating a sustainable distribution. Its buybacks complement this, enhancing total return. Marathon Petroleum (MPC) yields 2.29%, with a lower payout ratio near 28%, prioritizing reinvestment in growth and moderate buybacks. Historically, in this capital-intensive sector, PSX’s balanced yield and buybacks provide a more reliable shareholder reward. I conclude PSX offers the superior total return profile in 2026 due to its sustainable, cash-backed distributions combined with active share repurchases.
Comparative Score Analysis: The Strategic Profile
The radar chart reveals the fundamental DNA and trade-offs of Phillips 66 and Marathon Petroleum Corporation, highlighting their strengths and vulnerabilities:
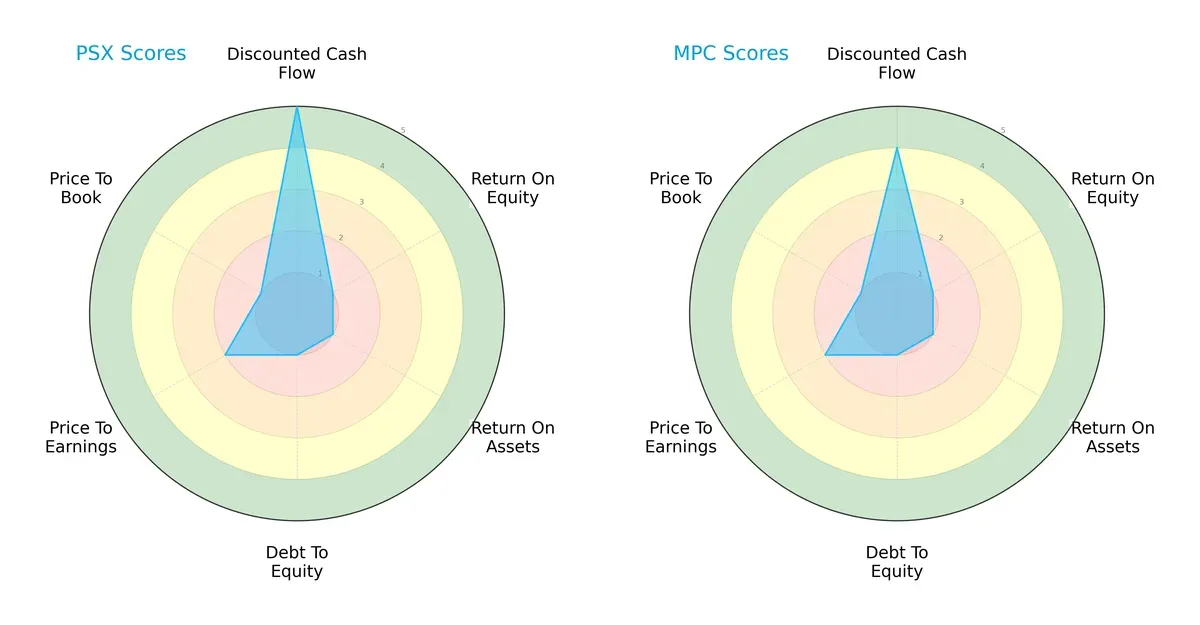
Phillips 66 edges out with a slightly stronger discounted cash flow score (5 vs. 4), signaling better valuation potential. Both firms struggle equally on return metrics (ROE and ROA scores at 1) and carry high financial risk with poor debt-to-equity scores (1 each). Valuation scores (PE and PB) remain unfavorable for both, but Phillips 66 shows a marginally better overall balance. Marathon relies more on its stable cash flow outlook, while Phillips appears more aggressive on value metrics.
Bankruptcy Risk: Solvency Showdown
Phillips 66 posts a safer Altman Z-Score at 3.45 versus Marathon’s 3.13, both comfortably in the safe zone:
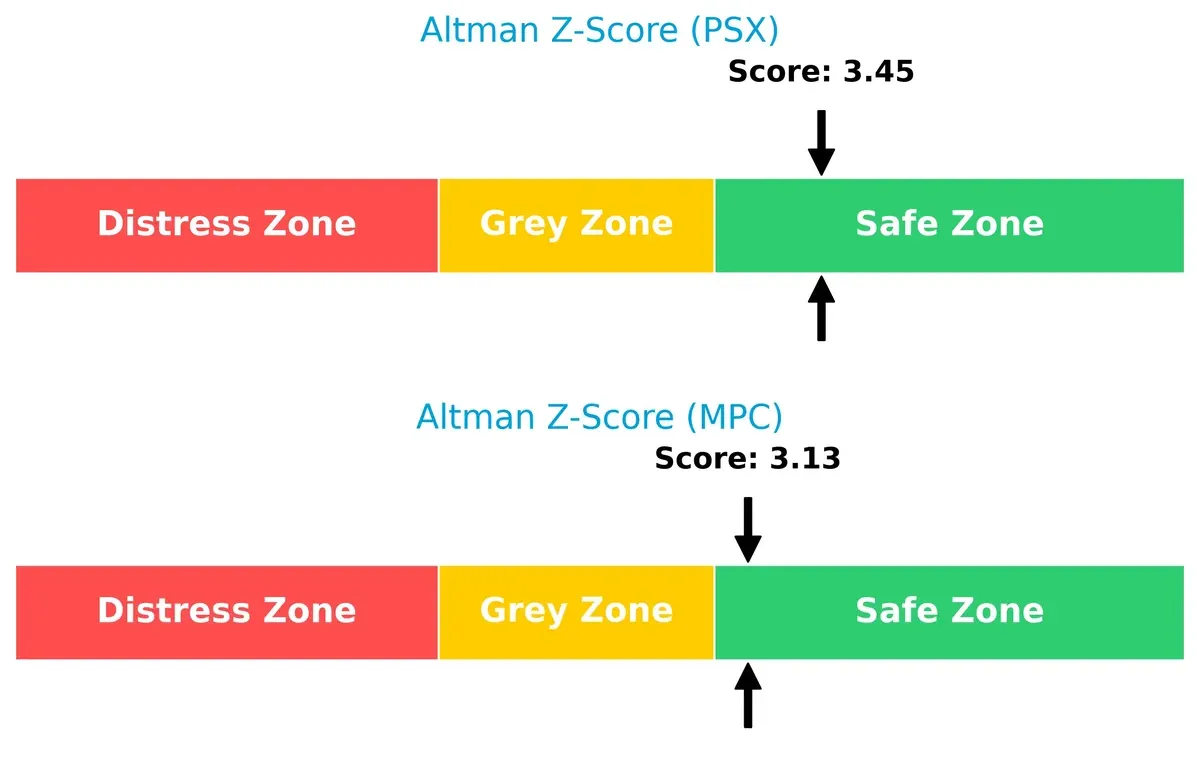
This gap suggests Phillips 66 is marginally better positioned to weather economic downturns. Both firms maintain solvency but Phillips’ higher score reflects stronger resilience in today’s commodity cycle.
Financial Health: Quality of Operations
Both companies share identical Piotroski F-Scores of 6, indicating average financial health:
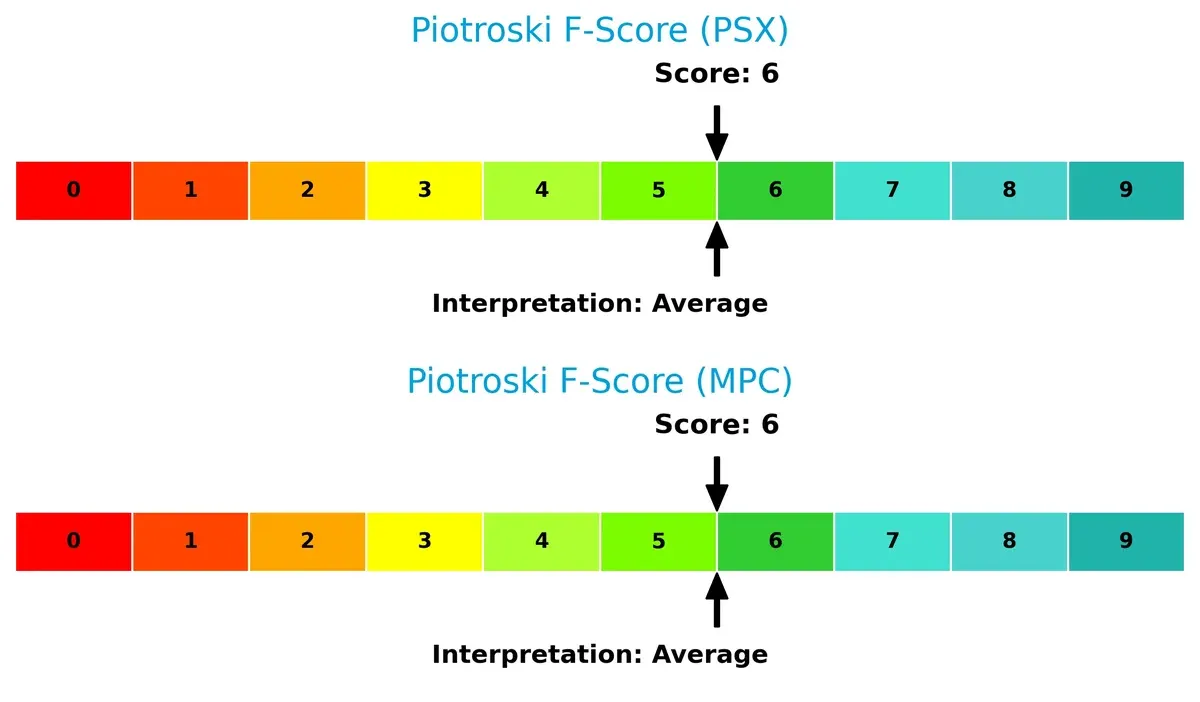
Neither firm exhibits red flags, but neither excels. This parity suggests operational quality and internal financial discipline are similar, with room for improvement to reach strong health benchmarks.
How are the two companies positioned?
This section dissects Phillips 66 and Marathon Petroleum’s operational DNA by comparing their revenue distribution and internal dynamics. The goal is to confront their economic moats and identify which model offers the most resilient, sustainable competitive advantage today.
Revenue Segmentation: The Strategic Mix
This visual comparison dissects how Phillips 66 and Marathon Petroleum diversify income streams and reveals where each prioritizes its sector bets:
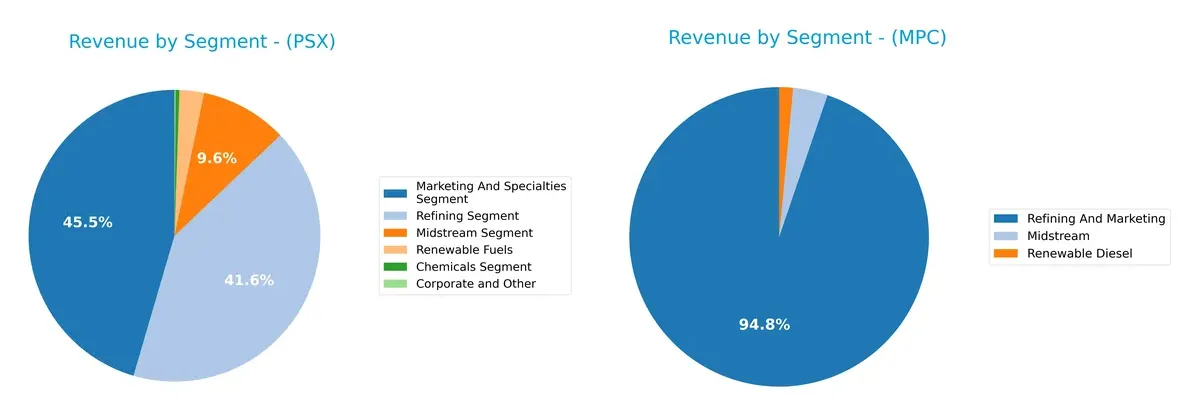
Phillips 66 anchors its revenue in Marketing & Specialties at $92.8B and Refining at $85B, showing a balanced dual focus. Marathon Petroleum pivots heavily on Refining & Marketing with $131.6B, dwarfing its Midstream ($5.2B) and Renewable Diesel ($2.1B) segments. Phillips 66’s broader mix mitigates concentration risk, while Marathon’s dominance in refining exposes it to commodity cycles but leverages infrastructure scale.
Strengths and Weaknesses Comparison
This table compares the strengths and weaknesses of Phillips 66 and Marathon Petroleum Corporation based on diversification, profitability, financials, innovation, global presence, and market share:
Phillips 66 Strengths
- Diverse segments including marketing, midstream, refining, renewables, and chemicals
- Favorable PE ratio at 11.9 and dividend yield of 3.67%
- Strong interest coverage ratio at 6.22
- Presence in multiple geographic markets including the US, UK, Germany
Marathon Petroleum Corporation Strengths
- Strong refining and marketing revenue base
- Favorable PE ratio at 12.26
- Interest coverage ratio slightly higher at 6.5
- Dividend yield of 2.29%
- Midstream operations contribute consistently
Phillips 66 Weaknesses
- Unfavorable net margin at 3.33% and zero ROE and ROIC
- Unavailable WACC data limits cost of capital analysis
- Weak liquidity ratios: current and quick ratios at zero
- Unfavorable asset and fixed asset turnover ratios
- Slightly unfavorable global ratios opinion
Marathon Petroleum Corporation Weaknesses
- Unfavorable net margin at 2.99% and zero ROE and ROIC
- Unavailable WACC data restricts financial efficiency understanding
- Zero current and quick ratios indicate liquidity concerns
- Unfavorable asset turnover ratios
- Slightly unfavorable global ratios opinion
Both companies exhibit strengths in valuation and dividend yield but face challenges in profitability and liquidity. Their diversified revenue streams and strong interest coverage provide some resilience, yet improving operational efficiency and liquidity remain critical for sustained competitiveness.
The Moat Duel: Analyzing Competitive Defensibility
A structural moat is the only reliable shield protecting long-term profits from relentless competitive erosion. Let’s dissect the moats of two energy giants:
Phillips 66: Integrated Refining and Logistics Moat
Phillips 66’s advantage stems from its integrated midstream and refining operations, creating cost efficiencies and margin stability. Despite recent revenue softness, product diversification and geographic reach could deepen its moat in 2026.
Marathon Petroleum Corporation: Scale and Brand Reach Moat
Marathon leverages a vast retail network and regional scale, strengthening its market presence. Compared to Phillips 66, Marathon’s brand-driven distribution channels sustain stable margins and offer expansion opportunities in fuel retail markets.
Integrated Operations vs. Scale and Brand Reach
Both firms face declining ROIC trends, signaling pressure on capital efficiency. However, Phillips 66’s diversified operations offer a deeper moat, better positioning it to defend market share amid industry volatility in 2026.
Which stock offers better returns?
The past year shows distinct dynamics: Phillips 66 endured a mild overall decline but strong recent gains, while Marathon Petroleum posted a modest overall rise with steady acceleration.
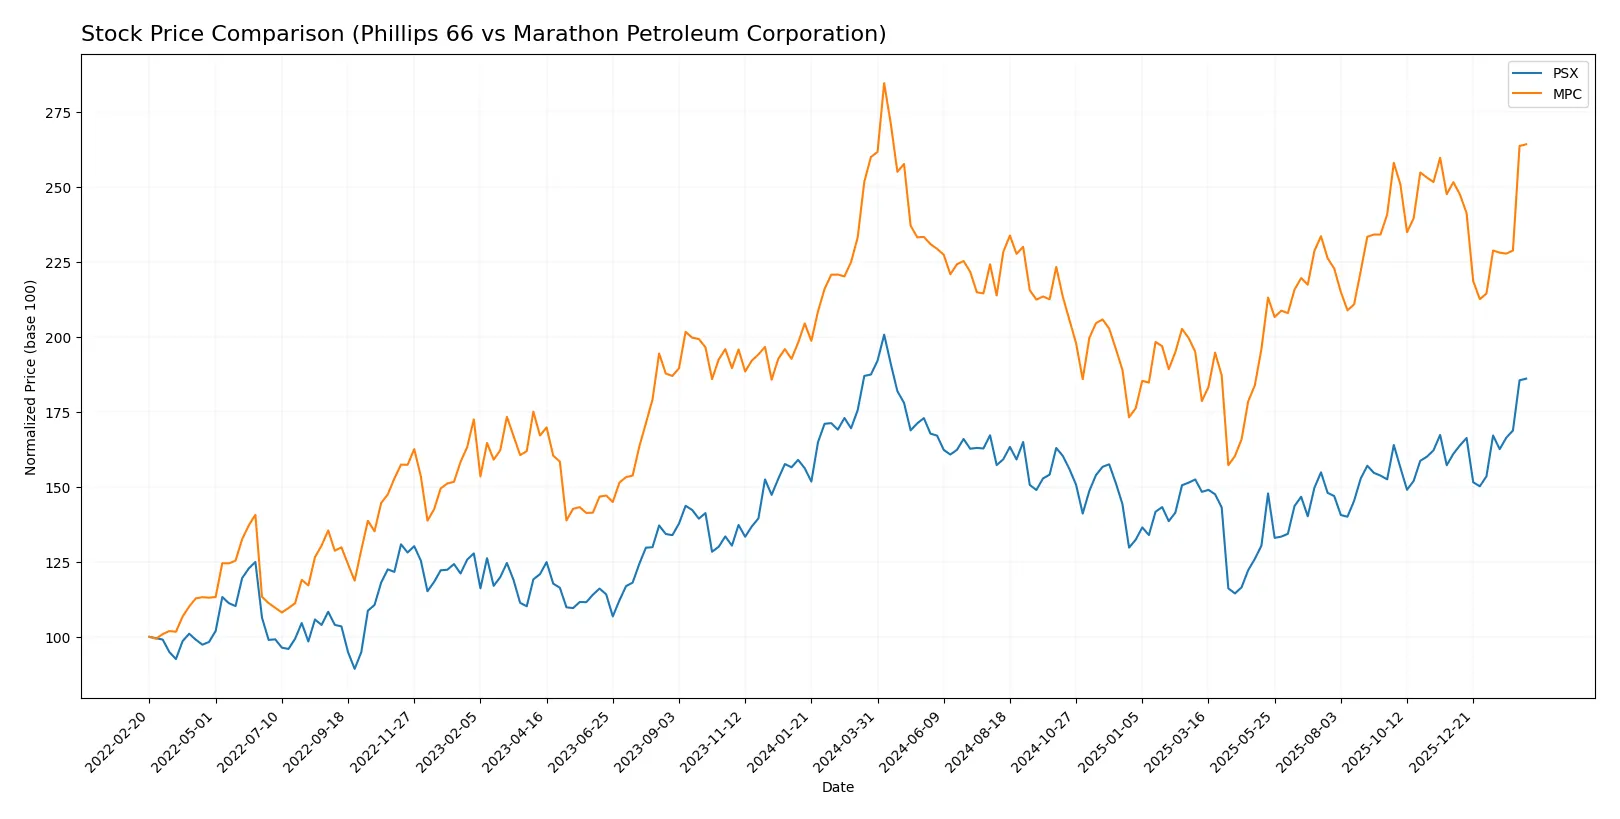
Trend Comparison
Phillips 66’s stock declined 0.74% over the last 12 months, signaling a bearish trend with accelerating momentum. It ranged from a low of 97.38 to a high of 170.75, exhibiting moderate volatility (std dev 13.51).
Marathon Petroleum’s stock rose 1.64% over the same period, reflecting a bullish trend with acceleration. It traded between 121.07 and 219.13, showing higher volatility (std dev 19.69).
Marathon Petroleum outperformed Phillips 66 marginally with a bullish trend versus a bearish one, delivering the highest market performance over the past year.
Target Prices
Analysts present a bullish consensus for Phillips 66 and Marathon Petroleum Corporation with solid upside potential.
| Company | Target Low | Target High | Consensus |
|---|---|---|---|
| Phillips 66 | 140 | 172 | 154.56 |
| Marathon Petroleum Corporation | 174 | 221 | 199.38 |
Phillips 66’s consensus target of 154.56 slightly undercuts its current price of 158.35, implying limited near-term upside. Marathon Petroleum’s consensus target of 199.38 aligns closely with its current price of 203.66, suggesting a balanced risk/reward profile.

Don’t Let Luck Decide Your Entry Point
Optimize your entry points with our advanced ProRealTime indicators. You’ll get efficient buy signals with precise price targets for maximum performance. Start outperforming now!
How do institutions grade them?
The following tables summarize recent institutional grades for Phillips 66 and Marathon Petroleum Corporation:
Phillips 66 Grades
This table shows recent grade actions from major financial institutions covering Phillips 66.
| Grading Company | Action | New Grade | Date |
|---|---|---|---|
| Piper Sandler | Maintain | Neutral | 2026-02-05 |
| Morgan Stanley | Maintain | Equal Weight | 2026-02-05 |
| Wells Fargo | Maintain | Overweight | 2026-02-05 |
| Citigroup | Maintain | Neutral | 2026-01-14 |
| JP Morgan | Maintain | Overweight | 2026-01-13 |
| Piper Sandler | Maintain | Neutral | 2026-01-12 |
| Barclays | Maintain | Equal Weight | 2026-01-12 |
| Mizuho | Maintain | Neutral | 2026-01-12 |
| Piper Sandler | Maintain | Neutral | 2026-01-08 |
| Freedom Capital Markets | Downgrade | Sell | 2026-01-06 |
Marathon Petroleum Corporation Grades
This table presents recent institutional grades and actions for Marathon Petroleum Corporation.
| Grading Company | Action | New Grade | Date |
|---|---|---|---|
| Wells Fargo | Maintain | Overweight | 2026-02-04 |
| Citigroup | Maintain | Neutral | 2026-01-14 |
| Mizuho | Maintain | Neutral | 2026-01-13 |
| Barclays | Maintain | Overweight | 2026-01-13 |
| Piper Sandler | Maintain | Neutral | 2026-01-08 |
| Barclays | Maintain | Overweight | 2025-11-17 |
| Piper Sandler | Maintain | Neutral | 2025-11-14 |
| Wells Fargo | Maintain | Overweight | 2025-11-05 |
| Raymond James | Maintain | Outperform | 2025-10-17 |
| Barclays | Maintain | Overweight | 2025-10-13 |
Which company has the best grades?
Marathon Petroleum generally holds stronger grades with consistent Overweight and Outperform ratings. Phillips 66 mostly receives Neutral and Equal Weight grades, with one Sell downgrade. Investors may interpret Marathon’s superior grades as more favorable institutional sentiment.
Risks specific to each company
The following categories identify critical pressure points and systemic threats facing both firms in the 2026 market environment:
1. Market & Competition
Phillips 66
- Operates in a highly competitive refining and marketing sector with diversified segments including chemicals and midstream. Faces pressure from integrated energy peers.
Marathon Petroleum Corporation
- Focuses on integrated downstream operations primarily in the US. Faces intense competition regionally with emphasis on branded outlets and wholesale markets.
2. Capital Structure & Debt
Phillips 66
- Shows favorable debt-to-equity and interest coverage ratios, indicating manageable leverage and solid ability to meet interest obligations.
Marathon Petroleum Corporation
- Also maintains favorable leverage metrics with strong interest coverage, suggesting prudent capital structure management.
3. Stock Volatility
Phillips 66
- Beta of 0.867 suggests moderate stock volatility, slightly more reactive than MPC but below market average.
Marathon Petroleum Corporation
- Lower beta of 0.708 indicates less volatility and comparatively steadier stock price movements.
4. Regulatory & Legal
Phillips 66
- Subject to US and European regulations impacting refining emissions and chemical manufacturing. Compliance costs could rise with tightening standards.
Marathon Petroleum Corporation
- Faces stringent US environmental regulations and potential liabilities related to fuel supply, refining, and marketing operations.
5. Supply Chain & Operations
Phillips 66
- Relies on complex midstream logistics across US and Europe; operational disruptions could affect product flow and margins.
Marathon Petroleum Corporation
- Operates extensive pipeline, terminal, and logistics assets mainly in the US; regional disruptions or capacity constraints pose risks.
6. ESG & Climate Transition
Phillips 66
- Exposure to transition risks in chemicals and refining. Must innovate to reduce carbon footprint amid investor and regulatory pressure.
Marathon Petroleum Corporation
- Faces pressure to decarbonize downstream operations and fuel products. ESG compliance is critical to maintain market access and investor trust.
7. Geopolitical Exposure
Phillips 66
- Operates partly in Europe, exposing it to geopolitical risks including sanctions, trade tensions, and regional instability.
Marathon Petroleum Corporation
- Primarily US-focused operations reduce direct geopolitical risk but global crude supply disruptions could impact costs.
Which company shows a better risk-adjusted profile?
Phillips 66’s most impactful risk is its complex European exposure amid tightening regulations and geopolitical uncertainty. Marathon Petroleum’s key risk lies in its regional concentration and vulnerability to US regulatory shifts. Both companies show slightly unfavorable financial ratios and average financial health scores, but Phillips 66’s diversified segments and slightly higher stock volatility pose a marginally greater risk. Marathon’s steadier beta and focused US operations offer a somewhat better risk-adjusted profile. Notably, both firms maintain safe-zone Altman Z-scores, signaling low bankruptcy risk despite profitability challenges.
Final Verdict: Which stock to choose?
Phillips 66’s superpower lies in its ability to generate strong cash flow growth despite recent revenue headwinds. It demonstrates resilience through disciplined capital expenditures and a solid dividend yield. A point of vigilance remains its declining ROIC trend, which might pressure long-term value creation. It fits best in an aggressive growth portfolio seeking cyclical rebound potential.
Marathon Petroleum commands a strategic moat with its robust asset base and efficient capital allocation in refining operations. It offers a steadier income profile with a respectable free cash flow yield and somewhat lower volatility than Phillips 66. Its safety profile suits a GARP (Growth at a Reasonable Price) investor focused on balanced growth and income stability.
If you prioritize capitalizing on near-term cash flow momentum and dividend income, Phillips 66 appears the compelling choice due to its operational efficiency and growth trajectory. However, if you seek better stability and a stronger asset-backed moat amid industry cyclicality, Marathon Petroleum offers a more conservative profile with sensible valuation. Both represent nuanced scenarios depending on your risk tolerance and growth horizon.
Disclaimer: Investment carries a risk of loss of initial capital. The past performance is not a reliable indicator of future results. Be sure to understand risks before making an investment decision.
Go Further
I encourage you to read the complete analyses of Phillips 66 and Marathon Petroleum Corporation to enhance your investment decisions: