Home > Comparison > Financial Services > USB vs MTB
The strategic rivalry between U.S. Bancorp and M&T Bank Corporation shapes the competitive landscape of regional banking in the US. U.S. Bancorp operates a broad financial services model with diversified business lines, while M&T Bank focuses on commercial and retail banking with a strong regional footprint. This analysis pits scale and diversification against regional specialization to identify the superior risk-adjusted opportunity for a balanced financial services portfolio.

Table of contents
Companies Overview
U.S. Bancorp and M&T Bank Corporation stand as key regional banks shaping U.S. financial services.
U.S. Bancorp: Diversified Financial Services Powerhouse
U.S. Bancorp dominates as a financial services holding company with a broad revenue engine spanning corporate, commercial, consumer banking, and wealth management. It generates income through diverse products: deposits, lending, credit cards, payments, and asset management. In 2021, it strategically emphasized expanding digital channels alongside its 2,230 physical branches, reinforcing its competitive edge in the Midwest and West.
M&T Bank Corporation: Regional Commercial and Retail Banking Leader
M&T Bank Corporation operates as a bank holding company focused on commercial and retail banking services. Its revenue derives from lending, deposit products, cash management, and real estate loans across various market segments. In 2021, M&T concentrated on strengthening its commercial real estate and middle-market lending franchises, primarily through its 688 offices in the Northeast and Mid-Atlantic regions.
Strategic Collision: Similarities & Divergences
Both banks prioritize regional commercial and retail banking but differ in scale and geographic focus. U.S. Bancorp leverages a wide product mix and a larger branch network, contrasting with M&T’s more concentrated commercial real estate and middle-market approach. Their battle for market share centers on lending and deposit growth. Investors face distinct profiles: U.S. Bancorp offers broad diversification, while M&T delivers focused regional strength.
Income Statement Comparison
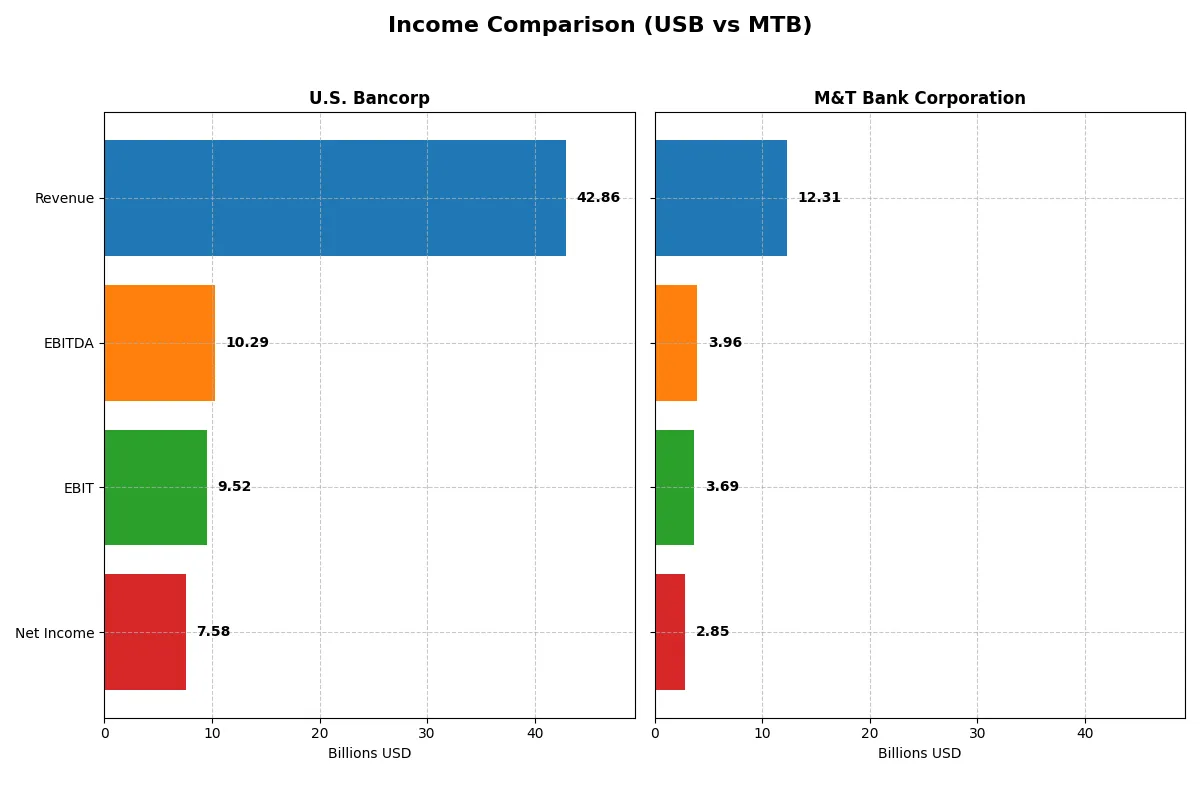
The following data dissects the core profitability and scalability of both corporate engines to reveal who dominates the bottom line:
| Metric | U.S. Bancorp (USB) | M&T Bank Corporation (MTB) |
|---|---|---|
| Revenue | 42.9B | 12.3B |
| Cost of Revenue | 15.9B | 3.1B |
| Operating Expenses | 17.4B | 5.5B |
| Gross Profit | 26.9B | 9.2B |
| EBITDA | 10.3B | 4.0B |
| EBIT | 9.5B | 3.7B |
| Interest Expense | 14.3B | 3.5B |
| Net Income | 7.6B | 2.9B |
| EPS | 4.62 | 17.1 |
| Fiscal Year | 2025 | 2025 |
Income Statement Analysis: The Bottom-Line Duel
This income statement comparison reveals how efficiently U.S. Bancorp and M&T Bank operate their financial engines through revenue and profit dynamics.
U.S. Bancorp Analysis
U.S. Bancorp’s revenue advanced modestly from 27.4B in 2022 to 42.9B in 2025, showing strong topline growth. Net income fluctuated, peaking at 7.6B in 2025 but overall dipped slightly over five years. Its gross margin remains healthy at 62.8%, and the net margin improved to 17.7%, signaling solid profitability amid rising operating expenses. Recent momentum shows expanding EBIT and EPS, reflecting efficiency gains.
M&T Bank Corporation Analysis
M&T Bank posted a revenue rise from 6.1B in 2021 to 12.3B in 2025, doubling its scale with a slight 8% revenue dip in the last year. Net income grew steadily, reaching 2.85B in 2025, supported by a strong net margin of 23.2% and a superior gross margin of 74.6%. EBIT margin near 30% highlights excellent cost control. Despite a revenue slowdown, M&T’s EPS and net income growth underscore robust operational momentum.
Margin Strength vs. Revenue Expansion
U.S. Bancorp drives higher revenue scale but trails M&T in net margin and profitability gains. M&T’s superior margins and consistent net income growth establish it as the more efficient operator. Investors seeking margin resilience and steady earnings growth may prefer M&T’s streamlined profile, while U.S. Bancorp offers broader top-line exposure with improving earnings quality.
Financial Ratios Comparison
These vital ratios act as a diagnostic tool to expose the underlying fiscal health, valuation premiums, and capital efficiency of the companies compared:
| Ratios | U.S. Bancorp (USB) | M&T Bank Corporation (MTB) |
|---|---|---|
| ROE | 11.62% | 9.77% |
| ROIC | 11.14% | 6.75% |
| P/E | 10.95 | 11.54 |
| P/B | 1.27 | 1.13 |
| Current Ratio | 2.73 | 0.32 |
| Quick Ratio | 2.73 | 0.32 |
| D/E | 1.20 | 0.45 |
| Debt-to-Assets | 11.26% | 6.12% |
| Interest Coverage | 0.66 | 1.04 |
| Asset Turnover | 0.062 | 0.058 |
| Fixed Asset Turnover | 11.38 | 0 (not reported) |
| Payout Ratio | 41.46% | 32.65% |
| Dividend Yield | 3.79% | 2.83% |
| Fiscal Year | 2025 | 2025 |
Efficiency & Valuation Duel: The Vital Signs
Financial ratios act as the company’s DNA, revealing hidden risks and operational excellence beyond surface-level numbers.
U.S. Bancorp
U.S. Bancorp posts a solid 11.6% ROE with a strong 17.7% net margin, signaling efficient profitability. The stock trades at a reasonable 10.95 P/E and 1.27 P/B, suggesting fair valuation. A 3.79% dividend yield rewards shareholders, reflecting a balanced capital allocation between payouts and reinvestment.
M&T Bank Corporation
M&T Bank delivers a higher net margin of 23.2% but a lower 9.8% ROE, indicating strong profitability but less equity efficiency. Valuation multiples remain attractive with an 11.54 P/E and 1.13 P/B. Its 2.83% dividend yield shows shareholder returns, though lower liquidity ratios raise caution on short-term resilience.
Balanced Profitability Meets Valuation Discipline
U.S. Bancorp offers a better blend of profitability and valuation discipline with more favorable liquidity and dividend metrics. M&T excels in net margin but faces liquidity and operational efficiency constraints. Investors seeking stable income and operational safety may prefer U.S. Bancorp’s profile.
Which one offers the Superior Shareholder Reward?
I compare U.S. Bancorp (USB) and M&T Bank Corporation (MTB) on dividends and buybacks for 2025. USB yields 3.79% with a payout ratio of 41.5%. MTB offers a lower 2.83% yield but a more conservative 32.6% payout. USB’s higher dividend payout is supported by solid free cash flow coverage, signaling sustainability. MTB’s reinvestment focus and modest payout suggest balanced growth and income. Both execute share buybacks, but USB’s higher financial leverage raises risk. Historically, USB’s aggressive distribution rewards yield investors seeking income, while MTB suits those valuing steady capital appreciation. I conclude USB offers a more attractive total return profile in 2026, balancing yield and buybacks, but investors must monitor leverage risks closely.
Comparative Score Analysis: The Strategic Profile
The radar chart reveals the core DNA and trade-offs that define U.S. Bancorp and M&T Bank Corporation’s financial profiles:
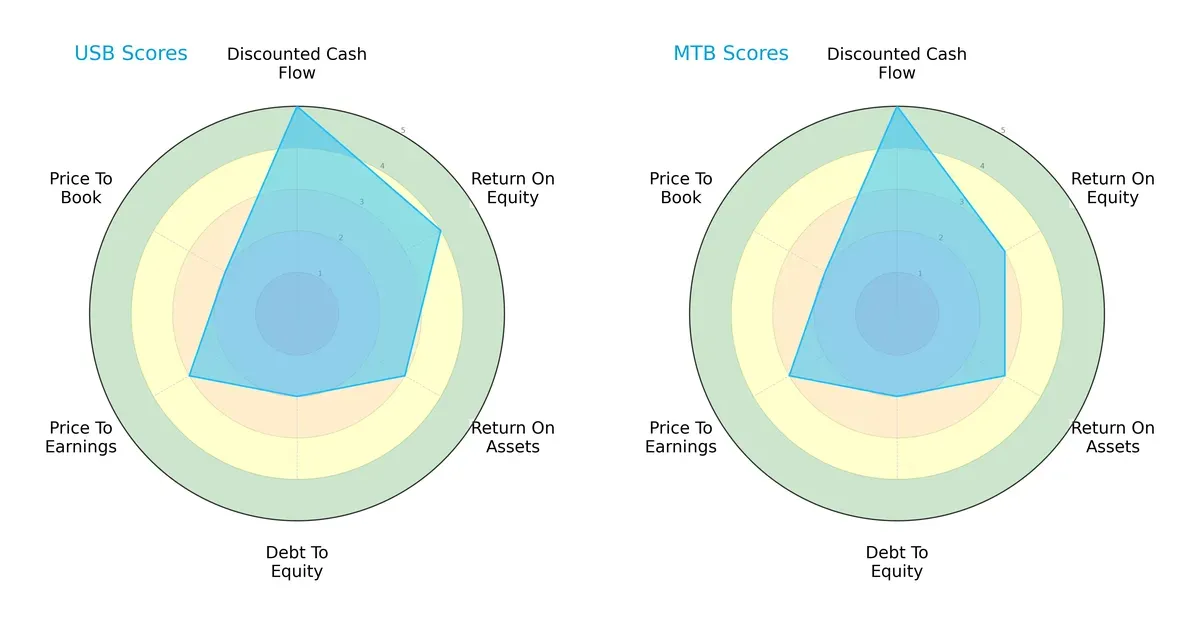
U.S. Bancorp edges M&T Bank with a stronger Return on Equity (4 vs. 3) and a slightly better Discounted Cash Flow score (both 5). Both firms share moderate profiles in Return on Assets (3) and Debt-to-Equity (2), indicating balanced leverage management. Valuation metrics (P/E and P/B) are identical and moderate for both. U.S. Bancorp shows a more diversified strength, while M&T relies more evenly on stable but less aggressive profitability metrics.
Bankruptcy Risk: Solvency Showdown
The Altman Z-Scores place both banks deep in the distress zone, signaling significant bankruptcy risk in this cycle:
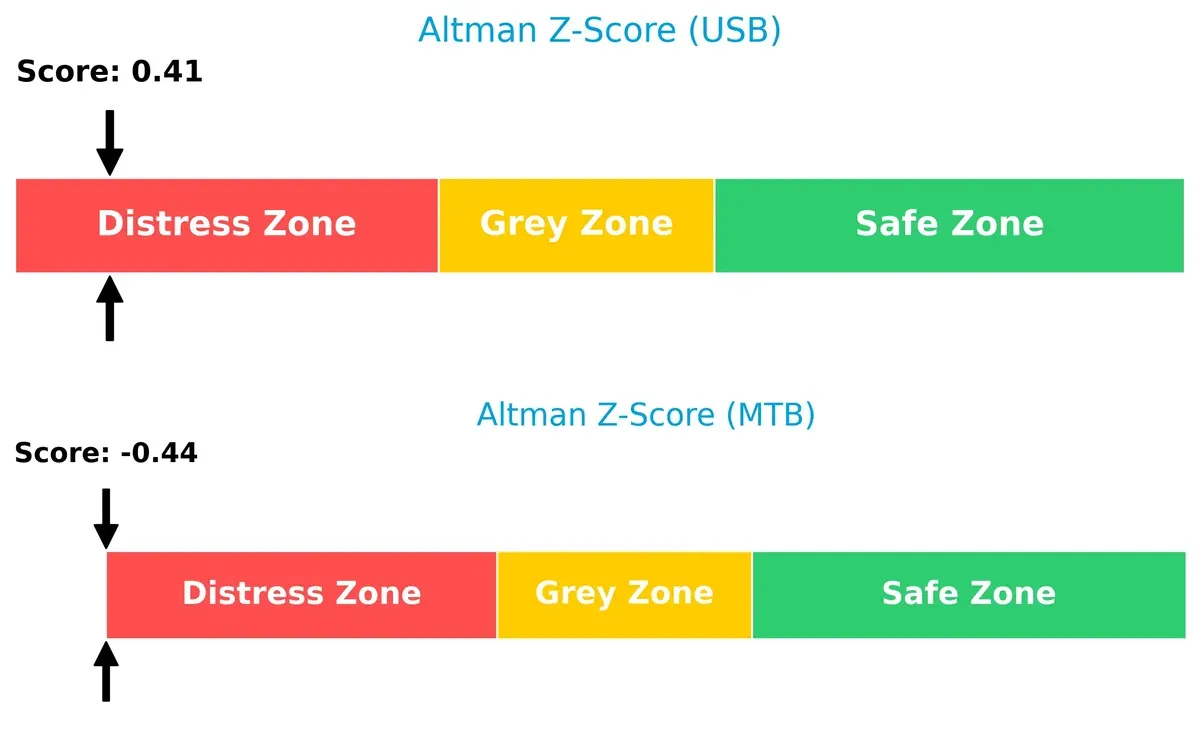
U.S. Bancorp posts a score of 0.41, slightly better than M&T’s -0.44, but both fall well below the 1.8 threshold. This suggests fragile solvency and heightened vulnerability to economic shocks, demanding cautious risk management from investors.
Financial Health: Quality of Operations
M&T Bank’s Piotroski F-Score of 8 signals robust financial health, outperforming U.S. Bancorp’s average 6 score:
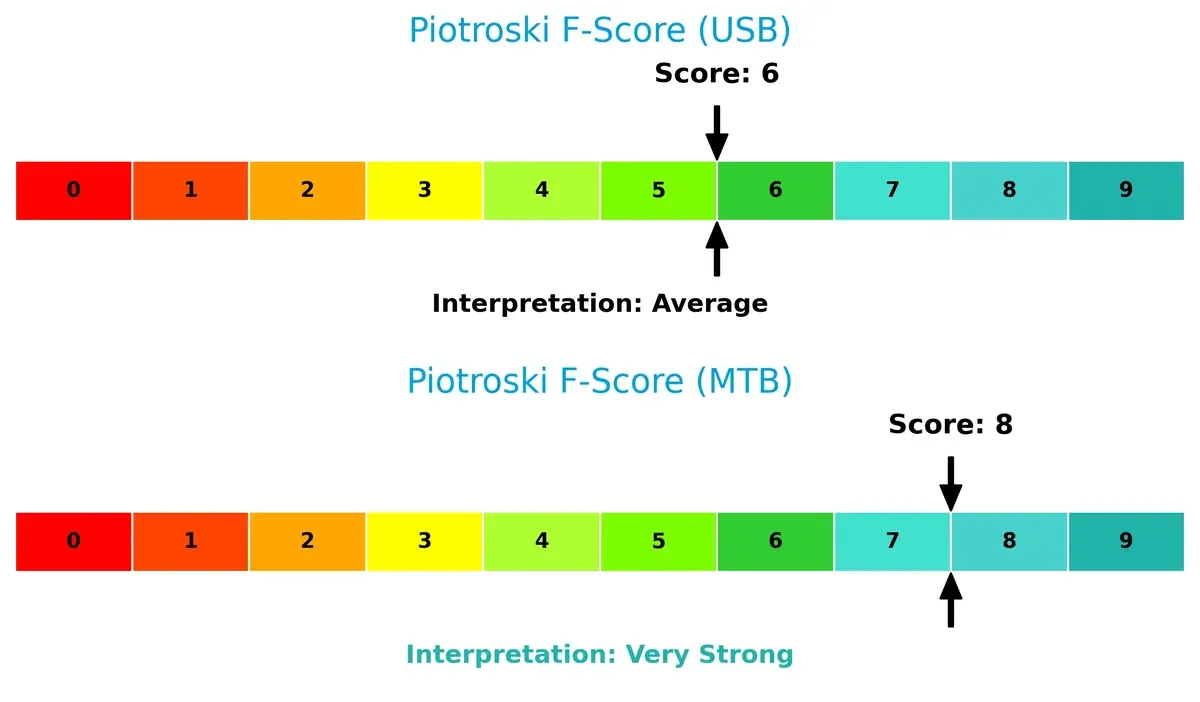
M&T’s very strong score reflects superior profitability, liquidity, and operational efficiency. U.S. Bancorp’s average score hints at some internal weaknesses and potential red flags. Investors should weigh M&T’s stronger quality metrics against both firms’ solvency risks carefully.
How are the two companies positioned?
This section dissects the operational DNA of USB and MTB by comparing their revenue distribution by segment alongside their internal strengths and weaknesses. The final objective is to confront their economic moats and identify which business model delivers the most resilient, sustainable competitive advantage in today’s market landscape.
Revenue Segmentation: The Strategic Mix
This visual comparison dissects how U.S. Bancorp and M&T Bank diversify their income streams and where their primary sector bets lie:
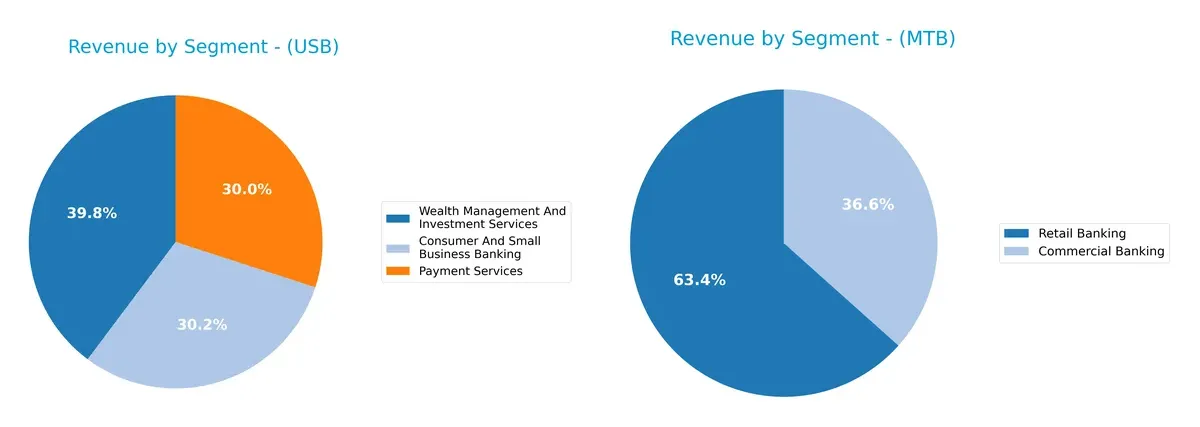
U.S. Bancorp anchors its revenue in Wealth Management and Consumer Banking, with $12.2B and $9.3B respectively in 2024. Payment Services also contribute $9.2B, showing a balanced portfolio. M&T Bank relies heavily on Retail ($471M) and Commercial Banking ($272M), revealing a narrower focus. USB’s diversified mix reduces concentration risk and supports ecosystem lock-in, while MTB’s concentrated model may face more volatility but leverages core banking strength.
Strengths and Weaknesses Comparison
This table compares the strengths and weaknesses of U.S. Bancorp and M&T Bank Corporation:
U.S. Bancorp Strengths
- Diversified revenue streams across multiple segments
- Favorable net margin at 17.68%
- Strong current and quick ratios at 2.73
- Reasonable PE and PB ratios
- Dividend yield at 3.79%
- Low debt to assets at 11.26%
M&T Bank Corporation Strengths
- Higher net margin at 23.16%
- Favorable debt to equity and debt to assets ratios
- Favorable PE and PB ratios
- Dividend yield at 2.83%
- Moderate interest coverage ratio
U.S. Bancorp Weaknesses
- Unfavorable ROIC vs. WACC indicates weak capital efficiency
- Elevated debt to equity at 1.2
- Low interest coverage at 0.66
- Low asset turnover at 0.06
M&T Bank Corporation Weaknesses
- Low current and quick ratios at 0.32, signaling liquidity risk
- Unfavorable ROE and WACC metrics
- Zero fixed asset turnover
- Interest coverage slightly weak at 1.04
- Higher proportion of unfavorable ratios overall
Both banks show strengths in profitability and valuation metrics, but USB’s broader diversification and liquidity ratios contrast with MTB’s more concentrated revenue and liquidity challenges. These factors reveal differing capital allocation efficiencies and risk profiles that shape each firm’s strategic outlook.
The Moat Duel: Analyzing Competitive Defensibility
A structural moat guards a company’s long-term profits against relentless competitive pressures and market erosion. Here’s how these two regional banks defend their turf:
U.S. Bancorp: Efficiency and Diversification Moat
U.S. Bancorp leverages a diversified business model and operational efficiency. Despite shedding value (ROIC below WACC), its rising ROIC trend and stable margins signal improving profitability. Expansion in wealth and payment services could deepen this moat in 2026.
M&T Bank Corporation: Traditional Regional Banking Moat
M&T Bank depends heavily on strong regional customer relationships and commercial lending. Its ROIC lags WACC with a declining trend, reflecting shrinking profitability. Yet, its higher margins and disciplined credit risk management sustain competitive positioning. Growth may hinge on geographic expansion or digital transformation.
Verdict: Operational Efficiency vs. Regional Loyalty
U.S. Bancorp holds a slightly wider moat with improving capital efficiency and diversified revenue streams. M&T’s moat is narrower and weakening amid profitability pressures. I see U.S. Bancorp better equipped to defend and grow market share in a competitive banking landscape.
Which stock offers better returns?
Over the past year, both U.S. Bancorp and M&T Bank Corporation showed strong price appreciation with accelerating bullish trends, marked by significant gains and dominant buyer activity.
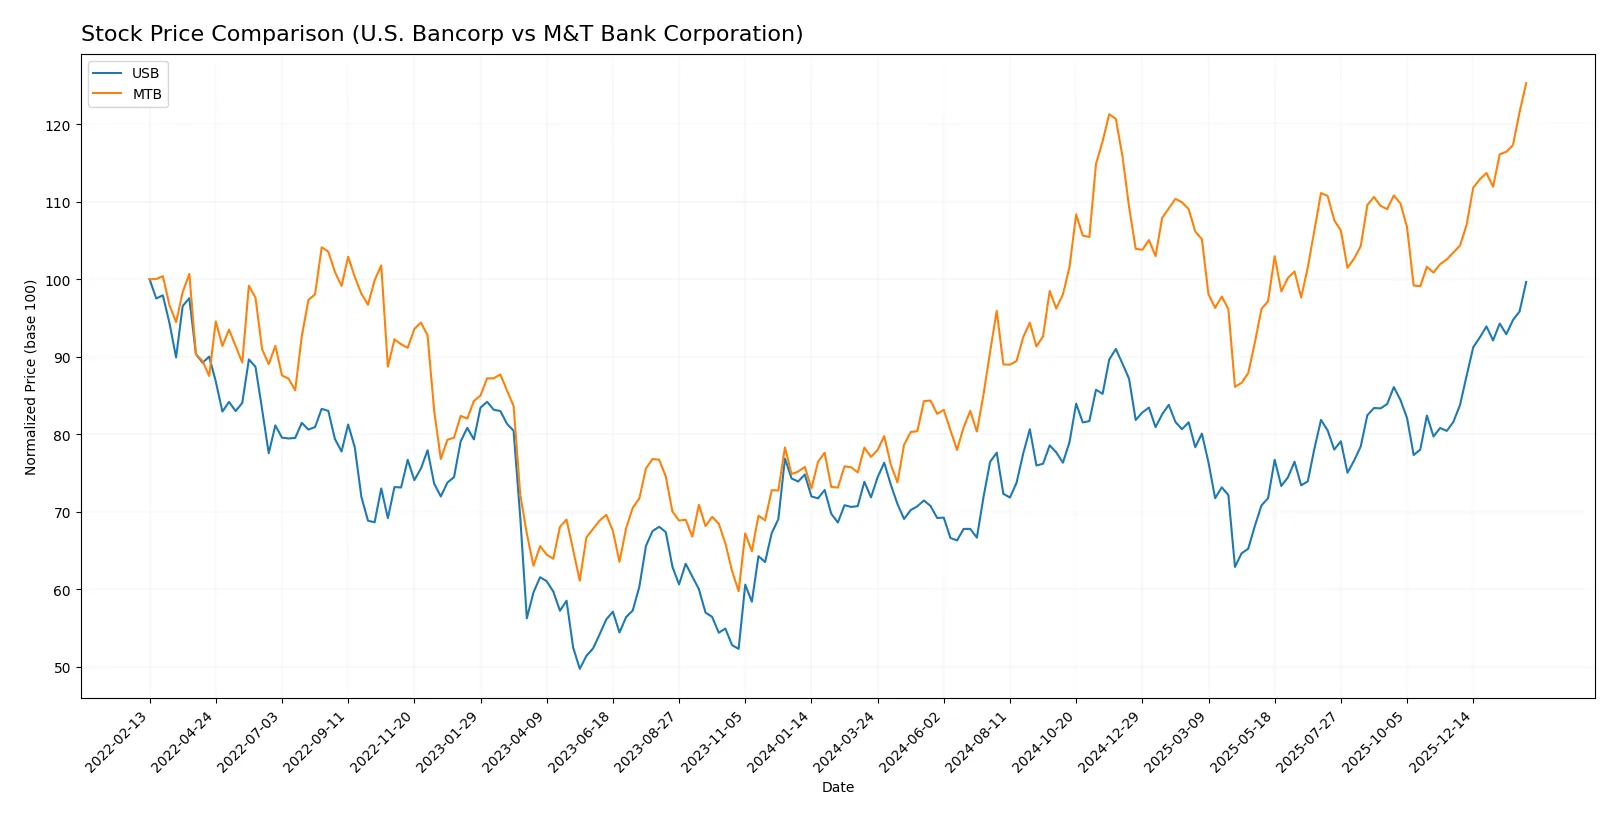
Trend Comparison
U.S. Bancorp’s stock rose 38.66% over the last 12 months, showing acceleration and a bullish trend with a low volatility of 4.49%. The price ranged from $36.83 to $58.35.
M&T Bank’s stock gained 62.53% over the same period, also accelerating on a bullish trend but with higher volatility at 22.04%. Prices fluctuated between $134.56 and $228.41.
M&T Bank delivered the highest market performance, outperforming U.S. Bancorp by nearly 24 percentage points despite greater price variability.
Target Prices
Analysts present a bullish consensus for U.S. Bancorp and M&T Bank Corporation, reflecting solid confidence in regional banks.
| Company | Target Low | Target High | Consensus |
|---|---|---|---|
| U.S. Bancorp | 50 | 65 | 58.13 |
| M&T Bank Corporation | 208 | 255 | 230.8 |
The target consensus for U.S. Bancorp sits just below its current price of 58.51, suggesting modest upside potential. M&T Bank’s consensus target slightly exceeds its current price of 229.08, indicating room for growth amid stable fundamentals.

Don’t Let Luck Decide Your Entry Point
Optimize your entry points with our advanced ProRealTime indicators. You’ll get efficient buy signals with precise price targets for maximum performance. Start outperforming now!
How do institutions grade them?
U.S. Bancorp Grades
Below is a summary of recent grade actions from major grading companies for U.S. Bancorp:
| Grading Company | Action | New Grade | Date |
|---|---|---|---|
| Argus Research | Maintain | Buy | 2026-01-22 |
| DA Davidson | Maintain | Buy | 2026-01-21 |
| Keefe, Bruyette & Woods | Maintain | Market Perform | 2026-01-21 |
| Truist Securities | Maintain | Hold | 2026-01-21 |
| TD Cowen | Maintain | Buy | 2026-01-21 |
| RBC Capital | Maintain | Outperform | 2026-01-21 |
| Oppenheimer | Maintain | Outperform | 2026-01-21 |
| TD Cowen | Maintain | Buy | 2026-01-07 |
| Wolfe Research | Downgrade | Peer Perform | 2026-01-07 |
| Barclays | Maintain | Overweight | 2026-01-05 |
M&T Bank Corporation Grades
Here are the latest grading updates from key institutions for M&T Bank Corporation:
| Grading Company | Action | New Grade | Date |
|---|---|---|---|
| RBC Capital | Maintain | Outperform | 2026-01-20 |
| Jefferies | Maintain | Buy | 2026-01-16 |
| Wolfe Research | Downgrade | Peer Perform | 2026-01-07 |
| TD Cowen | Maintain | Buy | 2026-01-07 |
| B of A Securities | Downgrade | Neutral | 2026-01-07 |
| Evercore ISI Group | Downgrade | In Line | 2026-01-06 |
| Barclays | Maintain | Equal Weight | 2026-01-05 |
| Keefe, Bruyette & Woods | Maintain | Market Perform | 2025-12-17 |
| Truist Securities | Downgrade | Hold | 2025-12-12 |
| TD Cowen | Maintain | Buy | 2025-10-20 |
Which company has the best grades?
U.S. Bancorp holds generally stronger grades, with multiple ‘Buy’ and ‘Outperform’ ratings maintained recently. M&T Bank faces more downgrades and neutral ratings. This contrast may influence investor confidence and portfolio positioning.
Risks specific to each company
The following categories identify the critical pressure points and systemic threats facing both firms in the 2026 market environment:
1. Market & Competition
U.S. Bancorp
- Faces intense regional bank competition, with pressure on net margins despite favorable pricing.
M&T Bank Corporation
- Operates in a narrower regional footprint, limiting scale but benefiting from strong niche market positioning.
2. Capital Structure & Debt
U.S. Bancorp
- Has higher debt-to-equity ratio (1.2), raising leverage risks despite favorable debt-to-assets ratio (11.26%).
M&T Bank Corporation
- Maintains lower leverage (D/E 0.45) and debt-to-assets (6.12%), indicating a more conservative capital structure.
3. Stock Volatility
U.S. Bancorp
- Exhibits higher beta (1.09), indicating greater sensitivity to market swings.
M&T Bank Corporation
- Shows lower beta (0.577), suggesting more stable stock price behavior amid market fluctuations.
4. Regulatory & Legal
U.S. Bancorp
- Subject to stringent federal regulations impacting lending and capital reserves.
M&T Bank Corporation
- Faces similar regulatory frameworks but with potentially less complexity due to smaller size and regional focus.
5. Supply Chain & Operations
U.S. Bancorp
- Large branch and ATM network requires significant operational and technology investments.
M&T Bank Corporation
- Smaller branch network reduces operational complexity but limits growth opportunities.
6. ESG & Climate Transition
U.S. Bancorp
- Increasing pressure to align with ESG goals, especially in sustainable lending and carbon footprint.
M&T Bank Corporation
- ESG initiatives are emerging but less mature, posing transitional risks in climate-sensitive sectors.
7. Geopolitical Exposure
U.S. Bancorp
- Primarily US-focused with limited international exposure, reducing geopolitical risk.
M&T Bank Corporation
- Operates mainly in US regional markets with a presence in Canada, adding moderate cross-border risk.
Which company shows a better risk-adjusted profile?
U.S. Bancorp’s most significant risk is its elevated financial leverage combined with moderate interest coverage, raising vulnerability in tightening credit conditions. M&T Bank’s primary concern lies in its weak liquidity ratios, exposing it to short-term funding stress. Despite this, M&T’s lower leverage and stock stability give it a slightly better risk-adjusted profile. Notably, U.S. Bancorp’s Altman Z-Score in the distress zone signals urgent financial risk, whereas M&T’s stronger Piotroski score reflects comparatively robust financial health.
Final Verdict: Which stock to choose?
U.S. Bancorp’s superpower lies in its resilient operational efficiency and strong capital structure, creating steady value despite a challenging ROIC versus WACC dynamic. Its point of vigilance remains the moderate debt-to-equity risk and interest coverage. This stock fits well in a portfolio seeking steady income with moderate growth—think Balanced Income.
M&T Bank commands a strategic moat through superior net margins and a robust dividend yield, reflecting disciplined capital allocation. While its declining ROIC trend and thinner liquidity profile introduce caution, it offers relative safety compared to U.S. Bancorp’s leverage profile. M&T suits investors favoring GARP strategies, balancing growth potential with reasonable valuation.
If you prioritize operational stability and a balanced income stream, U.S. Bancorp is the compelling choice due to its consistent profitability and conservative capital management. However, if you seek higher margin growth and a stronger dividend focus, M&T Bank offers better growth visibility despite its liquidity risks and declining capital efficiency.
Disclaimer: Investment carries a risk of loss of initial capital. The past performance is not a reliable indicator of future results. Be sure to understand risks before making an investment decision.
Go Further
I encourage you to read the complete analyses of U.S. Bancorp and M&T Bank Corporation to enhance your investment decisions: