Home > Comparison > Financial Services > TFC vs MTB
The strategic rivalry between Truist Financial Corporation and M&T Bank Corporation shapes the competitive landscape of the regional banking sector. Truist operates as a diversified financial services powerhouse across the Southeastern and Mid-Atlantic U.S., while M&T focuses on commercial and retail banking with a strong presence in the Northeastern U.S. This analysis pits Truist’s broad operational scale against M&T’s focused regional model to identify which offers a superior risk-adjusted return for diversified portfolios.

Table of contents
Companies Overview
Truist Financial and M&T Bank dominate the regional banking landscape with distinct market footprints and strategies.
Truist Financial Corporation: Southeastern Powerhouse in Banking and Wealth
Truist Financial Corporation stands as a regional banking leader in the Southeastern and Mid-Atlantic US. It generates revenue primarily through diversified banking services including consumer and corporate banking, wealth management, and insurance products. In 2021, Truist emphasized expanding its digital platforms and integrated financial solutions to deepen customer engagement and drive growth.
M&T Bank Corporation: Northeast Commercial and Retail Specialist
M&T Bank Corporation serves as a commercial and retail banking hub focused in the Northeast and Mid-Atlantic regions. Its core revenue derives from business banking, commercial real estate loans, and residential mortgage services. In 2021, M&T concentrated on strengthening its middle-market commercial lending and expanding trust and wealth management services to enhance client relationships.
Strategic Collision: Similarities & Divergences
Both banks operate as regional financial services providers with strong deposit and lending capabilities. Truist adopts a broader integrated financial services model including insurance, while M&T emphasizes commercial real estate and middle-market lending. Their primary battleground lies in capturing regional deposit growth and expanding wealth management. Truist’s scale contrasts with M&T’s niche focus, defining unique risk and growth profiles for investors.
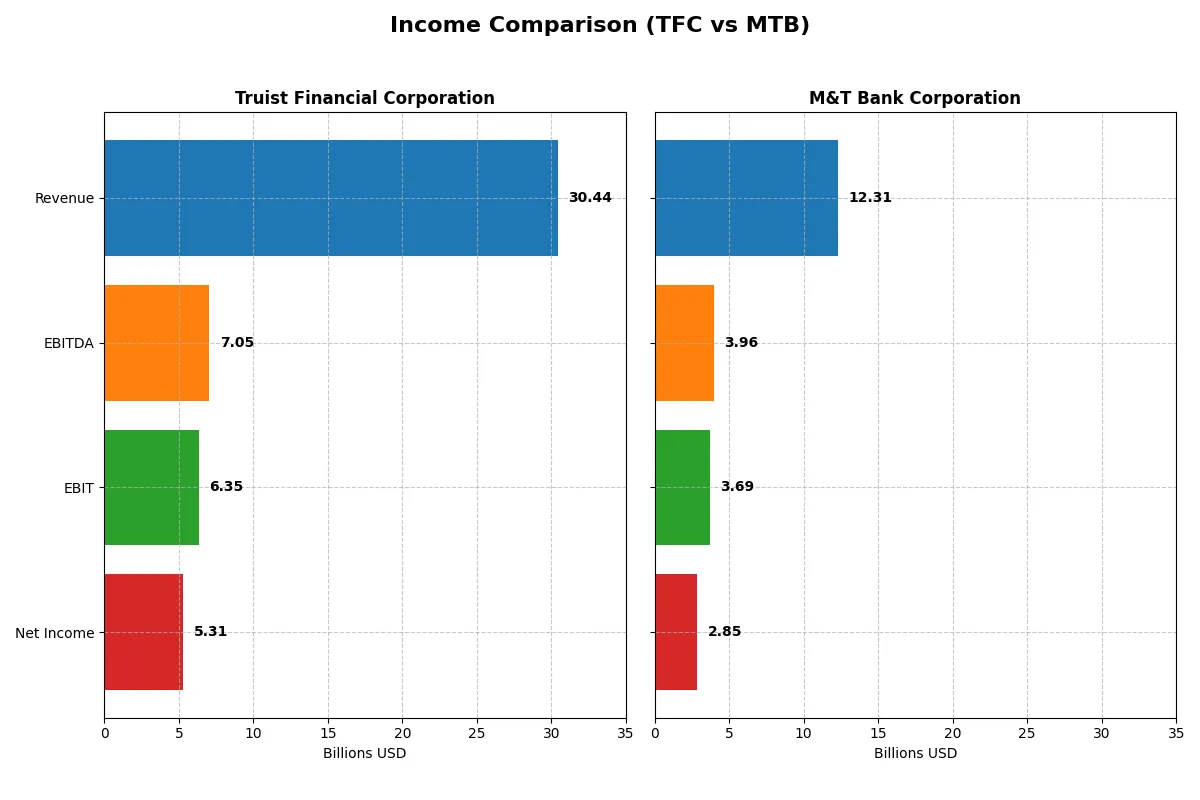
Income Statement Comparison
This data dissects the core profitability and scalability of both corporate engines to reveal who dominates the bottom line:
| Metric | Truist Financial Corporation (TFC) | M&T Bank Corporation (MTB) |
|---|---|---|
| Revenue | 30.4B | 12.3B |
| Cost of Revenue | 11.5B | 3.1B |
| Operating Expenses | 12.6B | 5.5B |
| Gross Profit | 18.9B | 9.2B |
| EBITDA | 7.1B | 4.0B |
| EBIT | 6.3B | 3.7B |
| Interest Expense | 10.1B | 3.5B |
| Net Income | 5.3B | 2.9B |
| EPS | 3.86 | 17.1 |
| Fiscal Year | 2025 | 2025 |
Income Statement Analysis: The Bottom-Line Duel
This income statement comparison reveals which company operates more efficiently and delivers stronger profitability momentum.
Truist Financial Corporation Analysis
Truist’s revenue grew sharply to 30.4B in 2025, up 25.5% year-over-year, but net income fell slightly to 5.3B. Gross margin remains solid at 62.2%, and EBIT margin improved dramatically to 20.9%, signaling operational leverage. Despite interest expenses weighing heavily at 33.2% of revenue, Truist regained momentum after prior losses, highlighting resilient core earnings.
M&T Bank Corporation Analysis
M&T generated 12.3B in revenue in 2025, down 8.2% from the previous year. Net income rose to 2.85B, supported by a robust 74.6% gross margin and a strong 30.0% EBIT margin. Interest expense, while significant at 28.7%, is comparatively better managed. M&T’s margins and earnings per share show consistent growth and exceptional profitability despite recent revenue contraction.
Verdict: Margin Strength vs. Revenue Growth
Truist leads with impressive revenue growth and a recovering EBIT margin, though net income trends show volatility. M&T excels in margin efficiency and steady net income expansion despite a revenue dip. For investors prioritizing scale and turnaround potential, Truist offers appeal; those favoring margin stability and consistent earnings should consider M&T’s profile.
Financial Ratios Comparison
These vital ratios act as a diagnostic tool to expose the underlying fiscal health, valuation premiums, and capital efficiency of the companies analyzed:
| Ratios | Truist Financial Corporation (TFC) | M&T Bank Corporation (MTB) |
|---|---|---|
| ROE | 8.14% | 9.77% |
| ROIC | 3.61% | 6.75% |
| P/E | 11.75 | 11.54 |
| P/B | 0.96 | 1.13 |
| Current Ratio | 0.87 | 0.32 |
| Quick Ratio | 0.87 | 0.32 |
| D/E | 1.07 | 0.45 |
| Debt-to-Assets | 12.75% | 6.12% |
| Interest Coverage | 0.63 | 1.04 |
| Asset Turnover | 0.056 | 0.058 |
| Fixed Asset Turnover | 9.60 | N/A |
| Payout ratio | 49.67% | 32.65% |
| Dividend yield | 4.23% | 2.83% |
| Fiscal Year | 2025 | 2025 |
Efficiency & Valuation Duel: The Vital Signs
Financial ratios serve as a company’s DNA, exposing hidden risks and operational strengths critical for informed investment decisions.
Truist Financial Corporation
Truist posts a solid net margin of 17.44% but a modest ROE of 8.14%, indicating moderate profitability. Its P/E of 11.75 suggests the stock trades at a reasonable valuation. The company rewards shareholders with a healthy 4.23% dividend yield, balancing capital returns with reinvestment prudence.
M&T Bank Corporation
M&T shines with a higher net margin of 23.16% and a stronger ROE of 9.77%, reflecting efficient profit generation. The stock trades at a slightly lower P/E of 11.54, indicating fair valuation. It offers a 2.83% dividend yield, signaling steady shareholder returns amid conservative leverage.
Balanced Profitability vs. Valuation Discipline
Truist and M&T both exhibit fair valuations with distinct profitability profiles. Truist’s higher dividend yield suits income-focused investors, while M&T’s superior margins and ROE favor growth seekers. Risk-averse investors may prefer Truist’s stable payouts; growth-oriented investors might lean toward M&T’s operational efficiency.
Which one offers the Superior Shareholder Reward?
I compare Truist Financial Corporation (TFC) and M&T Bank Corporation (MTB) on dividends and buybacks. TFC yields 4.23% with a 50% payout ratio, while MTB yields 2.83% with a 33% payout ratio. MTB’s dividend is more conservatively covered by earnings, supporting sustainability. TFC’s payout is higher but risks free cash flow strain. Both run active buybacks, yet MTB’s stronger margins and lower leverage signal steadier capital returns. MTB’s balanced distribution and robust profitability offer a superior total shareholder return profile in 2026.
Comparative Score Analysis: The Strategic Profile
The radar chart reveals the fundamental DNA and trade-offs of Truist Financial Corporation and M&T Bank Corporation, highlighting their financial strengths and valuation nuances:
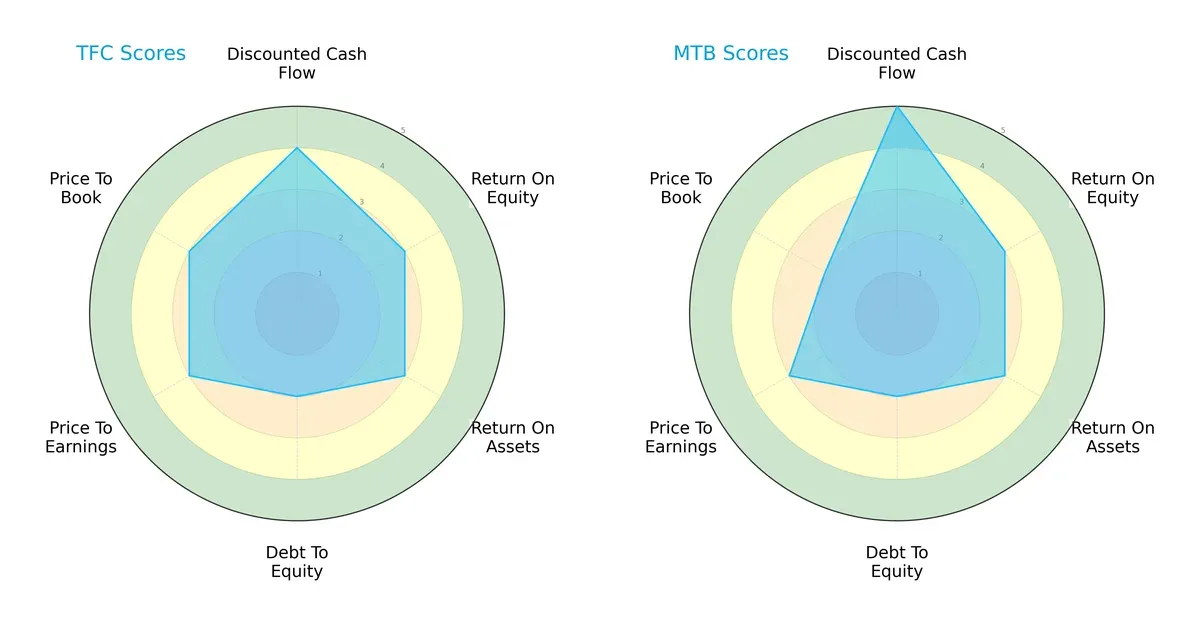
Truist shows a balanced profile with solid DCF (4) and moderate returns (ROE 3, ROA 3). M&T excels in DCF (5), suggesting stronger future cash flow expectations but trades at a slightly less attractive book value (P/B 2 vs. 3). Both companies share identical leverage risk (Debt/Equity 2) and valuation (P/E 3). Truist relies on valuation balance, while M&T leverages stronger cash flow projections.
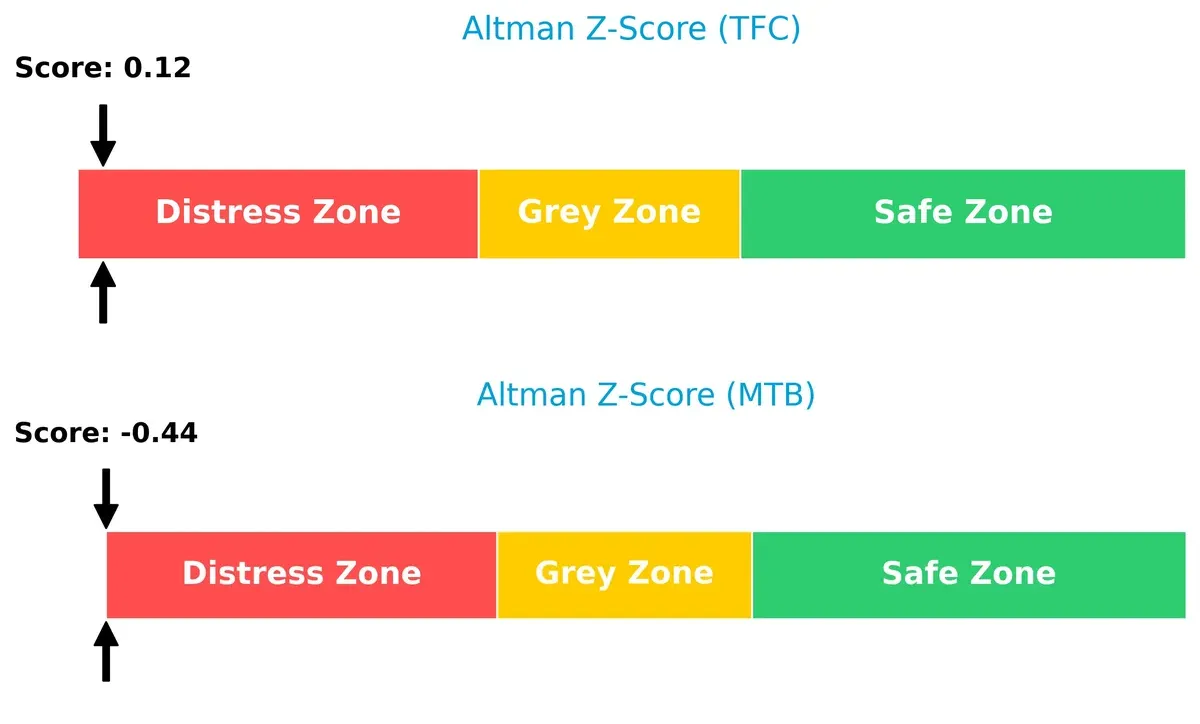
Bankruptcy Risk: Solvency Showdown
Truist’s Altman Z-Score (0.12) slightly outperforms M&T’s (-0.44), but both sit deep in the distress zone, signaling elevated bankruptcy risk in this economic cycle:
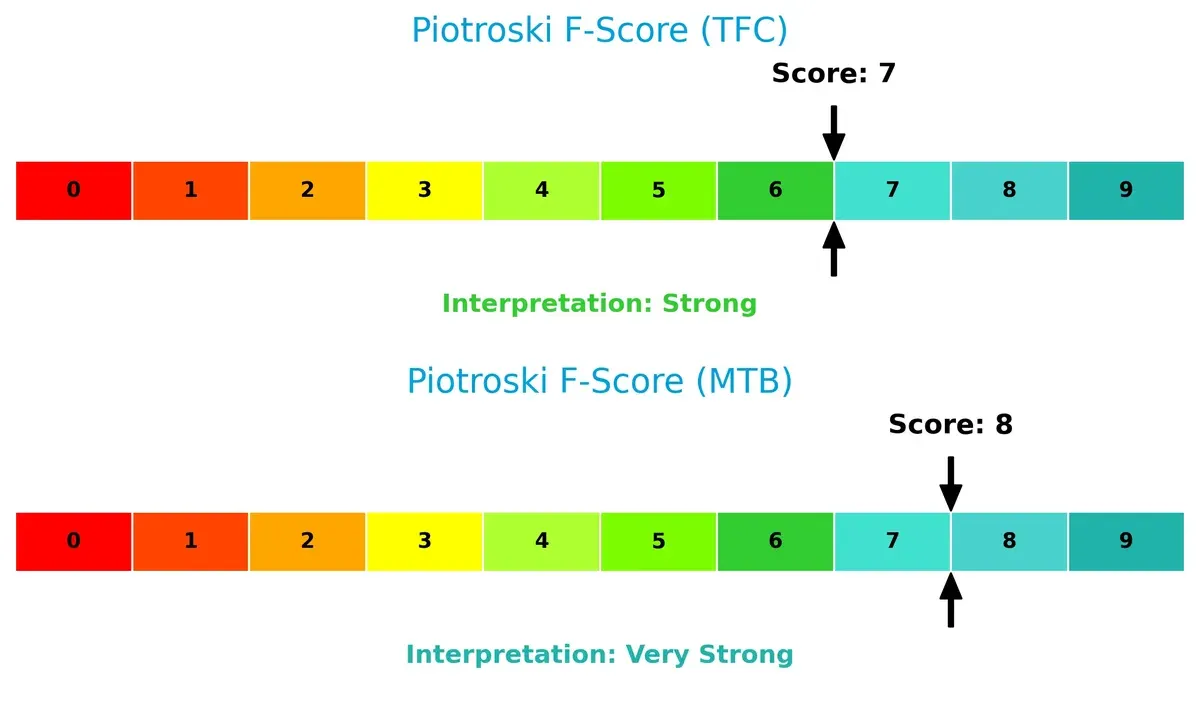
Financial Health: Quality of Operations
M&T’s Piotroski F-Score of 8 outpaces Truist’s 7, indicating superior operational health and fewer internal red flags, reinforcing M&T’s financial robustness:
How are the two companies positioned?
This section dissects Truist Financial Corporation and M&T Bank Corporation’s operational DNA by comparing revenue distribution and internal strengths and weaknesses. The objective is to confront their economic moats and identify which model delivers the most resilient competitive advantage today.
Revenue Segmentation: The Strategic Mix
This comparison dissects how Truist Financial Corporation and M&T Bank Corporation diversify their income streams and reveals where their primary sector bets lie:
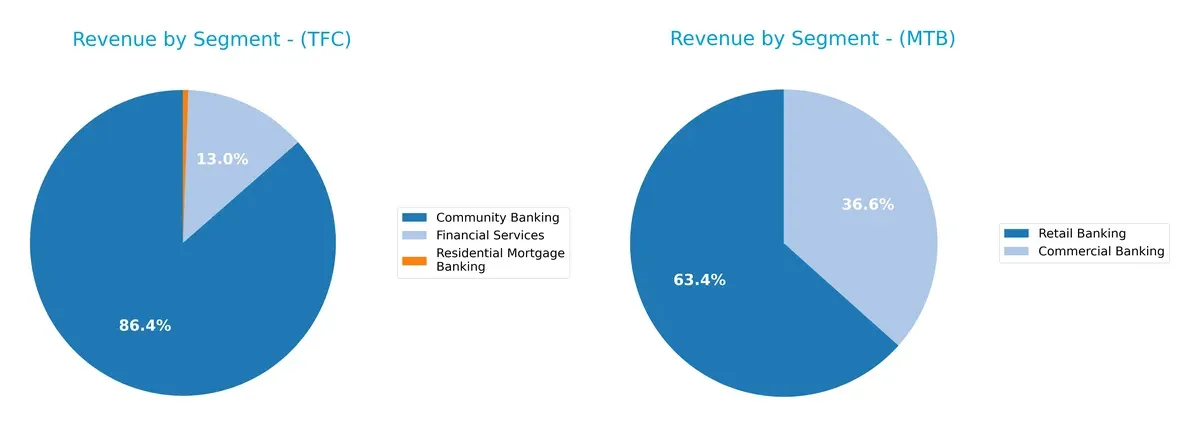
M&T Bank boasts a diversified revenue mix, with significant contributions from Retail Banking (471B in 2024) and Commercial Banking (272B), anchoring its income across multiple sectors. Truist Financial leans heavily on Community Banking (153B in 2016), with smaller Financial Services (23B) and negligible mortgage income. This concentration exposes Truist to higher sector risk, while M&T’s broad base suggests stronger ecosystem lock-in and infrastructure dominance.
Strengths and Weaknesses Comparison
This table compares the strengths and weaknesses of Truist Financial Corporation and M&T Bank Corporation:
Truist Financial Corporation Strengths
- Favorable net margin of 17.44%
- Strong dividend yield at 4.23%
- Low debt-to-assets ratio at 12.75%
- Favorable price-to-earnings at 11.75 and price-to-book at 0.96
- High fixed asset turnover at 9.6
M&T Bank Corporation Strengths
- Higher net margin of 23.16%
- Favorable debt-to-equity at 0.45 and debt-to-assets at 6.12%
- Favorable P/E at 11.54 and P/B at 1.13
- Significant revenue diversification across multiple banking segments
- Solid global presence with revenues reported in diverse geographic areas
Truist Financial Corporation Weaknesses
- Unfavorable return on equity at 8.14% and ROIC at 3.61%, below WACC of 9.06%
- Low current ratio at 0.87 indicating liquidity concerns
- Unfavorable debt-to-equity at 1.07
- Interest coverage at 0.63 below safe thresholds
- Negative revenues in treasury and corporate segment
- Limited revenue diversification outside community banking
M&T Bank Corporation Weaknesses
- Unfavorable return on equity at 9.77% and neutral ROIC at 6.75%, below WACC of 10.35%
- Very low current and quick ratios at 0.32 indicating liquidity risks
- Interest coverage at 1.04 is weak
- Zero fixed asset turnover suggests inefficiency
- Slightly unfavorable global ratios evaluation
Truist’s strengths lie in profitability metrics and asset efficiency but face liquidity and capital structure challenges. M&T shows stronger profitability and diversification but exhibits liquidity and operational efficiency risks. Each company’s financial profile suggests different strategic priorities concerning balance sheet management and growth focus.
The Moat Duel: Analyzing Competitive Defensibility
A structural moat is the only thing protecting long-term profits from the erosion of competition. Let’s dissect the core competitive advantages of two regional banks:
Truist Financial Corporation: Intangible Assets & Diversified Services
Truist’s moat stems from its broad service portfolio and brand recognition in the Southeast. This manifests in stable margins despite rising interest expenses. Expansion in wealth and insurance services could deepen its moat in 2026, yet margin pressure remains a risk.
M&T Bank Corporation: Focused Customer Relationships & Cost Efficiency
M&T leans on strong commercial client ties and operational efficiency. It sustains higher margins and better revenue growth than Truist’s recent year, though with a narrower geographic footprint. Potential lies in deepening commercial real estate lending and digital banking adoption.
Margin Stability vs. Client Intimacy: The Regional Bank Moat Battle
Both banks destroy value as ROIC lags WACC with declining trends, signaling weak moats overall. However, Truist’s scale and service diversity suggest a wider moat. M&T’s tighter niche offers depth but less resilience. Truist appears better positioned to defend market share amid rising competition.
Which stock offers better returns?
Over the past 12 months, both Truist Financial Corporation and M&T Bank Corporation exhibited strong price growth with accelerating bullish trends, marked by significant percentage gains and notable price volatility.
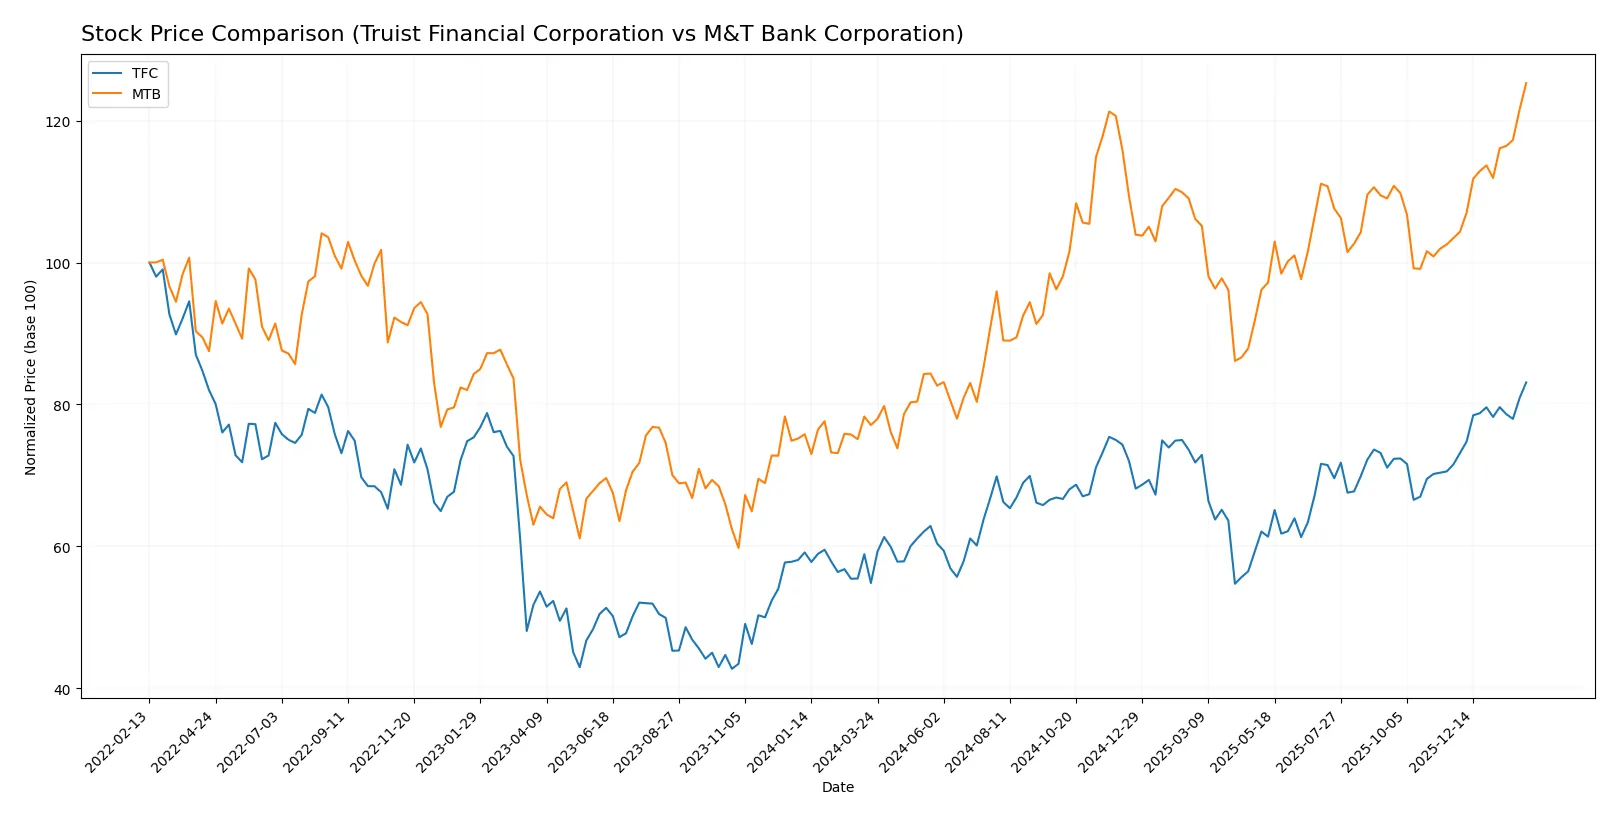
Trend Comparison
Truist Financial Corporation’s stock gained 51.55% over the past year, showing a bullish trend with accelerating momentum and moderate volatility (4.11% std deviation). The price ranged from $34.79 to $52.83.
M&T Bank Corporation’s stock advanced 62.53%, also bullish with acceleration, but with higher volatility (22.04% std deviation). Prices fluctuated between $134.56 and $228.41 during the same period.
M&T Bank outperformed Truist Financial with a higher overall return and greater recent price acceleration, despite its elevated volatility.
Target Prices
Analysts set a positive consensus on target prices for Truist Financial Corporation and M&T Bank Corporation.
| Company | Target Low | Target High | Consensus |
|---|---|---|---|
| Truist Financial Corporation | 50 | 58 | 54.38 |
| M&T Bank Corporation | 208 | 255 | 230.8 |
The target consensus for Truist suggests a modest upside from the current price of $53.66. M&T’s targets imply a slight appreciation above the current $228.5 price, reflecting cautious optimism.

Don’t Let Luck Decide Your Entry Point
Optimize your entry points with our advanced ProRealTime indicators. You’ll get efficient buy signals with precise price targets for maximum performance. Start outperforming now!
How do institutions grade them?
Truist Financial Corporation Grades
Below is a summary of recent grades assigned to Truist Financial Corporation by various institutions:
| Grading Company | Action | New Grade | Date |
|---|---|---|---|
| Argus Research | Maintain | Buy | 2026-01-23 |
| Piper Sandler | Maintain | Neutral | 2026-01-22 |
| TD Cowen | Maintain | Buy | 2026-01-22 |
| TD Cowen | Maintain | Buy | 2026-01-07 |
| Raymond James | Maintain | Outperform | 2026-01-07 |
| Evercore ISI Group | Upgrade | Outperform | 2026-01-06 |
| Barclays | Downgrade | Underweight | 2026-01-05 |
| Citigroup | Maintain | Buy | 2025-12-31 |
| Keefe, Bruyette & Woods | Maintain | Market Perform | 2025-12-17 |
| Morgan Stanley | Maintain | Equal Weight | 2025-12-17 |
M&T Bank Corporation Grades
Below is a summary of recent grades assigned to M&T Bank Corporation by various institutions:
| Grading Company | Action | New Grade | Date |
|---|---|---|---|
| RBC Capital | Maintain | Outperform | 2026-01-20 |
| Jefferies | Maintain | Buy | 2026-01-16 |
| Wolfe Research | Downgrade | Peer Perform | 2026-01-07 |
| TD Cowen | Maintain | Buy | 2026-01-07 |
| B of A Securities | Downgrade | Neutral | 2026-01-07 |
| Evercore ISI Group | Downgrade | In Line | 2026-01-06 |
| Barclays | Maintain | Equal Weight | 2026-01-05 |
| Keefe, Bruyette & Woods | Maintain | Market Perform | 2025-12-17 |
| Truist Securities | Downgrade | Hold | 2025-12-12 |
| TD Cowen | Maintain | Buy | 2025-10-20 |
Which company has the best grades?
Truist Financial Corporation generally holds more consistent Buy and Outperform ratings while M&T Bank shows mixed downgrades to Neutral and In Line. Truist’s stronger grades may signal firmer institutional confidence, potentially influencing investor sentiment positively.
Risks specific to each company
The following categories identify the critical pressure points and systemic threats facing both firms in the 2026 market environment:
1. Market & Competition
Truist Financial Corporation (TFC)
- Operates in competitive Southeast and Mid-Atlantic regions with diverse banking and insurance services.
M&T Bank Corporation (MTB)
- Focuses on Northeast US with strong commercial and retail banking, less geographic diversification.
2. Capital Structure & Debt
Truist Financial Corporation (TFC)
- Debt to equity ratio of 1.07 flagged as unfavorable, signaling higher leverage risk.
M&T Bank Corporation (MTB)
- Lower debt to equity at 0.45, a favorable score indicating stronger balance sheet.
3. Stock Volatility
Truist Financial Corporation (TFC)
- Beta of 0.855 shows moderate volatility, close to market average for regional banks.
M&T Bank Corporation (MTB)
- Beta of 0.577 indicates lower volatility and relative defensiveness in market swings.
4. Regulatory & Legal
Truist Financial Corporation (TFC)
- Broad service range including insurance increases regulatory complexity and compliance costs.
M&T Bank Corporation (MTB)
- More focused banking operations reduce regulatory exposure but still face standard banking regulations.
5. Supply Chain & Operations
Truist Financial Corporation (TFC)
- Large branch network (2,517 offices) demands complex operational management and technology investments.
M&T Bank Corporation (MTB)
- Smaller network (688 offices) eases operational strain but limits scale advantages.
6. ESG & Climate Transition
Truist Financial Corporation (TFC)
- Exposure to insurance and commercial lending sectors increases climate-related financial risks.
M&T Bank Corporation (MTB)
- Concentration in commercial real estate and lending adds vulnerability to climate transition policies.
7. Geopolitical Exposure
Truist Financial Corporation (TFC)
- Primarily US-focused with minimal international exposure, limiting geopolitical risks.
M&T Bank Corporation (MTB)
- Similar US-centric footprint with a single office in Canada, limiting foreign geopolitical impact.
Which company shows a better risk-adjusted profile?
Truist’s highest risk stems from its elevated leverage and operational complexity, while M&T’s main risk lies in its lower liquidity ratios and moderate regulatory exposure. M&T’s lower debt and beta suggest a more stable risk-adjusted profile. However, both firms fall into the distress zone on Altman Z-scores, signaling caution. M&T’s stronger Piotroski score (8 vs. 7) and very favorable discounted cash flow score highlight better financial health and valuation. The significant difference in debt-to-equity ratios and liquidity metrics justifies my concern about Truist’s capital structure risk.
Final Verdict: Which stock to choose?
Truist Financial Corporation (TFC) exhibits a superpower in operational efficiency and strong dividend yield, making it a reliable income engine. However, its declining return on invested capital signals a point of vigilance. TFC suits investors seeking steady income with moderate growth appetite.
M&T Bank Corporation (MTB) commands a strategic moat through superior net margins and a solid free cash flow profile. Its lower leverage and higher quality earnings offer better safety compared to TFC. MTB fits well within a GARP (Growth at a Reasonable Price) portfolio seeking balanced growth and capital preservation.
If you prioritize consistent income and operational efficiency, Truist Financial is the compelling choice due to its dividend strength and cost management. However, if you seek a blend of growth and financial resilience, M&T Bank offers better stability and a wider margin cushion, despite a slightly higher valuation risk.
Disclaimer: Investment carries a risk of loss of initial capital. The past performance is not a reliable indicator of future results. Be sure to understand risks before making an investment decision.
Go Further
I encourage you to read the complete analyses of Truist Financial Corporation and M&T Bank Corporation to enhance your investment decisions: