Home > Comparison > Financial Services > PNC vs MTB
The competitive dynamic between The PNC Financial Services Group and M&T Bank Corporation shapes the regional banking landscape. PNC operates as a diversified financial services powerhouse with broad retail, corporate, and asset management segments. In contrast, M&T Bank focuses on commercial and retail banking with a strong regional footprint and commercial real estate specialization. This analysis will evaluate which bank’s strategic model delivers superior risk-adjusted returns for a diversified portfolio in today’s evolving financial sector.
Table of contents
Companies Overview
The PNC Financial Services Group and M&T Bank Corporation stand as key regional banking powerhouses shaping U.S. financial services.
The PNC Financial Services Group, Inc.: Diversified Financial Services Leader
PNC dominates as a diversified financial services company with a broad revenue base from retail, corporate, and asset management segments. It generates income through deposits, loans, investment services, and advisory solutions. In 2026, PNC focuses on digital expansion and integrated customer experiences, leveraging its extensive branch and ATM network to deepen market penetration.
M&T Bank Corporation: Focused Regional Bank with Commercial Strength
M&T Bank operates primarily as a regional bank holding company with a core focus on commercial and retail banking services. It earns revenue through deposit accounts, lending, cash management, and real estate financing. The strategic emphasis in 2026 lies on middle-market commercial banking and expanding its footprint in key Northeastern U.S. markets via targeted lending and wealth management services.
Strategic Collision: Similarities & Divergences
Both banks emphasize retail and commercial banking, but PNC pursues a diversified, tech-driven model while M&T concentrates on traditional, relationship-based banking. They compete chiefly over middle-market commercial clients and wealth management customers. The contrast in scale and strategic agility creates distinct investment profiles—PNC as a broad financial services innovator, M&T as a focused regional specialist.
Income Statement Comparison
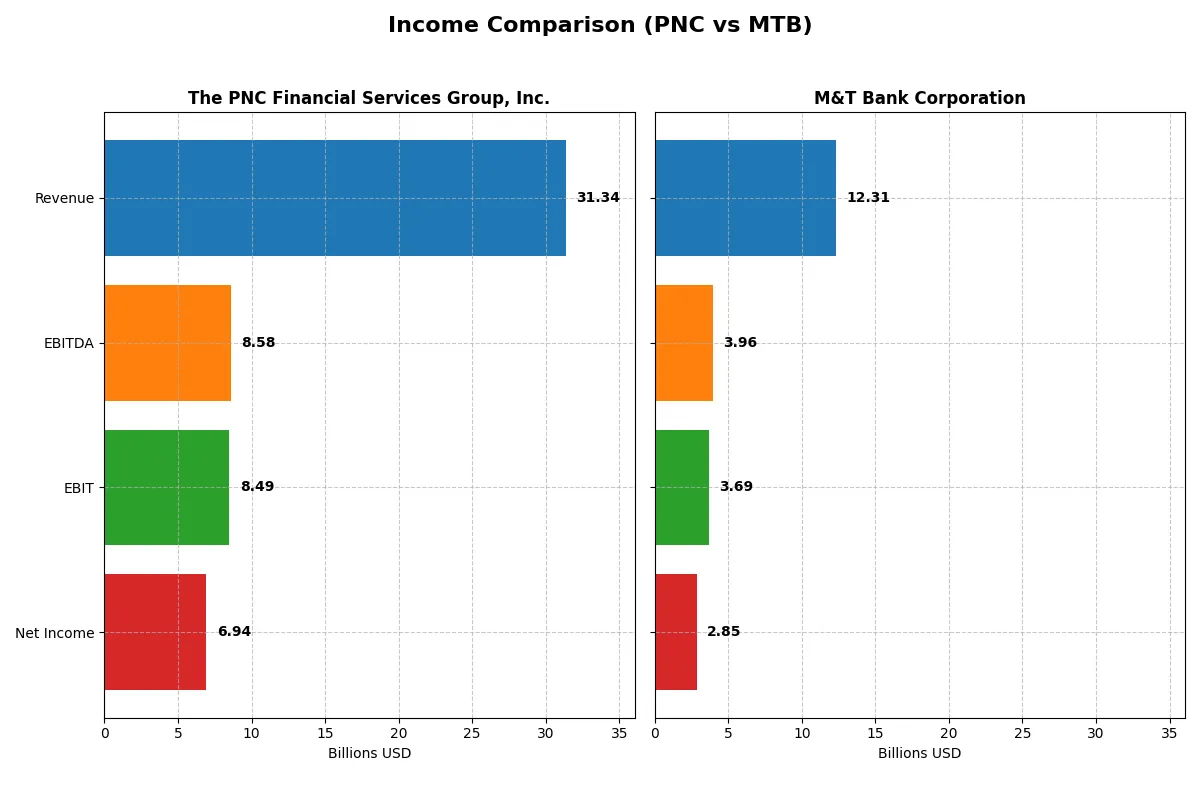
This data dissects the core profitability and scalability of both corporate engines to reveal who dominates the bottom line:
| Metric | The PNC Financial Services Group, Inc. (PNC) | M&T Bank Corporation (MTB) |
|---|---|---|
| Revenue | 31.3B | 12.3B |
| Cost of Revenue | 8.9B | 3.1B |
| Operating Expenses | 13.97B | 5.49B |
| Gross Profit | 22.46B | 9.19B |
| EBITDA | 8.58B | 3.96B |
| EBIT | 8.49B | 3.69B |
| Interest Expense | 10.9B | 3.54B |
| Net Income | 6.94B | 2.85B |
| EPS | 16.62 | 17.1 |
| Fiscal Year | 2025 | 2025 |
Income Statement Analysis: The Bottom-Line Duel
This income statement comparison reveals which company delivers superior operational efficiency and bottom-line strength over the recent market cycle.
The PNC Financial Services Group, Inc. Analysis
PNC’s revenue climbed from 20B in 2021 to 33.7B in 2024 before pulling back to 31.3B in 2025. Net income rose steadily, hitting 6.9B in 2025. Its gross margin remains robust at 71.7%, supporting a solid 22.1% net margin. Recent momentum shows improving profitability despite a slight revenue dip.
M&T Bank Corporation Analysis
MTB doubled revenue from 6.1B in 2021 to 13.4B in 2024, then declined to 12.3B in 2025. Net income grew from 1.9B to 2.9B over the same period. M&T’s gross margin at 74.6% and net margin at 23.2% reflect efficient cost control. Its earnings momentum remains strong amid a shrinking top line.
Margin Power vs. Revenue Scale
PNC leads with higher absolute revenue and net income, showing scale advantages. M&T edges out slightly on margin percentages, indicating leaner operations. PNC’s larger profit base makes it the fundamental winner for cash flow stability. Investors seeking scale and consistent earnings may favor PNC’s profile.
Financial Ratios Comparison
These vital ratios act as a diagnostic tool to expose the underlying fiscal health, valuation premiums, and capital efficiency of the companies compared below:
| Ratios | The PNC Financial Services Group, Inc. (PNC) | M&T Bank Corporation (MTB) |
|---|---|---|
| ROE | 11.45% | 9.77% |
| ROIC | 7.65% | 6.75% |
| P/E | 11.86 | 11.54 |
| P/B | 1.36 | 1.13 |
| Current Ratio | 0.81 | 0.32 |
| Quick Ratio | 0.81 | 0.32 |
| D/E (Debt to Equity) | 0.94 | 0.45 |
| Debt-to-Assets | 9.96% | 6.12% |
| Interest Coverage | 0.78 | 1.04 |
| Asset Turnover | 0.05 | 0.06 |
| Fixed Asset Turnover | 0 | 0 |
| Payout ratio | 37.49% | 32.65% |
| Dividend yield | 3.16% | 2.83% |
| Fiscal Year | 2025 | 2025 |
Efficiency & Valuation Duel: The Vital Signs
Ratios act as a company’s DNA, exposing hidden risks and operational strengths that guide investors through complex financial landscapes.
The PNC Financial Services Group, Inc.
PNC delivers solid net margins at 22.13% and a neutral ROE of 11.45%, reflecting stable profitability. Its P/E of 11.86 and P/B of 1.36 indicate a fairly valued stock. The company supports shareholders with a 3.16% dividend yield, balancing returns and reinvestment amid cautious capital allocation.
M&T Bank Corporation
MTB posts a superior net margin of 23.16% but a weaker ROE at 9.77%, signaling less efficient equity use. The stock trades at a favorable P/E of 11.54 and a lower P/B of 1.13, indicating modest valuation. A 2.83% dividend yield complements a conservative debt profile despite some liquidity concerns.
Balanced Valuation Meets Operational Resilience
PNC offers a steadier equity return and stronger dividend yield, while MTB excels in margin and capital structure efficiency. PNC suits investors valuing consistent returns; MTB appeals to those prioritizing margin strength and lower leverage risk.
Which one offers the Superior Shareholder Reward?
I see PNC offers a 3.16% dividend yield with a 37% payout ratio, supported by stable free cash flow coverage. PNC’s buybacks appear modest. MTB yields 2.83%, with a lower 33% payout ratio but stronger buyback intensity, enhancing total returns. MTB’s capital allocation favors buybacks, signaling shareholder value focus. PNC’s higher yield suits income seekers, but MTB’s balanced distribution and buybacks offer a more sustainable, attractive total return in 2026. I favor MTB for superior shareholder reward given its prudent payout and stronger buyback commitment.
Comparative Score Analysis: The Strategic Profile
The radar chart reveals the fundamental DNA and trade-offs of The PNC Financial Services Group, Inc. and M&T Bank Corporation:
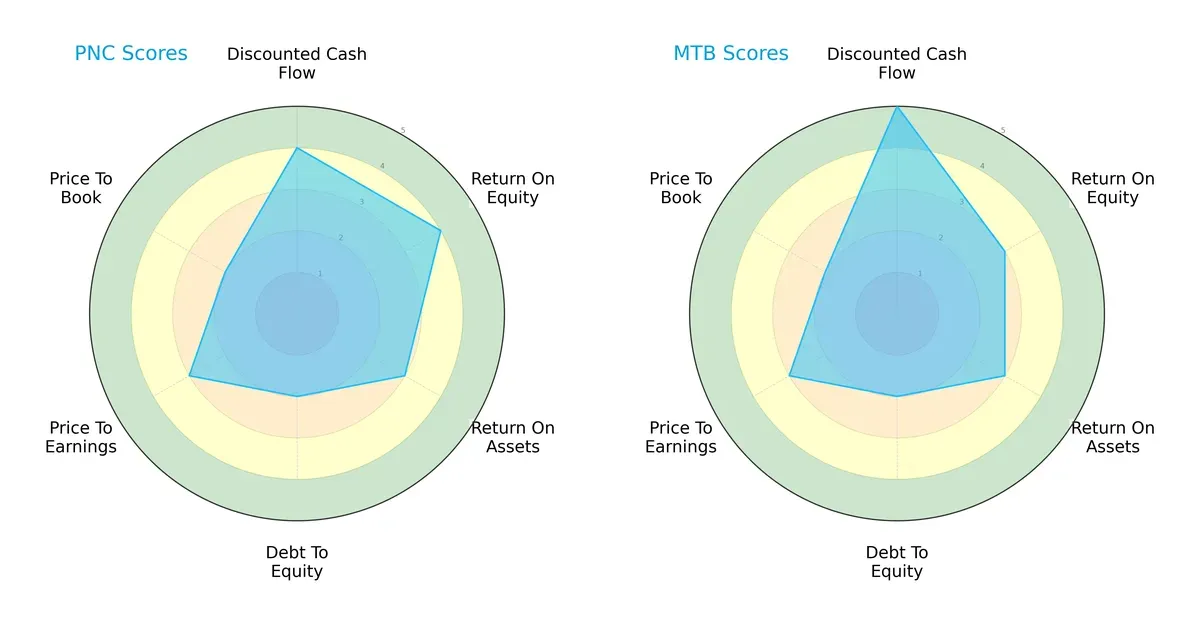
PNC shows a balanced profile with strengths in ROE (4) and DCF (4) but weaker leverage and valuation scores (2). MTB excels in DCF (5) indicating strong future cash flow potential but lags slightly in ROE (3). Both share moderate debt management (2) and valuation (P/E and P/B at 3 and 2). PNC relies on profitability efficiency, while MTB’s edge is future cash flow, making PNC more balanced overall.
Bankruptcy Risk: Solvency Showdown
The Altman Z-Score gap highlights serious solvency concerns for both firms:
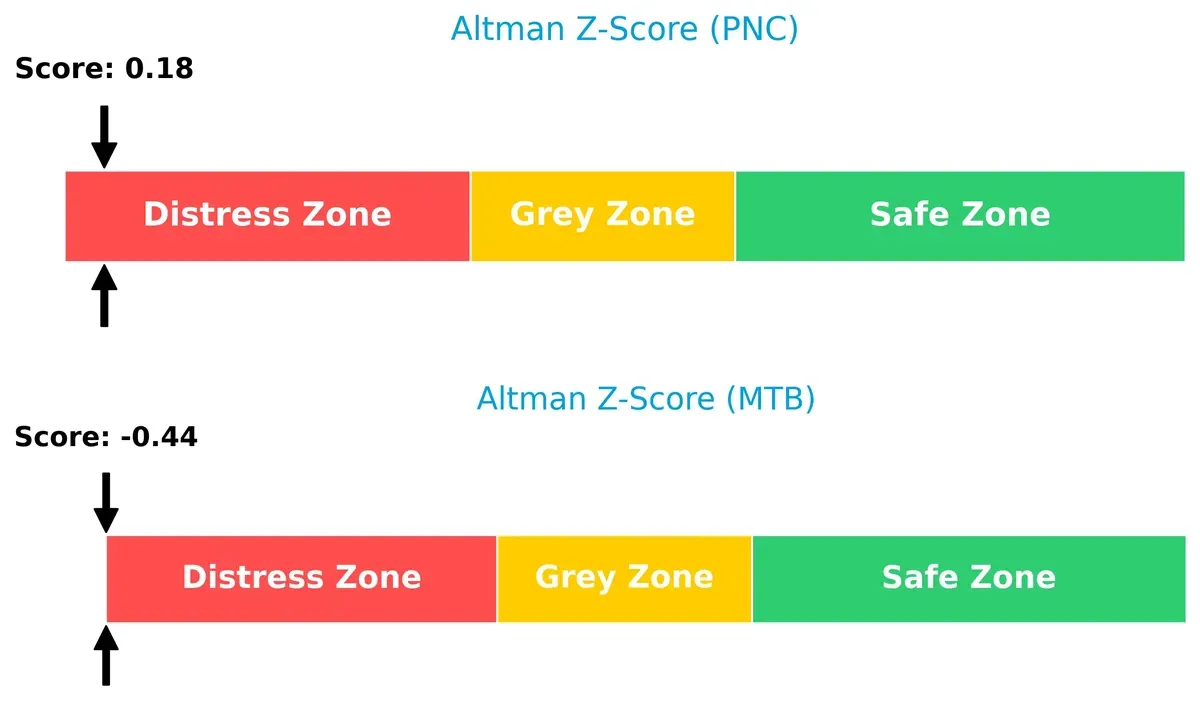
Both PNC (0.18) and MTB (-0.44) sit deep in the distress zone, signaling elevated bankruptcy risk amid this cycle’s volatility. MTB’s negative score suggests a more precarious position, requiring close monitoring of capital buffers.
Financial Health: Quality of Operations
Piotroski F-Scores distinguish operational robustness between the two companies:
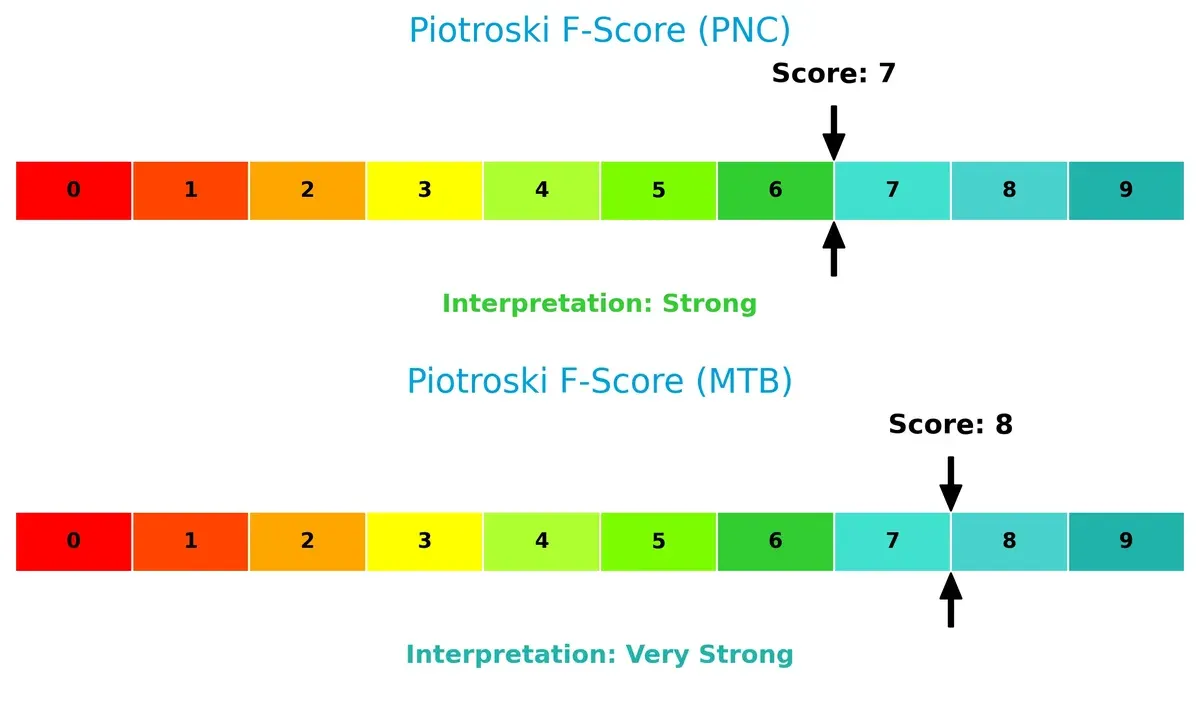
MTB scores an impressive 8, reflecting very strong financial health and internal metrics. PNC’s 7 is strong but flags slightly weaker fundamentals. MTB’s higher score signals better profitability, liquidity, and operational efficiency, tipping the scale in its favor for quality of operations.
How are the two companies positioned?
This section dissects the operational DNA of PNC and MTB by comparing revenue distribution and internal dynamics. The goal is to confront their economic moats to reveal the more resilient, sustainable competitive advantage today.
Revenue Segmentation: The Strategic Mix
This visual comparison dissects how The PNC Financial Services Group and M&T Bank diversify their income streams and reveals their primary sector bets:
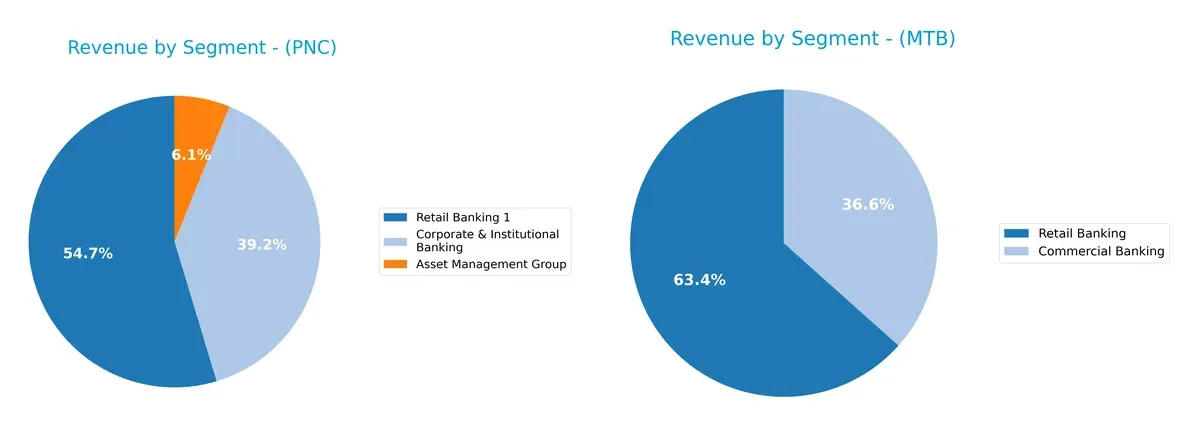
PNC anchors revenue in Retail Banking at $12.9B, dwarfing its Corporate & Institutional Banking ($9.3B) and Asset Management ($1.45B). M&T Bank shows a more fragmented mix, with Retail Banking ($471M) and Commercial Banking ($272M) closer in scale, plus Mortgage and Fiduciary segments adding diversity. PNC’s concentration in retail banking signals strong consumer ecosystem lock-in, while M&T’s spread reduces concentration risk but may dilute competitive advantage.
Strengths and Weaknesses Comparison
This table compares the strengths and weaknesses of PNC and MTB based on diversification, profitability, financials, innovation, global presence, and market share:
PNC Strengths
- Strong diversification across retail, corporate banking, and asset management
- Favorable net margin at 22.13%
- Competitive PE of 11.86 and PB at 1.36
- Favorable dividend yield at 3.16%
- Debt-to-assets low and favorable at 9.96%
MTB Strengths
- Favorable net margin at 23.16%
- Lower debt-to-equity ratio at 0.45 indicating conservative leverage
- Favorable PE of 11.54 and PB at 1.13
- Favorable debt-to-assets at 6.12%
- Diversified revenue segments including commercial, retail, fiduciary, and mortgage banking
PNC Weaknesses
- Current ratio below 1 at 0.81 signals potential liquidity risk
- WACC above ROIC at 11.17% vs 7.65%
- Interest coverage below 1 at 0.78 raises solvency concerns
- Low asset turnover at 0.05
- Neutral ROE at 11.45% with WACC unfavorable
- Lack of explicit global presence data
MTB Weaknesses
- Current and quick ratios very low at 0.32, indicating weak short-term liquidity
- WACC of 10.38% still above ROIC at 6.75%
- ROE unfavorable at 9.77%
- Interest coverage just above 1 at 1.04
- Asset turnover low at 0.06
- Global presence limited and unclear, possible concentration risk
Both banks show solid profitability and valuation metrics, but liquidity and capital efficiency present challenges. PNC’s broader business lines may offer resilience, while MTB’s conservative leverage supports stability. Both must address liquidity ratios to strengthen financial flexibility.
The Moat Duel: Analyzing Competitive Defensibility
A structural moat is the only reliable shield preserving long-term profits from relentless competition erosion:
The PNC Financial Services Group, Inc.: Expanding Profitability Despite Value Pressure
PNC’s primary moat lies in its intangible assets and diversified service network, reflected in a growing ROIC trend despite ROIC below WACC. Margin stability supports resilience. New digital offerings could deepen this moat in 2026.
M&T Bank Corporation: Narrowing Moat with Declining Capital Efficiency
MTB relies on cost advantage through efficient operations but faces a shrinking moat with ROIC below WACC and a declining trend. Although margins hold firm, MTB must innovate or expand markets to reverse value erosion.
Verdict: Intangible Assets Growth vs. Cost Efficiency Decline
PNC holds a deeper moat, driven by improving profitability and strategic expansion, while MTB’s shrinking ROIC signals weakening defensibility. PNC stands better poised to defend its market share in 2026.
Which stock offers better returns?
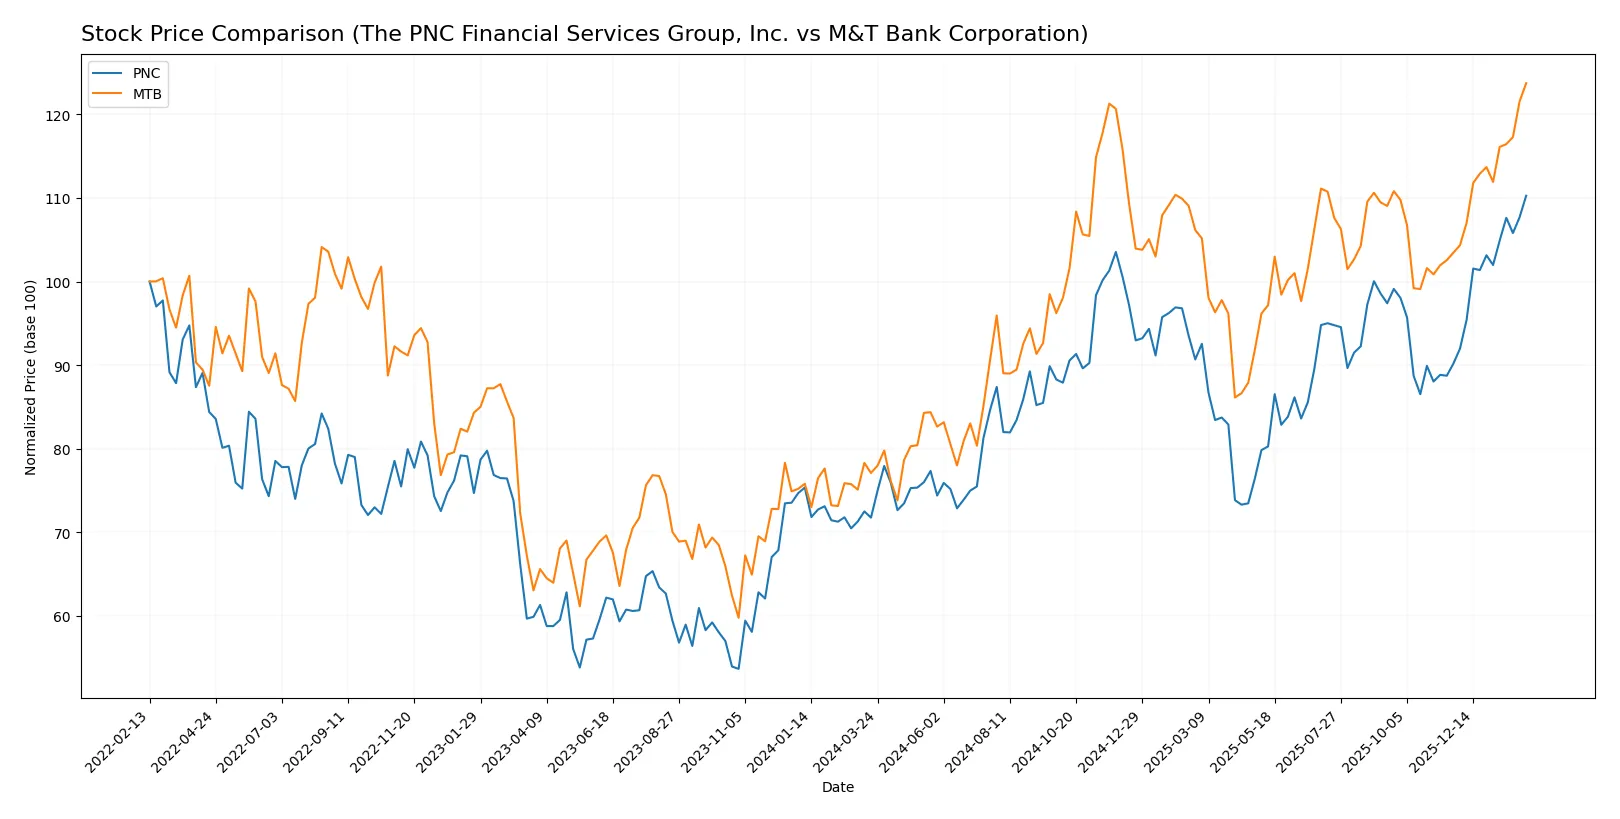
The past year shows strong upward momentum for both stocks, with MTB slightly outperforming PNC in total price appreciation and notable acceleration in their bullish trends.
Trend Comparison
PNC’s stock gained 53.68% over the past year, showing a bullish trend with accelerating momentum. It hit a high of 228.65 and maintained a standard deviation of 19.87, indicating moderate volatility.
MTB’s stock rose 60.52% over the same period, reflecting a bullish and accelerating trend. It reached a peak of 225.58 with a higher volatility at 21.98 standard deviation.
MTB delivered stronger market performance than PNC with a higher total price gain and similar acceleration, despite slightly greater volatility.
Target Prices
Analysts present a moderately bullish consensus for these regional banks, reflecting confidence in their steady financial performance.
| Company | Target Low | Target High | Consensus |
|---|---|---|---|
| The PNC Financial Services Group, Inc. | 206 | 284 | 239.1 |
| M&T Bank Corporation | 208 | 255 | 230.8 |
The consensus targets for PNC and M&T Bank sit above their current prices of 229 and 225.9 respectively, indicating expected moderate appreciation.

Don’t Let Luck Decide Your Entry Point
Optimize your entry points with our advanced ProRealTime indicators. You’ll get efficient buy signals with precise price targets for maximum performance. Start outperforming now!
How do institutions grade them?
Institutional grades for The PNC Financial Services Group, Inc. and M&T Bank Corporation are summarized below:
The PNC Financial Services Group, Inc. Grades
The table shows recent grade actions from leading grading firms for PNC:
| Grading Company | Action | New Grade | Date |
|---|---|---|---|
| RBC Capital | Maintain | Outperform | 2026-01-20 |
| TD Cowen | Maintain | Buy | 2026-01-20 |
| Wells Fargo | Maintain | Overweight | 2026-01-20 |
| Morgan Stanley | Maintain | Underweight | 2026-01-20 |
| Keefe, Bruyette & Woods | Maintain | Market Perform | 2026-01-20 |
| Oppenheimer | Maintain | Outperform | 2026-01-20 |
| TD Cowen | Maintain | Buy | 2026-01-07 |
| Barclays | Maintain | Overweight | 2026-01-05 |
| Truist Securities | Maintain | Hold | 2025-12-18 |
| Keefe, Bruyette & Woods | Maintain | Market Perform | 2025-12-17 |
M&T Bank Corporation Grades
The table presents recent grading updates from recognized firms for MTB:
| Grading Company | Action | New Grade | Date |
|---|---|---|---|
| RBC Capital | Maintain | Outperform | 2026-01-20 |
| Jefferies | Maintain | Buy | 2026-01-16 |
| Wolfe Research | Downgrade | Peer Perform | 2026-01-07 |
| TD Cowen | Maintain | Buy | 2026-01-07 |
| B of A Securities | Downgrade | Neutral | 2026-01-07 |
| Evercore ISI Group | Downgrade | In Line | 2026-01-06 |
| Barclays | Maintain | Equal Weight | 2026-01-05 |
| Keefe, Bruyette & Woods | Maintain | Market Perform | 2025-12-17 |
| Truist Securities | Downgrade | Hold | 2025-12-12 |
| TD Cowen | Maintain | Buy | 2025-10-20 |
Which company has the best grades?
PNC holds consistently higher ratings with multiple “Outperform” and “Buy” grades, while MTB shows several downgrades to “Hold,” “Neutral,” and “In Line.” Investors may view PNC’s superior grades as a signal of stronger institutional confidence.
Risks specific to each company
The following categories identify the critical pressure points and systemic threats facing both firms in the 2026 market environment:
1. Market & Competition
The PNC Financial Services Group, Inc.
- Operates a large diversified network with 2,591 branches and broad financial services, facing intense competition in retail and corporate banking.
M&T Bank Corporation
- More regionally concentrated with 688 offices, competing primarily in the Northeast and Mid-Atlantic, limiting scale but focusing on niche markets.
2. Capital Structure & Debt
The PNC Financial Services Group, Inc.
- Debt-to-assets at 9.96% is favorable; however, interest coverage is weak at 0.78, signaling potential strain on servicing debt.
M&T Bank Corporation
- Debt-to-assets lower at 6.12%, with slightly better interest coverage at 1.04, but very low current and quick ratios increase liquidity risk.
3. Stock Volatility
The PNC Financial Services Group, Inc.
- Beta of 0.968 reflects near-market volatility, implying moderate sensitivity to market swings.
M&T Bank Corporation
- Lower beta of 0.577 indicates less volatility and potentially more defensive stock behavior.
4. Regulatory & Legal
The PNC Financial Services Group, Inc.
- As a large national bank, PNC faces complex regulatory scrutiny across multiple jurisdictions, increasing compliance costs.
M&T Bank Corporation
- Regional focus limits regulatory complexity but exposes MTB to state-level regulatory shifts and regional economic volatility.
5. Supply Chain & Operations
The PNC Financial Services Group, Inc.
- Extensive branch and ATM network demands high operational efficiency; technology integration is critical to stay competitive.
M&T Bank Corporation
- Smaller footprint eases operational complexity but limits economies of scale and increases per-unit costs.
6. ESG & Climate Transition
The PNC Financial Services Group, Inc.
- Larger institution faces increased pressure to meet ESG goals and climate risk disclosures, impacting lending and investment policies.
M&T Bank Corporation
- Smaller scale provides agility but less influence in shaping industry ESG standards; may face challenges in capital allocation for green initiatives.
7. Geopolitical Exposure
The PNC Financial Services Group, Inc.
- Primarily US-focused, mitigating direct geopolitical risk but exposed to macroeconomic shifts and trade tensions affecting corporate clients.
M&T Bank Corporation
- US and limited Canadian operations expose MTB to cross-border regulatory and currency risks, though less impacted by global instability.
Which company shows a better risk-adjusted profile?
PNC’s largest risk is its weak interest coverage, posing debt servicing challenges despite favorable debt ratios. MTB’s critical risk lies in its low liquidity ratios, heightening short-term financial vulnerability. Despite PNC’s higher market sensitivity, I see its diversified scale and stronger overall financial scores as offering a better risk-adjusted profile. Notably, MTB’s Altman Z-Score remains in distress, signaling elevated bankruptcy risk despite a very strong Piotroski score, which underscores urgent liquidity and operational concerns.
Final Verdict: Which stock to choose?
The PNC Financial Services Group’s superpower lies in its improving profitability and disciplined capital allocation, which fuel steady earnings growth despite macro headwinds. A key point of vigilance remains its struggle to generate returns above its cost of capital, signaling cautious optimism. PNC fits well in an aggressive growth portfolio willing to tolerate some operational risk.
M&T Bank commands a strategic moat through solid margin management and a lower debt burden, delivering a safer income profile relative to PNC. However, its declining return on invested capital warns of eroding competitive advantage. MTB aligns with Growth at a Reasonable Price (GARP) strategies seeking stability with moderate upside.
If you prioritize growth fueled by rising profitability and can accept capital efficiency challenges, PNC is the compelling choice due to its upward ROIC trend and strong earnings momentum. However, if you seek better stability and a cleaner balance sheet, MTB offers superior capital structure and margin durability despite its value destruction signals. Both require close monitoring of their evolving moats.
Disclaimer: Investment carries a risk of loss of initial capital. The past performance is not a reliable indicator of future results. Be sure to understand risks before making an investment decision.
Go Further
I encourage you to read the complete analyses of The PNC Financial Services Group, Inc. and M&T Bank Corporation to enhance your investment decisions: