Home > Comparison > Financial Services > MTB vs RF
The strategic rivalry between M&T Bank Corporation and Regions Financial Corporation shapes the regional banking landscape in the U.S. M&T operates a diversified commercial and retail banking model focused on mid-Atlantic and Northeastern markets. Regions Financial emphasizes broad consumer and corporate banking across the South and Midwest with a strong wealth management arm. This analysis evaluates their distinct growth and risk profiles to identify the superior risk-adjusted investment opportunity for a diversified portfolio.

Table of contents
Companies Overview
M&T Bank Corporation and Regions Financial Corporation both command significant positions in the US regional banking sector. Their operations influence a wide swath of commercial and retail banking markets, shaping financial services across multiple states.
M&T Bank Corporation: Regional Banking Powerhouse
M&T Bank Corporation stands as a diversified regional bank with a stronghold in commercial and retail banking. It generates revenue chiefly from lending, deposit services, and wealth management. In 2021, its strategic focus emphasized expanding commercial real estate loans and enhancing digital banking channels across 688 offices in eight states plus Canada, reinforcing its competitive footprint.
Regions Financial Corporation: Southern and Midwestern Banking Leader
Regions Financial Corporation operates as a comprehensive financial holding company serving corporate and individual clients mainly through commercial banking, consumer loans, and wealth management. In early 2022, it concentrated on broadening its corporate banking services and wealth management offerings across 1,300 branches in the South, Midwest, and Texas to capture growing market demand.
Strategic Collision: Similarities & Divergences
Both banks pursue multi-segment banking models targeting commercial and retail clients but differ in regional focus and scale. M&T leans on a concentrated Northeast presence with emphasis on commercial real estate, while Regions commands a broader Southern and Midwestern network emphasizing corporate banking growth. Their primary battle unfolds in middle-market lending, where risk appetite and client relationships diverge sharply. These distinctions shape contrasting investment profiles: one grounded in regional specialization, the other in expansive market coverage.
Income Statement Comparison
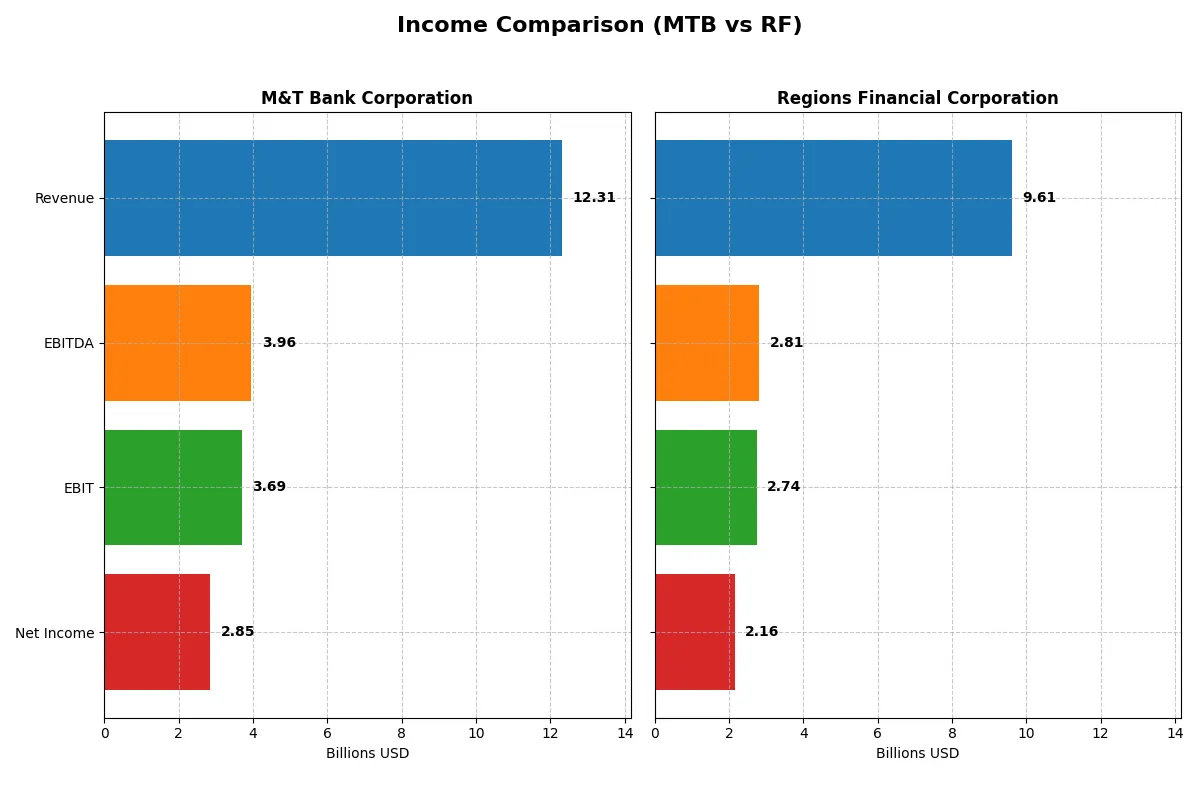
This data dissects the core profitability and scalability of both corporate engines to reveal who dominates the bottom line:
| Metric | M&T Bank Corporation (MTB) | Regions Financial Corporation (RF) |
|---|---|---|
| Revenue | 12.3B | 9.6B |
| Cost of Revenue | 3.1B | 2.4B |
| Operating Expenses | 5.5B | 4.4B |
| Gross Profit | 9.2B | 7.2B |
| EBITDA | 3.96B | 2.81B |
| EBIT | 3.69B | 2.74B |
| Interest Expense | 3.54B | 2.08B |
| Net Income | 2.85B | 2.16B |
| EPS | 17.1 | 2.31 |
| Fiscal Year | 2025 | 2025 |
Income Statement Analysis: The Bottom-Line Duel
This income statement comparison reveals how each company converts revenue into profit, exposing their operational efficiency and growth momentum.
M&T Bank Corporation Analysis
M&T Bank’s revenue grew 103% from 2021 to 2025, peaking at $12.3B in 2025 but dipping 8.2% from 2024. Net income rose steadily, reaching $2.85B in 2025. The company sustains strong margins: a 74.6% gross margin and 23.2% net margin, highlighting robust cost control despite rising interest expenses.
Regions Financial Corporation Analysis
Regions Financial’s revenue climbed 45.5% over five years, hitting $9.6B in 2025 with a modest 2.5% gain year-over-year. Net income declined overall, landing at $2.16B in 2025. Its margins are healthy, with a 74.6% gross margin and 22.4% net margin, but pressure on net income growth and higher interest costs signal margin compression risks.
Revenue Growth vs. Margin Resilience
M&T Bank outpaces Regions in revenue and net income growth, delivering superior margin expansion and profitability gains. Regions shows steadier top-line growth but struggles with declining net income and margin contraction. Investors seeking growth with strong profitability may favor M&T’s dynamic profile over Regions’ more subdued trajectory.
Financial Ratios Comparison
These vital ratios act as a diagnostic tool to expose the underlying fiscal health, valuation premiums, and capital efficiency of the companies examined:
| Ratios | M&T Bank Corporation (MTB) | Regions Financial Corporation (RF) |
|---|---|---|
| ROE | 9.77% | 11.32% |
| ROIC | 6.75% | 13.79% |
| P/E | 11.54 | 10.99 |
| P/B | 1.13 | 1.25 |
| Current Ratio | 0.32 | 0.30 |
| Quick Ratio | 0.32 | 0.30 |
| D/E | 0.45 | 0.26 |
| Debt-to-Assets | 6.12% | 3.06% |
| Interest Coverage | 1.04 | 1.32 |
| Asset Turnover | 0.058 | 0.060 |
| Fixed Asset Turnover | 0 | 5.79 |
| Payout ratio | 33% | 42% |
| Dividend yield | 2.83% | 3.80% |
| Fiscal Year | 2025 | 2025 |
Efficiency & Valuation Duel: The Vital Signs
Financial ratios act as a company’s DNA, uncovering hidden risks and signaling operational excellence through key profitability and valuation metrics.
M&T Bank Corporation
M&T Bank posts a solid net margin of 23.16% but a modest ROE of 9.77%, trailing sector benchmarks. Its P/E of 11.54 and P/B of 1.13 suggest the stock remains reasonably priced. A 2.83% dividend yield rewards shareholders, offsetting concerns from a low current ratio and weaker asset turnover.
Regions Financial Corporation
Regions Financial delivers a stronger ROE of 11.32% and an impressive ROIC of 13.79%, showcasing operational efficiency. Its P/E of 11.0 and P/B of 1.25 imply fair valuation. Regions offers a higher dividend yield at 3.8%, supported by favorable leverage and asset turnover metrics, enhancing shareholder value.
Balanced Value vs. Operational Strength
Regions Financial presents a more favorable ratio profile, balancing profitability and valuation with higher returns and dividends. M&T Bank remains attractive on yield but carries risks in liquidity and efficiency. Risk-tolerant investors may prefer Regions’ operational strength, while income-focused investors might lean toward M&T’s steady dividend.
Which one offers the Superior Shareholder Reward?
I compare M&T Bank Corporation (MTB) and Regions Financial Corporation (RF) on shareholder returns in 2026. MTB pays a 2.8% dividend yield with a 33% payout ratio, showing solid free cash flow coverage and steady dividend growth around $5.70/share. Its buyback program is modest but consistent, supporting shareholder value sustainably given its strong capital metrics. RF yields 3.8% with a higher 42% payout ratio, but its free cash flow coverage is less transparent, signaling potential risk to dividend sustainability. RF runs a more aggressive buyback strategy, boosting total returns but with elevated financial leverage. I conclude MTB’s balanced dividend and prudent buybacks offer a more sustainable, superior total return profile for long-term investors in 2026.
Comparative Score Analysis: The Strategic Profile
The radar chart reveals the fundamental DNA and trade-offs of M&T Bank Corporation and Regions Financial Corporation:
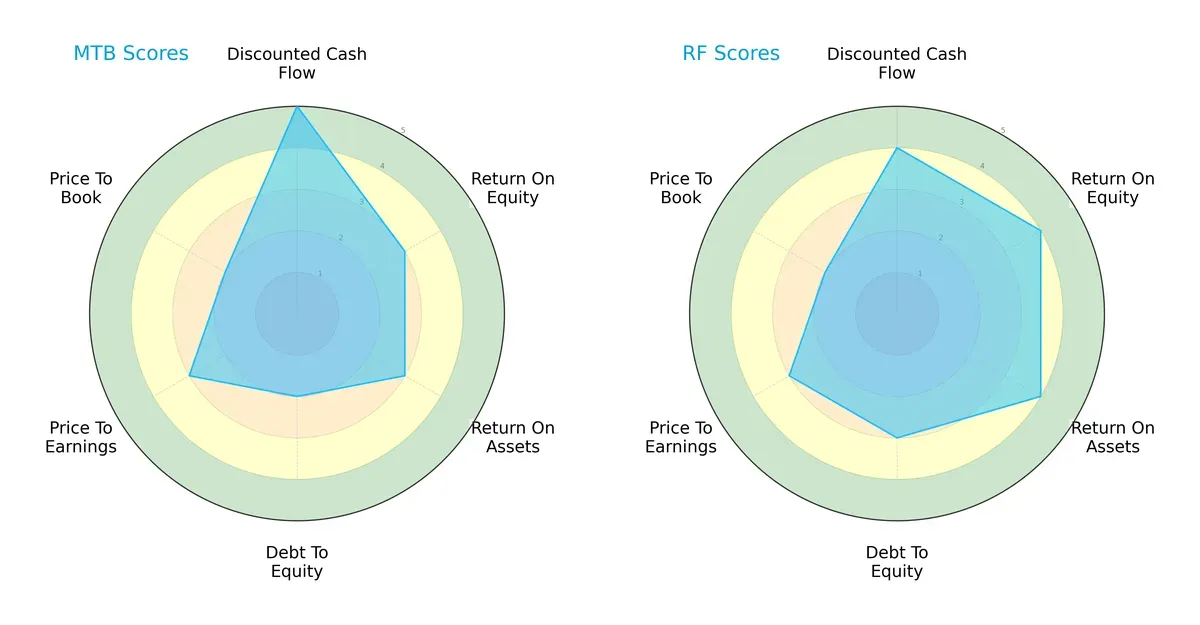
Regions Financial Corporation shows a more balanced financial profile with favorable scores in DCF, ROE, and ROA, indicating efficient asset use and profit generation. M&T Bank leans heavily on a strong DCF score but lags in debt management and valuation metrics. Regions’ moderate debt-to-equity score suggests better risk control.
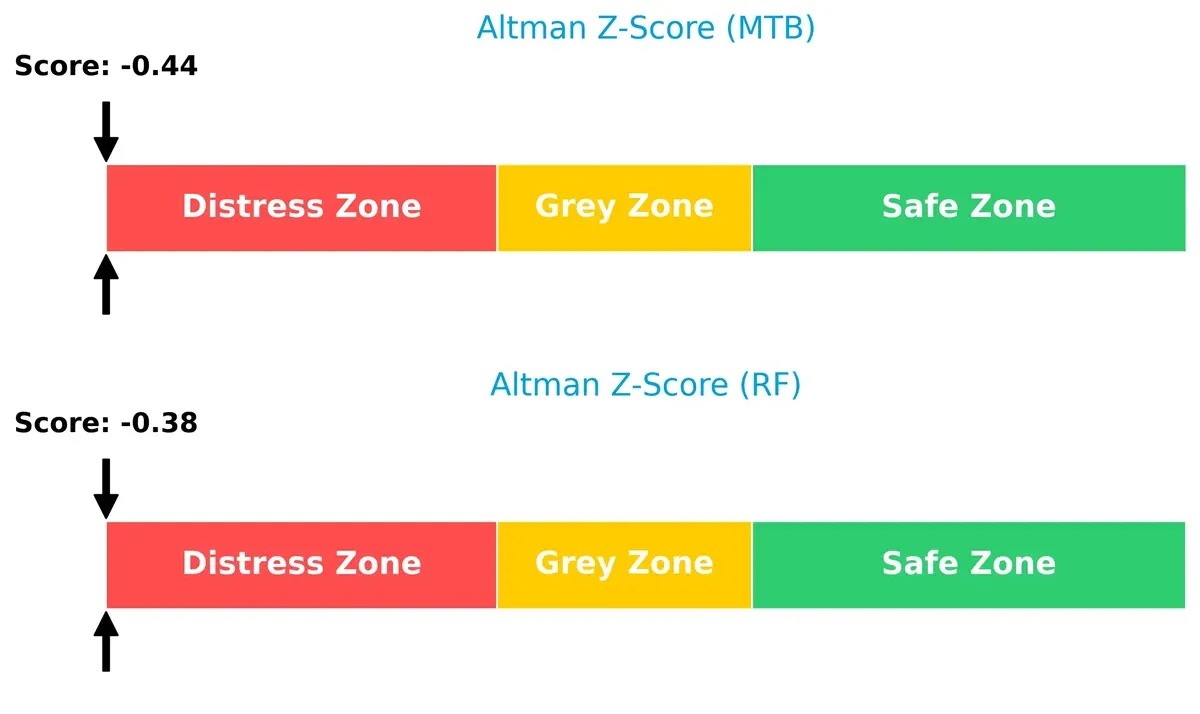
Bankruptcy Risk: Solvency Showdown
Both M&T Bank and Regions Financial fall in the distress zone per their Altman Z-Scores, indicating elevated bankruptcy risk under current economic pressures:
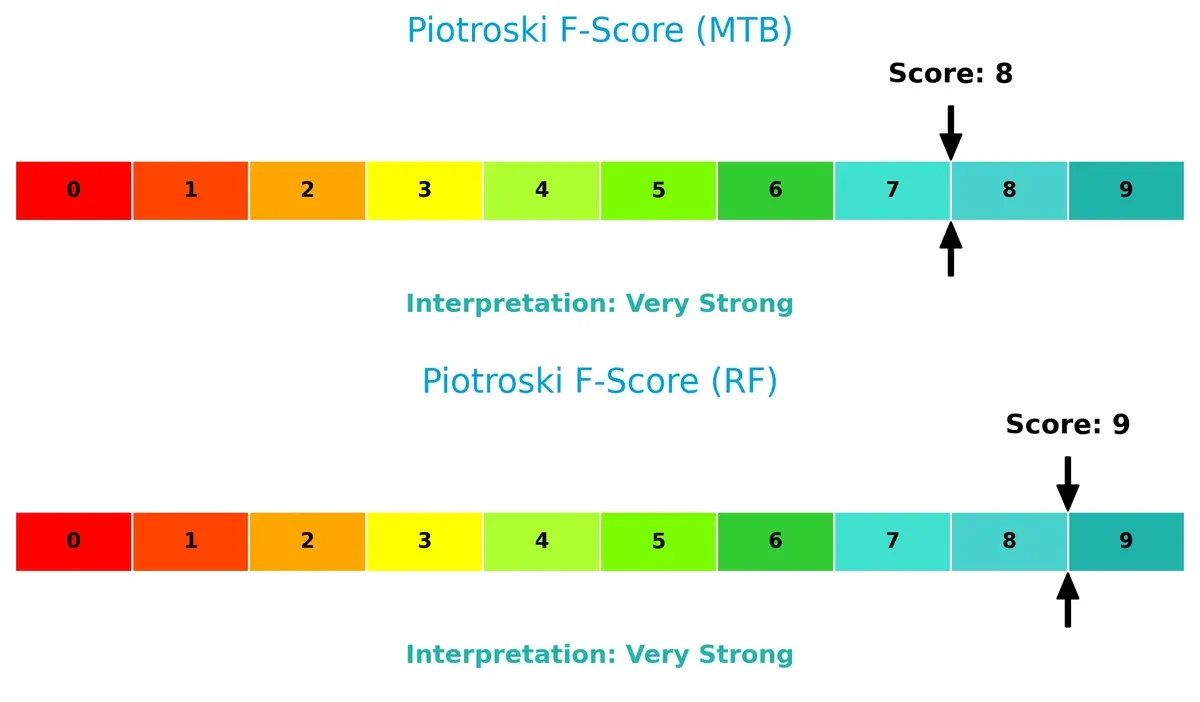
Financial Health: Quality of Operations
Regions Financial scores a perfect 9 on the Piotroski F-Score, slightly edging M&T Bank’s strong 8, highlighting superior operational health and fewer red flags in internal metrics:
How are the two companies positioned?
This section dissects MTB and RF’s operational DNA by comparing their revenue distribution and internal strengths and weaknesses. The goal is to confront their economic moats and reveal which model offers the most resilient competitive advantage today.
Revenue Segmentation: The Strategic Mix
This visual comparison dissects how M&T Bank Corporation and Regions Financial Corporation diversify their income streams and where their primary sector bets lie:
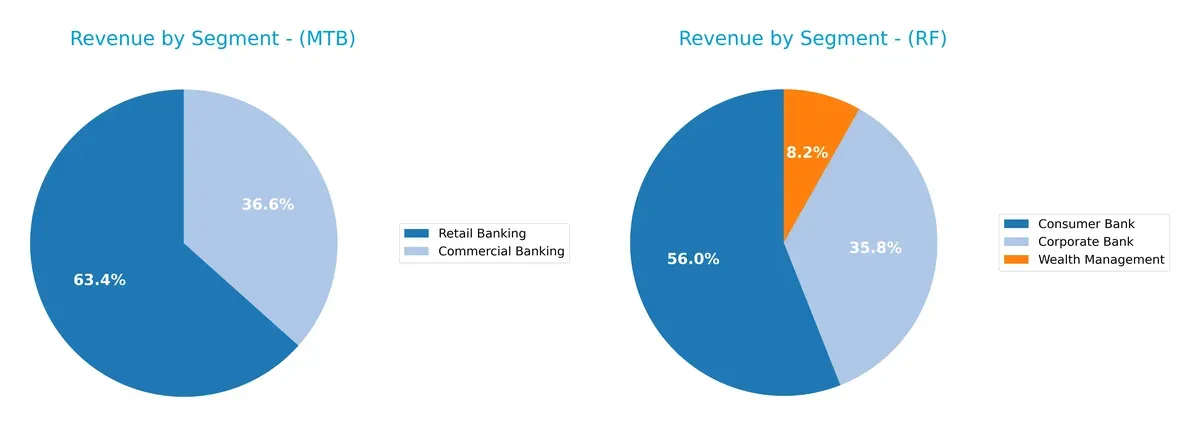
Regions Financial dwarfs M&T with a heavy concentration in Consumer Bank at $3.13B and Corporate Bank at $2B in 2023. M&T shows a more balanced split between Retail Banking ($471M) and Commercial Banking ($272M) for the same year. Regions leans into large-scale consumer and corporate banking dominance, risking concentration but leveraging scale. M&T’s diversified approach spreads risk across retail, commercial, and fiduciary services, signaling resilience but less market power.
Strengths and Weaknesses Comparison
This table compares the strengths and weaknesses of M&T Bank Corporation and Regions Financial Corporation:
MTB Strengths
- Favorable net margin of 23.16%
- Strong dividend yield at 2.83%
- Low debt-to-assets ratio at 6.12%
- Favorable price-to-earnings ratio of 11.54
- Favorable price-to-book ratio at 1.13
- Diversified revenue streams across commercial and retail banking
RF Strengths
- Favorable net margin of 22.44%
- Higher return on invested capital at 13.79%
- Favorable fixed asset turnover at 5.79
- Dividend yield at 3.8%
- Lower debt-to-assets ratio at 3.06%
- Larger revenue base with strong consumer and corporate banking segments
MTB Weaknesses
- Unfavorable return on equity at 9.77% below cost of capital
- Unfavorable weighted average cost of capital at 10.37%
- Very low liquidity ratios (current and quick ratio at 0.32)
- Weak interest coverage at 1.04
- Unfavorable asset and fixed asset turnover
- Global ratios evaluation slightly unfavorable
RF Weaknesses
- Unfavorable weighted average cost of capital at 12.66%
- Low liquidity ratios (current and quick ratio at 0.3)
- Interest coverage below comfortable levels at 1.32
- Unfavorable asset turnover
- Global ratios evaluation favorable but with notable financial constraints
Overall, MTB shows solid profitability margins and prudent leverage but suffers from weak liquidity and returns below WACC, signaling efficiency challenges. RF demonstrates stronger capital returns and asset management but faces similar liquidity and coverage concerns. Both must address these weaknesses to enhance financial resilience and strategic growth.
The Moat Duel: Analyzing Competitive Defensibility
A structural moat is the only thing protecting long-term profits from competition’s relentless erosion. Let’s dissect how these two regional banks defend their turf:
M&T Bank Corporation: Legacy Relationship Moat
M&T’s primary moat stems from deep customer relationships and regional focus, yielding stable margins despite revenue dips. Yet, declining ROIC warns of weakening capital efficiency into 2026.
Regions Financial Corporation: Growth-Driven Efficiency Moat
Regions relies on improving operational efficiency and expanding market share, reflected in rising ROIC and margin growth. Its growing profitability signals a strengthening competitive position versus M&T’s fading advantage.
Legacy Stability vs. Emerging Operational Edge
Regions holds a deeper, expanding moat, thanks to its improving ROIC trend and margin gains. M&T’s shrinking profitability leaves it vulnerable, making Regions better equipped to defend and grow market share.
Which stock offers better returns?
Both M&T Bank Corporation and Regions Financial Corporation demonstrate strong bullish trends over the past year, marked by significant price appreciation and accelerating momentum.
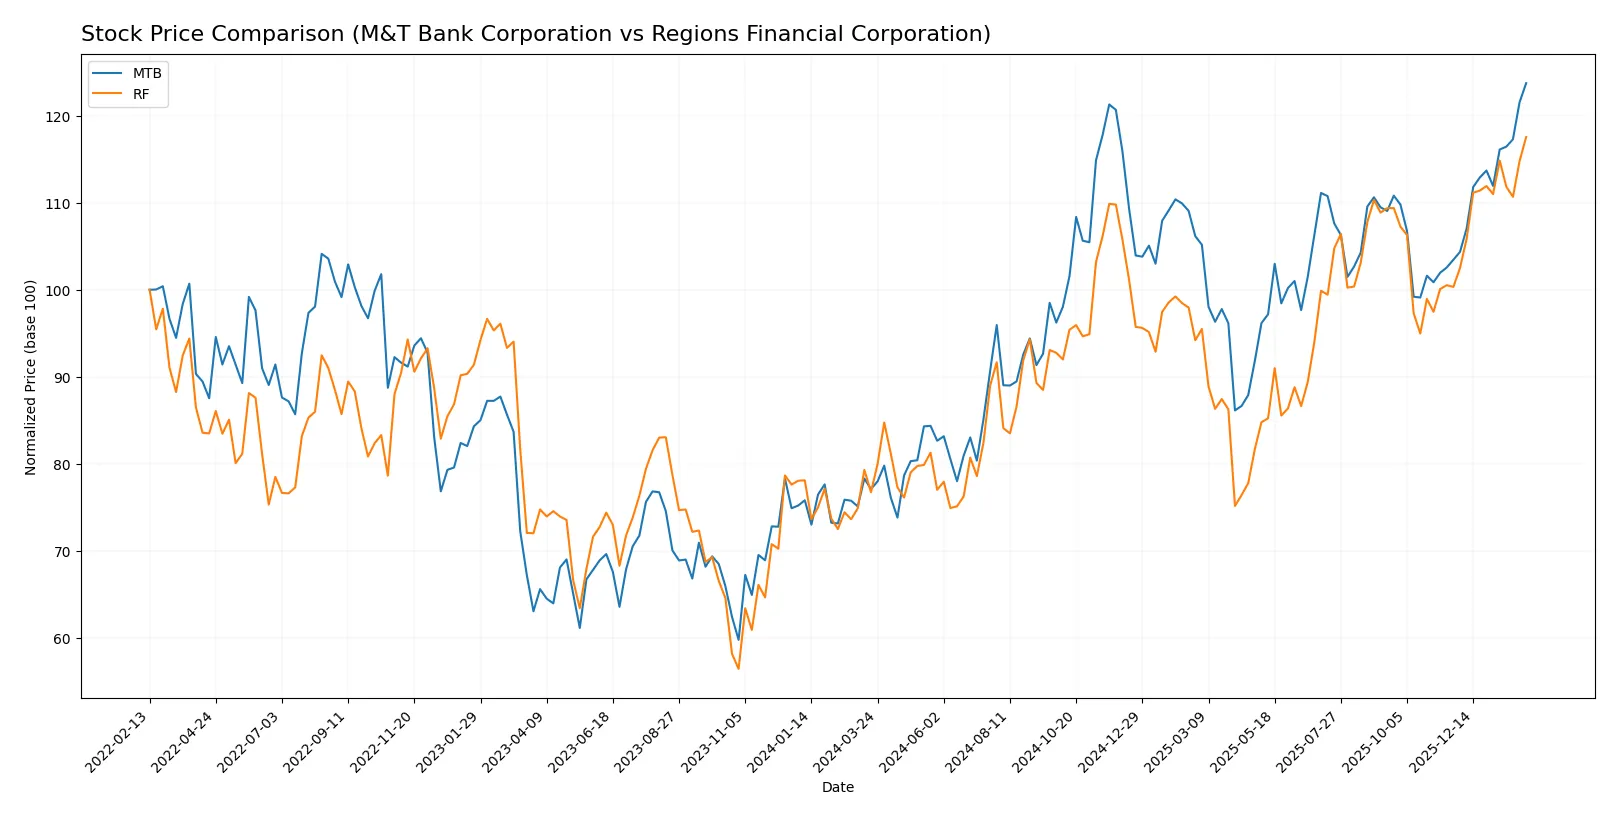
Trend Comparison
M&T Bank’s stock rose 60.52% over the past 12 months, showing a bullish trend with accelerating gains and notable volatility at a 21.98 standard deviation.
Regions Financial’s stock climbed 53.23% over the same period, also bullish with accelerating momentum but much lower volatility, measured by a 2.82 standard deviation.
M&T Bank outperformed Regions Financial by approximately 7.3 percentage points, delivering the higher market return amid greater price fluctuations.
Target Prices
Analysts present a clear target price consensus for M&T Bank Corporation and Regions Financial Corporation.
| Company | Target Low | Target High | Consensus |
|---|---|---|---|
| M&T Bank Corporation | 208 | 255 | 230.8 |
| Regions Financial Corporation | 27 | 32 | 29.89 |
The target consensus for M&T Bank is slightly above its current price of 226.72, signaling modest upside potential. Regions Financial’s consensus of 29.89 aligns closely with its current price of 29.29, indicating a balanced outlook.

Don’t Let Luck Decide Your Entry Point
Optimize your entry points with our advanced ProRealTime indicators. You’ll get efficient buy signals with precise price targets for maximum performance. Start outperforming now!
How do institutions grade them?
This section compares recent institutional grades for M&T Bank Corporation and Regions Financial Corporation:
M&T Bank Corporation Grades
The following table summarizes recent grades from notable financial institutions for M&T Bank Corporation.
| Grading Company | Action | New Grade | Date |
|---|---|---|---|
| RBC Capital | maintain | Outperform | 2026-01-20 |
| Jefferies | maintain | Buy | 2026-01-16 |
| Wolfe Research | downgrade | Peer Perform | 2026-01-07 |
| TD Cowen | maintain | Buy | 2026-01-07 |
| B of A Securities | downgrade | Neutral | 2026-01-07 |
| Evercore ISI Group | downgrade | In Line | 2026-01-06 |
| Barclays | maintain | Equal Weight | 2026-01-05 |
| Keefe, Bruyette & Woods | maintain | Market Perform | 2025-12-17 |
| Truist Securities | downgrade | Hold | 2025-12-12 |
| TD Cowen | maintain | Buy | 2025-10-20 |
Regions Financial Corporation Grades
The following table presents recent grades from key financial firms for Regions Financial Corporation.
| Grading Company | Action | New Grade | Date |
|---|---|---|---|
| Piper Sandler | maintain | Neutral | 2026-01-20 |
| Wells Fargo | maintain | Underweight | 2026-01-20 |
| Keefe, Bruyette & Woods | downgrade | Market Perform | 2026-01-20 |
| Wells Fargo | downgrade | Underweight | 2026-01-16 |
| Evercore ISI Group | downgrade | Underperform | 2026-01-06 |
| Barclays | maintain | Underweight | 2026-01-05 |
| Truist Securities | maintain | Hold | 2025-12-22 |
| Keefe, Bruyette & Woods | maintain | Outperform | 2025-12-17 |
| Truist Securities | maintain | Hold | 2025-10-20 |
| Stephens & Co. | downgrade | Equal Weight | 2025-10-14 |
Which company has the best grades?
M&T Bank holds generally stronger grades, with multiple Buy and Outperform ratings, despite some recent downgrades. Regions Financial faces more downgrades and underweight ratings, indicating higher perceived risk among analysts. Investors may note these differences in institutional sentiment.
Risks specific to each company
The following categories identify critical pressure points and systemic threats facing M&T Bank Corporation and Regions Financial Corporation in the 2026 market environment:
1. Market & Competition
M&T Bank Corporation
- Operates mainly in Northeast US with moderate regional competition and steady customer base.
Regions Financial Corporation
- Strong presence in South and Midwest with intense regional competition and larger branch network.
2. Capital Structure & Debt
M&T Bank Corporation
- Debt-to-equity ratio of 0.45 is moderate, but low interest coverage (1.04) signals potential strain servicing debt.
Regions Financial Corporation
- Lower debt-to-equity ratio of 0.26 with better interest coverage (1.32) indicates more prudent leverage management.
3. Stock Volatility
M&T Bank Corporation
- Beta of 0.58 reflects lower volatility, appealing to risk-averse investors.
Regions Financial Corporation
- Beta of 1.03 shows higher stock volatility, indicating greater market sensitivity and risk.
4. Regulatory & Legal
M&T Bank Corporation
- Subject to typical regional banking regulations with no recent major legal issues reported.
Regions Financial Corporation
- Faces similar regulatory environment; larger footprint may increase exposure to compliance risks.
5. Supply Chain & Operations
M&T Bank Corporation
- Operates 688 offices mainly in Northeast; concentrated geography may limit operational disruption.
Regions Financial Corporation
- 1,300 offices across diverse regions increase operational complexity and exposure to disruptions.
6. ESG & Climate Transition
M&T Bank Corporation
- Limited data on ESG initiatives; regional banks often lag behind larger peers in climate transition efforts.
Regions Financial Corporation
- Slightly better ESG profile due to larger scale and recent announcements on sustainability programs.
7. Geopolitical Exposure
M&T Bank Corporation
- Primarily domestic US operations with minimal geopolitical risk.
Regions Financial Corporation
- Similar domestic focus but broader regional footprint may marginally increase exposure to regional economic shifts.
Which company shows a better risk-adjusted profile?
Regions Financial Corporation faces less financial leverage risk and boasts a stronger capital structure. M&T Bank’s lower stock volatility suits conservative investors but its weak interest coverage and low liquidity ratios raise caution flags. Regions’ higher operational complexity and volatility increase risk but are offset by superior profitability metrics and a more favorable rating profile. Overall, Regions Financial demonstrates a better risk-adjusted profile supported by a higher Piotroski score (9 vs. 8) and more favorable financial ratios, especially ROIC and debt metrics. The most impactful risks are M&T’s debt servicing strain and Regions’ elevated stock volatility, demanding investors weigh stability against growth potential carefully.
Final Verdict: Which stock to choose?
M&T Bank Corporation’s superpower lies in its robust income generation and solid dividend yield, making it a reliable cash machine. However, its declining ROIC and weak liquidity ratios remain points of vigilance. MTB suits investors seeking aggressive growth tempered by awareness of operational risks.
Regions Financial Corporation offers a strategic moat through improving profitability and efficient capital use, supported by a favorable debt profile and stable free cash flow. Compared to MTB, RF appears safer with a stronger financial foundation. It fits well within a GARP portfolio focused on balanced growth and value.
If you prioritize growth backed by strong income and dividend returns, MTB is the compelling choice despite its value-destroying trend. However, if you seek better stability and improving profitability, RF outshines as the more prudent option with a moderately favorable moat and financial health.
Disclaimer: Investment carries a risk of loss of initial capital. The past performance is not a reliable indicator of future results. Be sure to understand risks before making an investment decision.
Go Further
I encourage you to read the complete analyses of M&T Bank Corporation and Regions Financial Corporation to enhance your investment decisions: