Home > Comparison > Basic Materials > PPG vs LYB
The strategic rivalry between PPG Industries and LyondellBasell shapes the specialty chemicals segment’s competitive landscape. PPG operates as a diversified coatings and specialty materials leader with a broad industrial footprint. LyondellBasell focuses on olefins, polyolefins, and refining, emphasizing integrated chemical production. This analysis contrasts their operational models to identify which offers superior risk-adjusted returns amid sector cyclicality and innovation demands for a balanced portfolio.
Table of contents
Companies Overview
PPG Industries and LyondellBasell stand as key players in the specialty chemicals market, shaping global industrial supply chains.
PPG Industries, Inc.: Specialty Coatings Powerhouse
PPG Industries dominates the specialty coatings sector with a diverse portfolio spanning automotive, aerospace, and industrial markets. Its core revenue derives from paints, coatings, and specialty materials tailored for protection and aesthetics. In 2026, PPG focuses on expanding high-performance coatings and digital solutions to enhance customer service and operational efficiency.
LyondellBasell Industries N.V.: Polyolefin and Refining Leader
LyondellBasell commands a leading position in polyolefins and chemical manufacturing, producing polyethylene, polypropylene, and refining crude oil into fuels and distillates. Its revenue base relies heavily on global polymer sales and advanced chemical solutions. The company’s 2026 strategy centers on innovation in advanced polymers and sustainability initiatives to drive growth across international markets.
Strategic Collision: Similarities & Divergences
Both firms operate within specialty chemicals but diverge sharply in business models—PPG pursues a coatings-centric product ecosystem, while LyondellBasell emphasizes commodity polymers and refining. Their competition converges on industrial applications requiring durable materials and chemical solutions. Investors face two distinct profiles: PPG offers innovation-driven specialty coatings, whereas LyondellBasell delivers scale and integration in commodity chemicals.
Income Statement Comparison
This data dissects the core profitability and scalability of both corporate engines to reveal who dominates the bottom line:
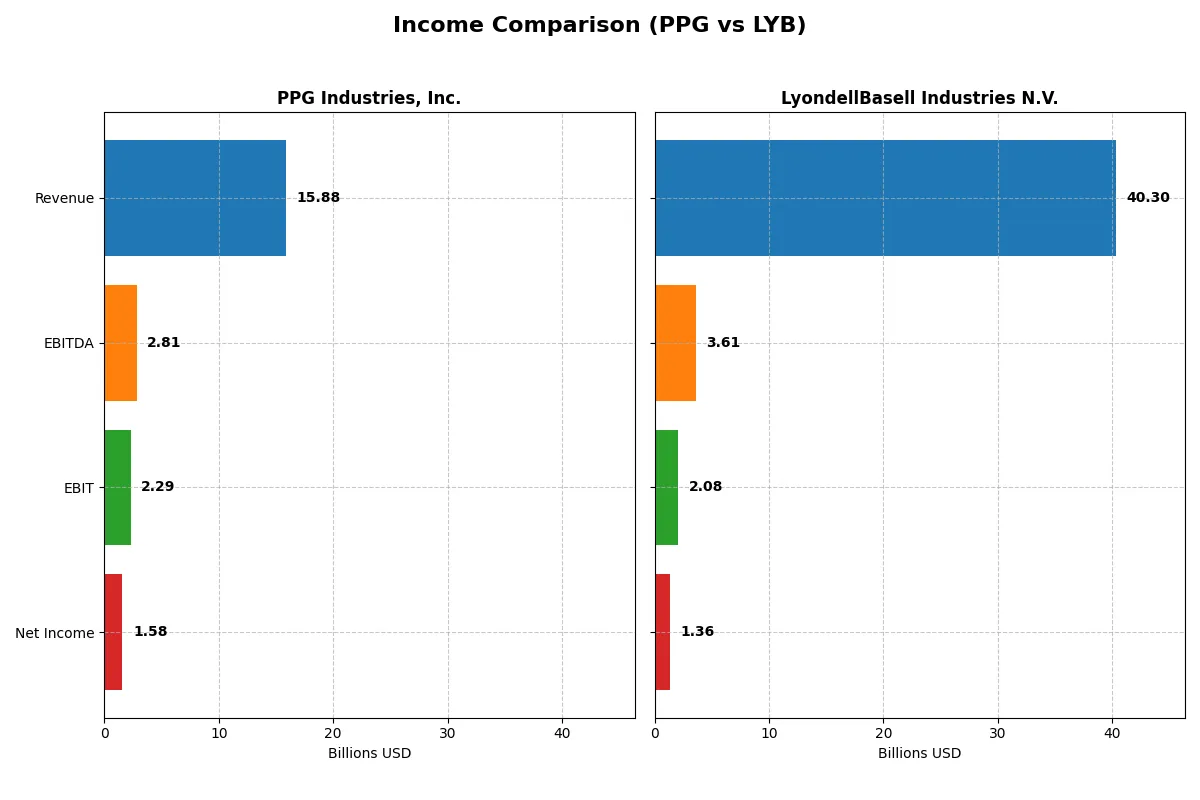
| Metric | PPG Industries, Inc. (PPG) | LyondellBasell Industries N.V. (LYB) |
|---|---|---|
| Revenue | 15.9B | 40.3B |
| Cost of Revenue | 9.84B | 35.7B |
| Operating Expenses | 3.86B | 2.75B |
| Gross Profit | 6.03B | 4.56B |
| EBITDA | 2.81B | 3.61B |
| EBIT | 2.29B | 2.08B |
| Interest Expense | 241M | 481M |
| Net Income | 1.58B | 1.36B |
| EPS | 6.96 | 4.16 |
| Fiscal Year | 2025 | 2024 |
Income Statement Analysis: The Bottom-Line Duel
This income statement comparison reveals which company operates its business more efficiently and delivers stronger profitability.
PPG Industries, Inc. Analysis
PPG’s revenue remains stable around $15.9B, with net income growing to $1.58B in 2025. Its gross margin hovers near 38%, reflecting solid cost control. The company improves net margin to nearly 10%, showing efficiency gains. Recent EBIT and EPS growth above 40% indicate strong momentum and operational leverage.
LyondellBasell Industries N.V. Analysis
LyondellBasell reports higher revenue at $40.3B but suffers margin compression, with gross margin near 11% and net margin declining to 3.4% in 2024. Net income falls to $1.36B, reflecting weaker profitability despite scale. EBIT and EPS shrink over the last year, signaling margin pressure and deteriorating operating efficiency.
Margin Strength vs. Scale Advantage
PPG outperforms LyondellBasell on profitability despite smaller revenue. PPG’s superior margins and double-digit net income growth contrast with LYB’s margin erosion and income declines. For investors prioritizing efficiency and earnings quality, PPG’s profile offers a clearer fundamental advantage over LyondellBasell’s volume-driven but weaker margin model.
Financial Ratios Comparison
These vital ratios act as a diagnostic tool to expose the underlying fiscal health, valuation premiums, and capital efficiency of the companies analyzed:
| Ratios | PPG Industries, Inc. (PPG) | LyondellBasell Industries N.V. (LYB) |
|---|---|---|
| ROE | -44.5% | 10.9% (2024) |
| ROIC | 43.1% | 5.1% (2024) |
| P/E | 14.7 | 17.7 (2024) |
| P/B | -6.54 | 1.94 (2024) |
| Current Ratio | 1.62 | 1.83 (2024) |
| Quick Ratio | 1.22 | 1.13 (2024) |
| D/E | -2.10 | 1.04 (2024) |
| Debt-to-Assets | 93.6% | 36.2% (2024) |
| Interest Coverage | 9.0 | 3.78 (2024) |
| Asset Turnover | 1.99 | 1.13 (2024) |
| Fixed Asset Turnover | 0 | 2.44 (2024) |
| Payout Ratio | 39.8% | 126.5% (2024) |
| Dividend Yield | 2.71% | 7.13% (2024) |
| Fiscal Year | 2025 | 2024 |
Efficiency & Valuation Duel: The Vital Signs
Financial ratios serve as a company’s DNA, exposing hidden risks and operational strengths critical for investment decisions.
PPG Industries, Inc.
PPG reveals a mixed profitability picture with an unfavorable ROE at -44.48% but a strong ROIC of 43.13%, indicating efficient capital use. Its P/E ratio at 14.71 suggests a fairly valued stock, while a 2.71% dividend yield rewards shareholders steadily. The company balances reinvestment with shareholder returns, reflecting operational discipline amid debt concerns.
LyondellBasell Industries N.V.
LyondellBasell shows no profitability or valuation data for 2025, with zero net margin and ROE, signaling operational challenges or data unavailability. The absence of dividends contrasts with a neutral interest coverage ratio of 4.33, raising caution on financial health. Limited favorable ratios and a lack of liquidity metrics highlight elevated investment risks.
Balanced Operational Efficiency vs. Data Uncertainty
PPG offers a clearer balance of operational efficiency and shareholder value, backed by favorable capital returns despite debt pressures. LyondellBasell’s spotty data and weak metrics introduce significant uncertainty, suiting only risk-tolerant investors willing to navigate unclear fundamentals.
Which one offers the Superior Shareholder Reward?
I compare PPG Industries and LyondellBasell’s shareholder reward strategies. PPG yields 2.7% with a 40% payout, supported by modest buybacks but negative free cash flow in 2025. LYB yields a higher 7.1% dividend with a payout above 100%, signaling risk, but boasts robust free cash flow near 6B and aggressive buybacks. LYB’s model prioritizes income now, but PPG’s balanced payout and reinvestment offer more sustainable growth. I see PPG as the superior total return choice in 2026, balancing income and long-term value better than LYB’s high-yield, high-risk approach.
Comparative Score Analysis: The Strategic Profile
The radar chart reveals the fundamental DNA and trade-offs of both firms, highlighting their core strengths and vulnerabilities:
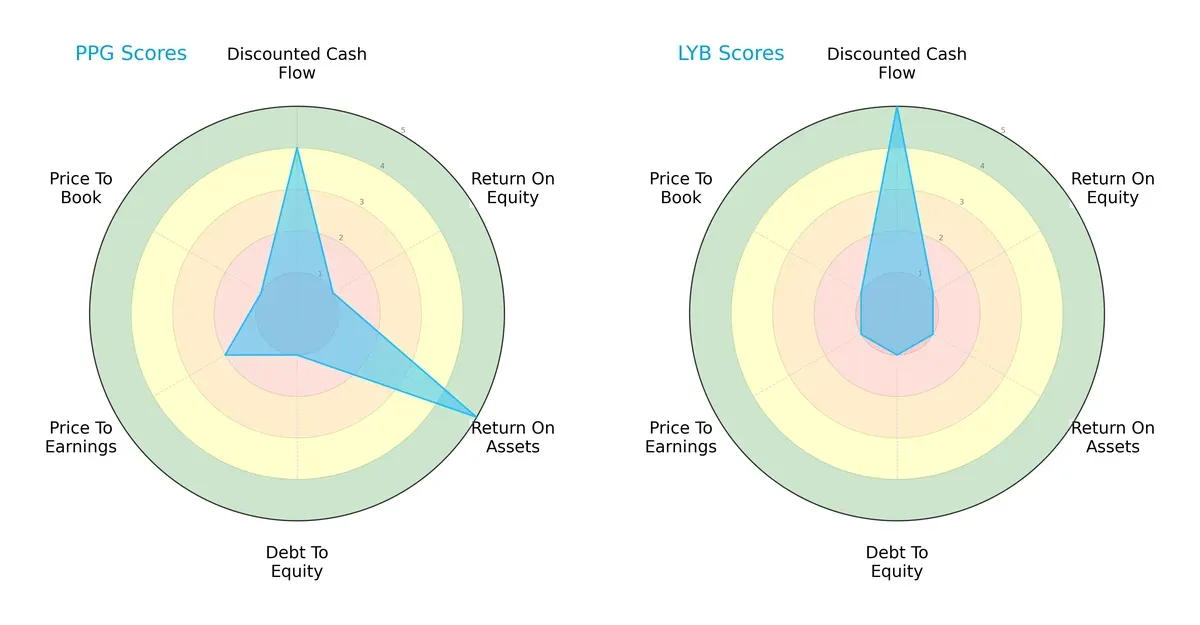
PPG Industries displays a balanced profile with a strong return on assets (score 5) and favorable discounted cash flow (score 4). However, it struggles with high financial leverage and weak return on equity (both score 1), signaling risk in capital efficiency. LyondellBasell relies heavily on its discounted cash flow strength (score 5) but suffers from poor asset utilization, profitability, and valuation metrics (all scores 1). Overall, PPG offers a more diversified financial foundation, while LYB leans on a single valuation advantage.
Bankruptcy Risk: Solvency Showdown
PPG’s Altman Z-Score of 4.7 places it firmly in the safe zone, indicating strong long-term solvency and resilience in this cycle. LYB’s score is unavailable, limiting direct comparison:

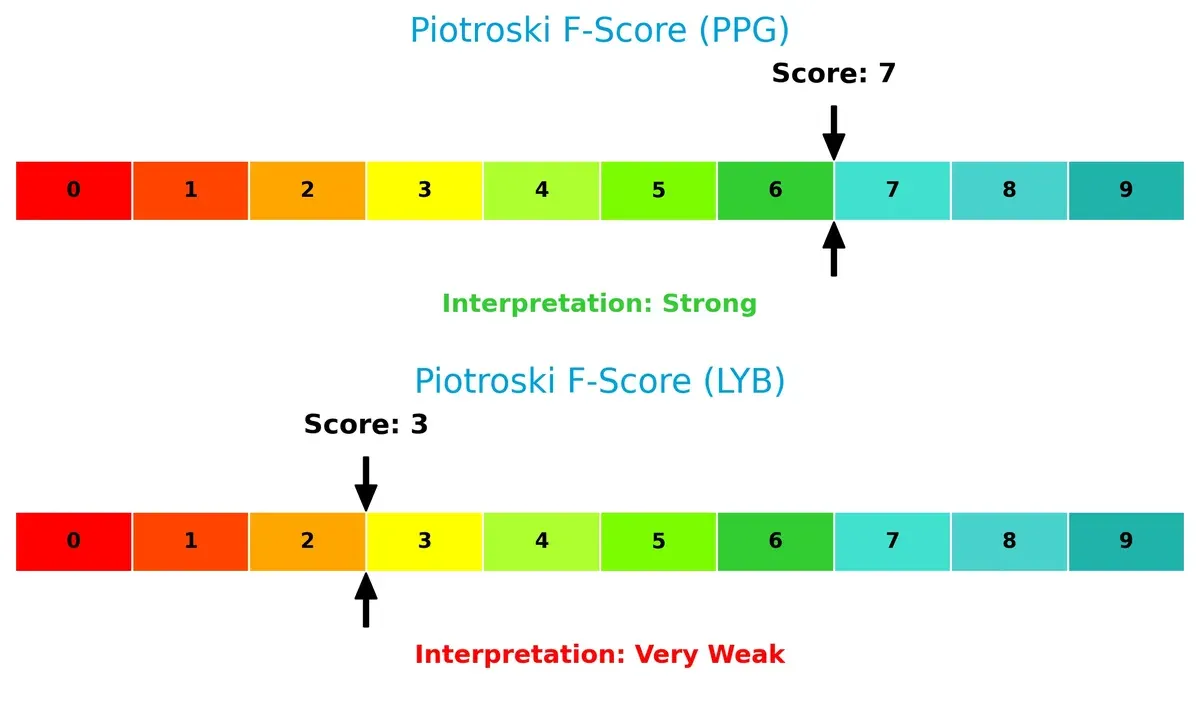
Financial Health: Quality of Operations
PPG’s Piotroski F-Score of 7 signals robust financial health and operational quality. LYB’s score of 3 flags potential internal weaknesses, highlighting concerns in profitability and efficiency metrics:
How are the two companies positioned?
This section dissects the operational DNA of PPG and LYB by comparing their revenue distribution and internal dynamics, including strengths and weaknesses. The final objective is to confront their economic moats to identify which model offers the most resilient and sustainable competitive advantage in today’s market.
Revenue Segmentation: The Strategic Mix
This visual comparison dissects how PPG Industries and LyondellBasell diversify their income streams and where their primary sector bets lie:
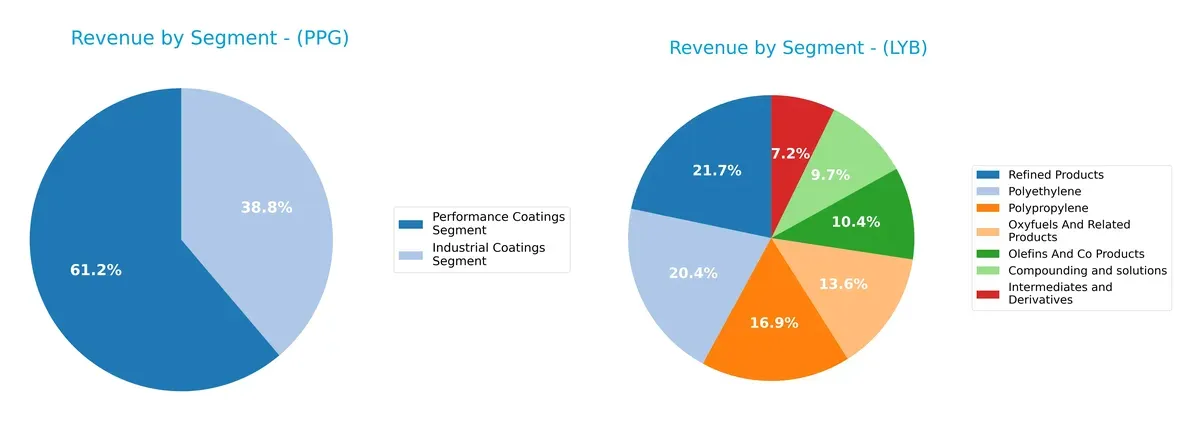
PPG anchors its revenue in two segments: $11.2B from Performance Coatings and $7.1B from Industrial Coatings, showing a focused but balanced mix. LyondellBasell dwarfs with a broader portfolio, spanning seven sizable segments from $2.7B to $9.2B, including Refined Products at $9.2B and Polyethylene at $7.6B. LyondellBasell’s diverse footprint mitigates concentration risk, while PPG’s reliance on coatings suggests strong sector specialization and ecosystem lock-in.
Strengths and Weaknesses Comparison
This table compares the Strengths and Weaknesses of PPG Industries, Inc. and LyondellBasell Industries N.V.:
PPG Strengths
- Balanced revenue from Industrial and Performance Coatings
- Favorable ROIC of 43.13% vs WACC 7.88% indicates strong capital efficiency
- Strong current and quick ratios above 1.2 show liquidity
- Dividend yield of 2.71% supports shareholder returns
- Global presence across Asia Pacific, EMEA, Latin America, and North America
- PPG Weaknesses
- :—
- Unfavorable ROE at -44.48% suggests poor equity profitability
- High debt to assets at 93.55% indicates financial leverage risk
- Fixed asset turnover at 0 signals potential asset utilization issues
- Negative P/B ratio raises valuation concerns
LYB Strengths
- Diverse product portfolio including Polyethylene, Polypropylene, and Refined Products
- Large revenue base with significant US market exposure
- Favorable debt to assets ratio and debt to equity status
- Positive P/E and P/B ratios suggest market valuation confidence
- LYB Weaknesses
- :—
- Net margin, ROE, and ROIC all at zero, indicating weak profitability
- Unavailable WACC complicates cost of capital assessment
- Current and quick ratios at zero expose liquidity concerns
- Negative dividend yield and poor asset turnover metrics suggest operational challenges
PPG demonstrates strong capital efficiency and liquidity but faces challenges in equity returns and leverage. LYB shows broad diversification and solid market presence but struggles with profitability and liquidity, which may constrain strategic flexibility.
The Moat Duel: Analyzing Competitive Defensibility
A structural moat alone shields long-term profits from relentless competitive erosion by new entrants and substitutes:
PPG Industries, Inc.: Durable Innovation & Intangible Asset Moat
I see PPG’s moat rooted in intangible assets and innovation, reflected in a very favorable ROIC 35% above WACC. Stable margins and growing profitability signal effective capital use. New specialty coatings and aerospace ventures could deepen this moat in 2026.
LyondellBasell Industries N.V.: Scale-Driven Cost Advantage
LyondellBasell’s moat depends on scale and integrated operations, unlike PPG’s innovation focus. However, declining ROIC and compressed margins reveal weakening competitive strength. Expansion into advanced polymers offers some upside, but margin pressure remains a key risk.
Innovation & Intangibles vs. Scale & Integration
PPG’s moat is wider and more durable, supported by superior ROIC trends and margin stability. LyondellBasell faces margin compression and falling returns, limiting its defensive power. PPG is better positioned to protect and grow market share through 2026.
Which stock offers better returns?
The past year reveals contrasting trading dynamics: both PPG Industries and LyondellBasell show significant overall declines but recent price gains indicate changing investor sentiment.
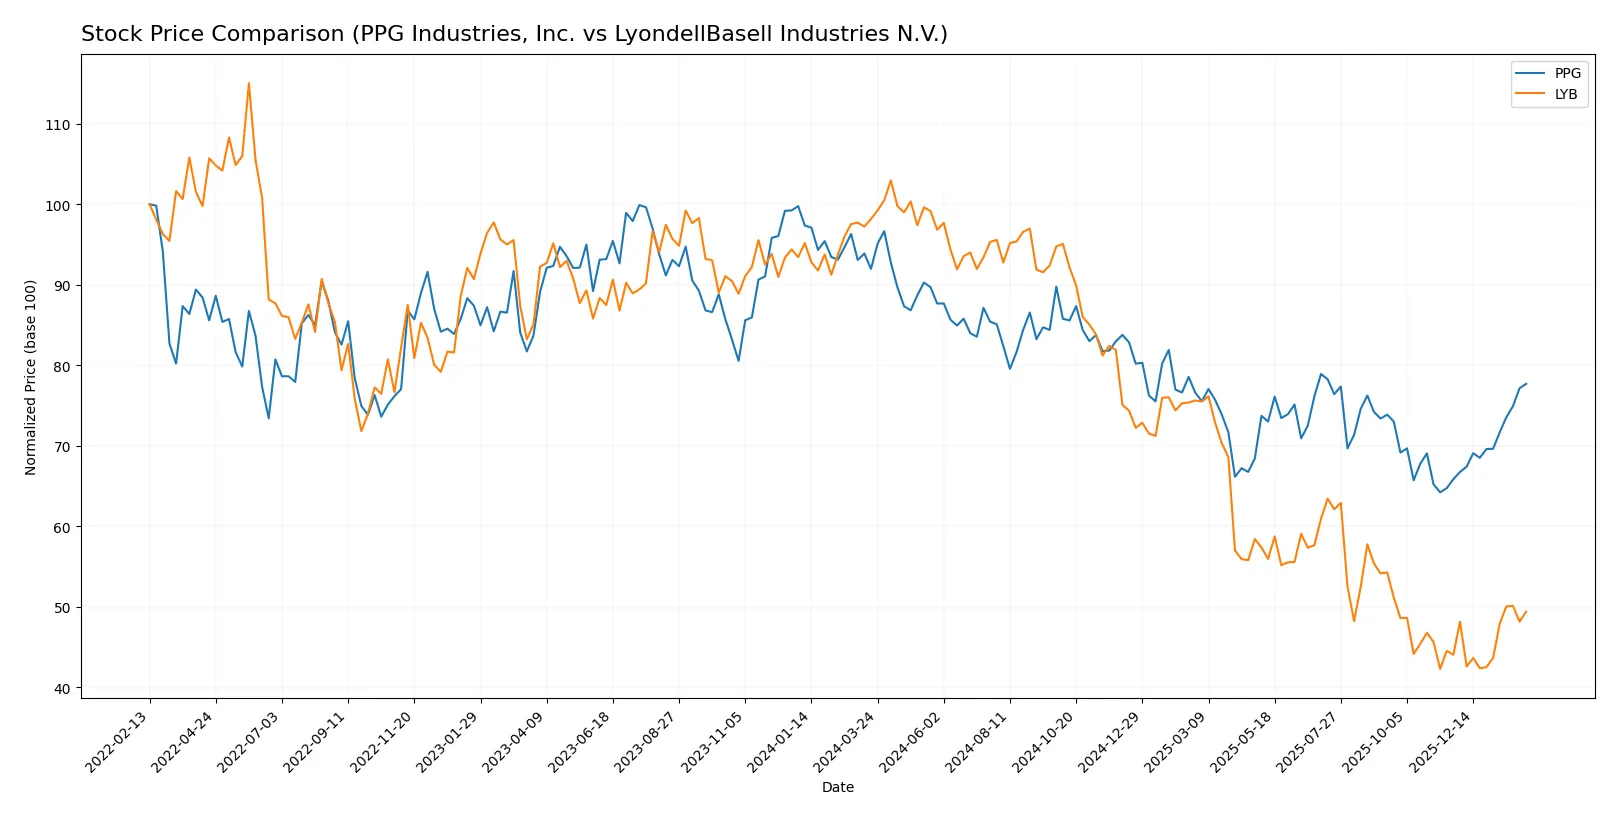
Trend Comparison
PPG Industries exhibits a 15.52% price decline over the past year, marking a bearish trend with accelerating downward momentum. Recent weeks show a 17.99% rebound, signaling a strong short-term recovery.
LyondellBasell suffers a steeper 49.7% drop over the year, also bearish with acceleration in losses. The recent 12.17% gain suggests moderate recovery but with less upward momentum than PPG.
Comparing the two, PPG delivers a less severe annual loss and a stronger recent rally, indicating better overall market performance in the analyzed period.
Target Prices
Analysts project moderate upside potential for PPG Industries and LyondellBasell, reflecting cautious optimism in specialty chemicals.
| Company | Target Low | Target High | Consensus |
|---|---|---|---|
| PPG Industries, Inc. | 115 | 135 | 126 |
| LyondellBasell Industries N.V. | 36 | 53 | 46.63 |
PPG’s consensus target of 126 implies roughly 8% upside from the current 116.46 price. LyondellBasell’s 46.63 target is slightly below its current 50.25 price, signaling modest downside risk.

Don’t Let Luck Decide Your Entry Point
Optimize your entry points with our advanced ProRealTime indicators. You’ll get efficient buy signals with precise price targets for maximum performance. Start outperforming now!
How do institutions grade them?
Here are the recent institutional grades for PPG Industries, Inc. and LyondellBasell Industries N.V.:
PPG Industries, Inc. Grades
This table shows the latest grades assigned by top financial institutions to PPG Industries, Inc.:
| Grading Company | Action | New Grade | Date |
|---|---|---|---|
| Wells Fargo | Maintain | Overweight | 2026-01-29 |
| Jefferies | Maintain | Hold | 2026-01-29 |
| UBS | Maintain | Neutral | 2026-01-29 |
| Citigroup | Maintain | Buy | 2026-01-29 |
| Goldman Sachs | Maintain | Buy | 2026-01-29 |
| JP Morgan | Maintain | Overweight | 2026-01-29 |
| RBC Capital | Maintain | Sector Perform | 2026-01-29 |
| Mizuho | Maintain | Outperform | 2026-01-28 |
| Citigroup | Maintain | Buy | 2025-12-18 |
| JP Morgan | Maintain | Overweight | 2025-11-21 |
LyondellBasell Industries N.V. Grades
This table presents the recent grades from reputable institutions for LyondellBasell Industries N.V.:
| Grading Company | Action | New Grade | Date |
|---|---|---|---|
| RBC Capital | Maintain | Sector Perform | 2026-01-16 |
| Citigroup | Maintain | Neutral | 2026-01-15 |
| UBS | Maintain | Sell | 2025-12-23 |
| Wells Fargo | Downgrade | Equal Weight | 2025-12-19 |
| Citigroup | Maintain | Neutral | 2025-12-18 |
| BMO Capital | Downgrade | Underperform | 2025-12-15 |
| Mizuho | Maintain | Neutral | 2025-12-11 |
| Citigroup | Maintain | Neutral | 2025-11-19 |
| Evercore ISI Group | Maintain | In Line | 2025-11-11 |
| Wells Fargo | Maintain | Overweight | 2025-11-03 |
Which company has the best grades?
PPG Industries consistently earns stronger grades such as Buy, Overweight, and Outperform from multiple top-tier firms. LyondellBasell shows mixed to negative ratings, including Sell and Underperform from some institutions. Investors may view PPG’s superior grade profile as a sign of greater confidence and potential stability.
Risks specific to each company
In 2026’s dynamic market environment, these categories highlight critical pressure points and systemic threats facing PPG Industries, Inc. and LyondellBasell Industries N.V.:
1. Market & Competition
PPG Industries, Inc.
- Faces strong competition in specialty coatings with stable market position.
LyondellBasell Industries N.V.
- Operates in diversified chemical segments but struggles with zero net margin, signaling competitive pressures.
2. Capital Structure & Debt
PPG Industries, Inc.
- High debt-to-assets ratio at 93.55% is a red flag despite good interest coverage of 9.49x.
LyondellBasell Industries N.V.
- Debt metrics appear favorable but lack detailed data; interest coverage moderate at 4.33x, raising caution.
3. Stock Volatility
PPG Industries, Inc.
- Beta of 1.16 suggests slightly above-market volatility.
LyondellBasell Industries N.V.
- Lower beta at 0.739 indicates less sensitivity to market swings.
4. Regulatory & Legal
PPG Industries, Inc.
- Operating globally in specialty coatings, exposed to environmental regulations impacting chemical emissions.
LyondellBasell Industries N.V.
- Global operations including refining expose it to complex regulations and potential legal liabilities.
5. Supply Chain & Operations
PPG Industries, Inc.
- Strong operational efficiency with asset turnover of 1.99; fixed asset turnover flagged unfavorable, indicating potential capital inefficiencies.
LyondellBasell Industries N.V.
- Poor asset turnover metrics suggest operational challenges and potential supply chain disruptions.
6. ESG & Climate Transition
PPG Industries, Inc.
- Industry trends demand aggressive ESG adaptation; no detailed ESG scores but material risk for coatings sector.
LyondellBasell Industries N.V.
- Refining and chemical production face high carbon transition risks; ESG pressures likely significant.
7. Geopolitical Exposure
PPG Industries, Inc.
- Primarily US-based, limiting geopolitical risk but exposed to international trade policies.
LyondellBasell Industries N.V.
- Broad international footprint in volatile regions increases geopolitical and supply chain risks.
Which company shows a better risk-adjusted profile?
PPG’s most impactful risk is its high leverage, which could strain financial flexibility if market conditions sour. LyondellBasell’s zero profitability and weak operational metrics pose critical concerns. Despite its leverage, PPG’s superior operational efficiency and stronger Altman Z-Score (4.7, safe zone) grant it a better risk-adjusted profile. LyondellBasell’s weak Piotroski score (3, very weak) and lack of profitability underline deeper financial instability. Recent data showing PPG’s 9.49x interest coverage versus LYB’s 4.33x reinforces my caution on LYB’s financial resilience.
Final Verdict: Which stock to choose?
PPG Industries stands out with a durable competitive advantage rooted in its efficient capital allocation and strong return on invested capital. Its ability to generate value consistently is impressive. However, investors should watch its relatively high debt levels as a point of vigilance. It suits portfolios aiming for steady growth with a tolerance for moderate financial leverage.
LyondellBasell’s strategic moat lies in its asset-heavy chemical production capabilities, offering some operational scale benefits. Yet, its financial profile appears weaker and less stable than PPG’s, marked by declining returns and financial distress signals. This stock might fit investors seeking turnaround opportunities but demands a higher risk appetite.
If you prioritize capital efficiency and proven value creation, PPG Industries is the compelling choice due to its strong moat and improving profitability. However, if you seek deep value with potential for recovery, LyondellBasell offers a speculative scenario but carries significant stability risks and weaker financial metrics.
Disclaimer: Investment carries a risk of loss of initial capital. The past performance is not a reliable indicator of future results. Be sure to understand risks before making an investment decision.
Go Further
I encourage you to read the complete analyses of PPG Industries, Inc. and LyondellBasell Industries N.V. to enhance your investment decisions: