The TJX Companies, Inc. and Lululemon Athletica Inc. are two dominant players in the retail apparel industry, each with distinct market approaches and innovation strategies. TJX excels in off-price retailing with a broad product range, while Lululemon focuses on premium athletic wear and direct-to-consumer growth. Comparing these companies reveals unique strengths and risks, helping investors identify which aligns best with their portfolio goals. Let’s find out which stands out as the smarter investment choice.

Table of contents
Companies Overview
I will begin the comparison between The TJX Companies, Inc. and Lululemon Athletica Inc. by providing an overview of these two companies and their main differences.
The TJX Companies, Inc. Overview
The TJX Companies, Inc. operates as an off-price apparel and home fashions retailer, offering a wide range of family apparel, footwear, accessories, and home products. With a global footprint including the US, Canada, Europe, and Australia, it manages multiple retail brands such as T.J. Maxx, Marshalls, and HomeGoods. Founded in 1962 and headquartered in Massachusetts, TJX serves diverse consumer needs through 3,500+ stores and e-commerce platforms.
Lululemon Athletica Inc. Overview
Lululemon Athletica Inc. designs and retails athletic apparel and accessories focused on healthy lifestyles and fitness activities like yoga and running. Operating over 570 company-owned stores worldwide and leveraging direct-to-consumer sales channels, Lululemon targets premium activewear markets. Founded in 1998 in Vancouver, it emphasizes innovation and community engagement across North America, Asia, and Europe.
Key similarities and differences
Both TJX and Lululemon operate in the apparel retail sector but differ significantly in business models. TJX focuses on off-price retailing across apparel and home goods with a large store network and multi-brand strategy, while Lululemon concentrates on premium athletic wear sold primarily through company-operated stores and direct channels. TJX is a more mature, large-cap company with broad product diversification, whereas Lululemon targets a niche activewear market with a growth-oriented approach.
Income Statement Comparison
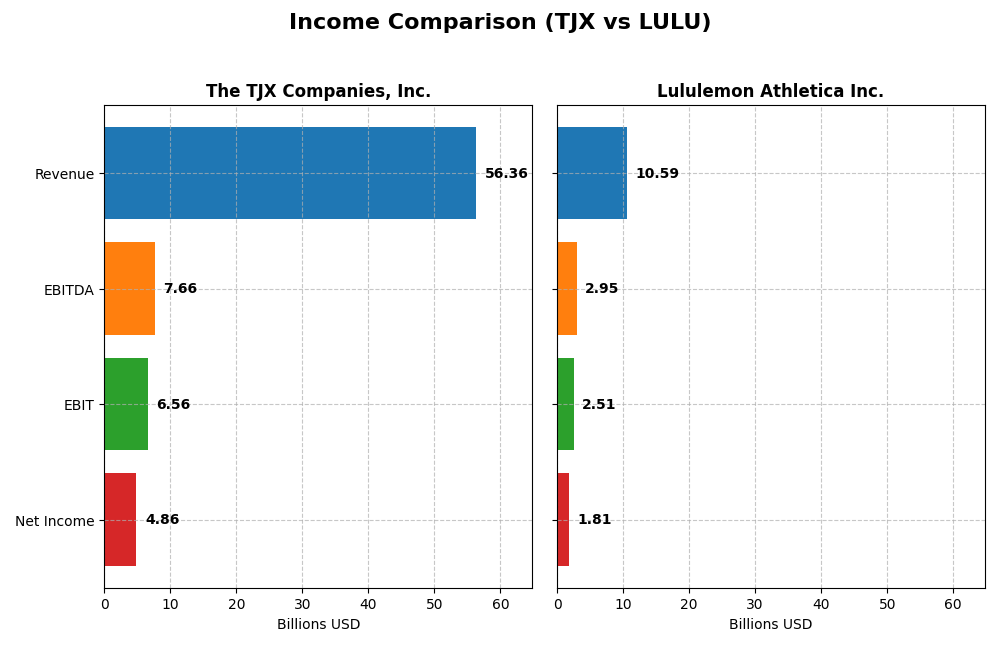
The table below presents a side-by-side comparison of key income statement metrics for The TJX Companies, Inc. and Lululemon Athletica Inc. for their most recent fiscal years.
| Metric | The TJX Companies, Inc. (TJX) | Lululemon Athletica Inc. (LULU) |
|---|---|---|
| Market Cap | 176B | 22.9B |
| Revenue | 56.36B | 10.59B |
| EBITDA | 7.66B | 2.95B |
| EBIT | 6.56B | 2.51B |
| Net Income | 4.86B | 1.81B |
| EPS | 4.31 | 14.67 |
| Fiscal Year | 2025 | 2024 |
Income Statement Interpretations
The TJX Companies, Inc.
TJX demonstrated consistent revenue growth from $32.1B in 2021 to $56.4B in 2025, with net income rising substantially from $90M to $4.86B. Margins improved notably, with gross margin stable around 30.6% and net margin at 8.63%. The latest year showed moderate revenue growth of 3.95% and favorable earnings per share increase of 10.36%, indicating solid profitability enhancement.
Lululemon Athletica Inc.
Lululemon’s revenue climbed from $4.4B in 2020 to $10.6B in 2024, with net income growing from $589M to $1.81B. Margins remain strong, with a gross margin of 59.22% and net margin at 17.14%. The most recent fiscal year witnessed a 10.07% revenue rise alongside a 20% increase in EPS, reflecting robust operational efficiency and margin expansion.
Which one has the stronger fundamentals?
Both companies exhibit favorable income statement evaluations with strong growth trajectories. TJX shows exceptional net income growth over the period, whereas Lululemon maintains higher margins and faster recent revenue and EPS growth. TJX’s scale and margin stability contrast with Lululemon’s superior profitability ratios. These fundamentals suggest differing strengths depending on investor focus.
Financial Ratios Comparison
The table below presents a side-by-side comparison of key financial ratios for The TJX Companies, Inc. and Lululemon Athletica Inc. for the most recent fiscal year available.
| Ratios | The TJX Companies, Inc. (2025) | Lululemon Athletica Inc. (2024) |
|---|---|---|
| ROE | 57.95% | 41.97% |
| ROIC | 21.13% | 29.23% |
| P/E | 28.94 | 27.98 |
| P/B | 16.77 | 11.74 |
| Current Ratio | 1.18 | 2.16 |
| Quick Ratio | 0.60 | 1.38 |
| D/E (Debt-to-Equity) | 1.52 | 0.36 |
| Debt-to-Assets | 40.25% | 20.73% |
| Interest Coverage | 82.92 | 0 (not reported) |
| Asset Turnover | 1.78 | 1.39 |
| Fixed Asset Turnover | 3.32 | 3.31 |
| Payout Ratio | 33.88% | 0% |
| Dividend Yield | 1.17% | 0% |
Interpretation of the Ratios
The TJX Companies, Inc.
TJX shows mostly favorable ratios like a high ROE at 57.95% and ROIC at 21.13%, with strong interest coverage and asset turnover. However, the company faces unfavorable valuations with a PE of 28.94 and PB of 16.77 and some liquidity concerns, including a quick ratio of 0.6. Its dividend yield is stable at 1.17%, supported by consistent payouts, though coverage by free cash flow is tight, posing risks on sustainability.
Lululemon Athletica Inc.
Lululemon exhibits strong profitability with a net margin of 17.14% and favorable returns: ROE 41.97% and ROIC 29.23%. Liquidity and leverage metrics are solid, including a current ratio of 2.16 and debt-to-equity of 0.36. The company does not pay dividends, likely reflecting reinvestment in growth and R&D. Its valuation ratios remain relatively high but with fewer unfavorable indicators than TJX.
Which one has the best ratios?
Lululemon presents a more favorable overall ratio profile with 71.43% of ratios rated favorable, versus TJX’s 42.86%. Lululemon’s stronger liquidity, lower leverage, and higher profitability metrics contrast with TJX’s less attractive valuation and liquidity ratios. However, TJX offers dividend income, which Lululemon currently does not.
Strategic Positioning
This section compares the strategic positioning of The TJX Companies, Inc. and Lululemon Athletica Inc., focusing on market position, key segments, and exposure to technological disruption:
The TJX Companies, Inc.
- Large off-price apparel and home fashions retailer with global presence and high market capitalization.
- Diverse segments: Marmaxx, HomeGoods, TJX Canada, and International drive revenue across apparel and home goods.
- Limited explicit exposure to technological disruption indicated in data provided.
Lululemon Athletica Inc.
- Athletic apparel designer and retailer, smaller market cap, focused on premium lifestyle segments.
- Concentrated on athletic apparel and accessories with company-operated stores and direct-to-consumer sales.
- No explicit details on technological disruption exposure; operates e-commerce and interactive platforms.
The TJX Companies, Inc. vs Lululemon Athletica Inc. Positioning
TJX shows a diversified approach across multiple segments and geographies, benefiting from scale and variety, while Lululemon is more concentrated on premium athletic wear with a direct consumer focus, offering specialization but less diversification.
Which has the best competitive advantage?
Both companies demonstrate very favorable moats with growing ROIC and value creation; TJX benefits from scale and diversification, while Lululemon shows strong value creation in a focused niche with growth potential.
Stock Comparison
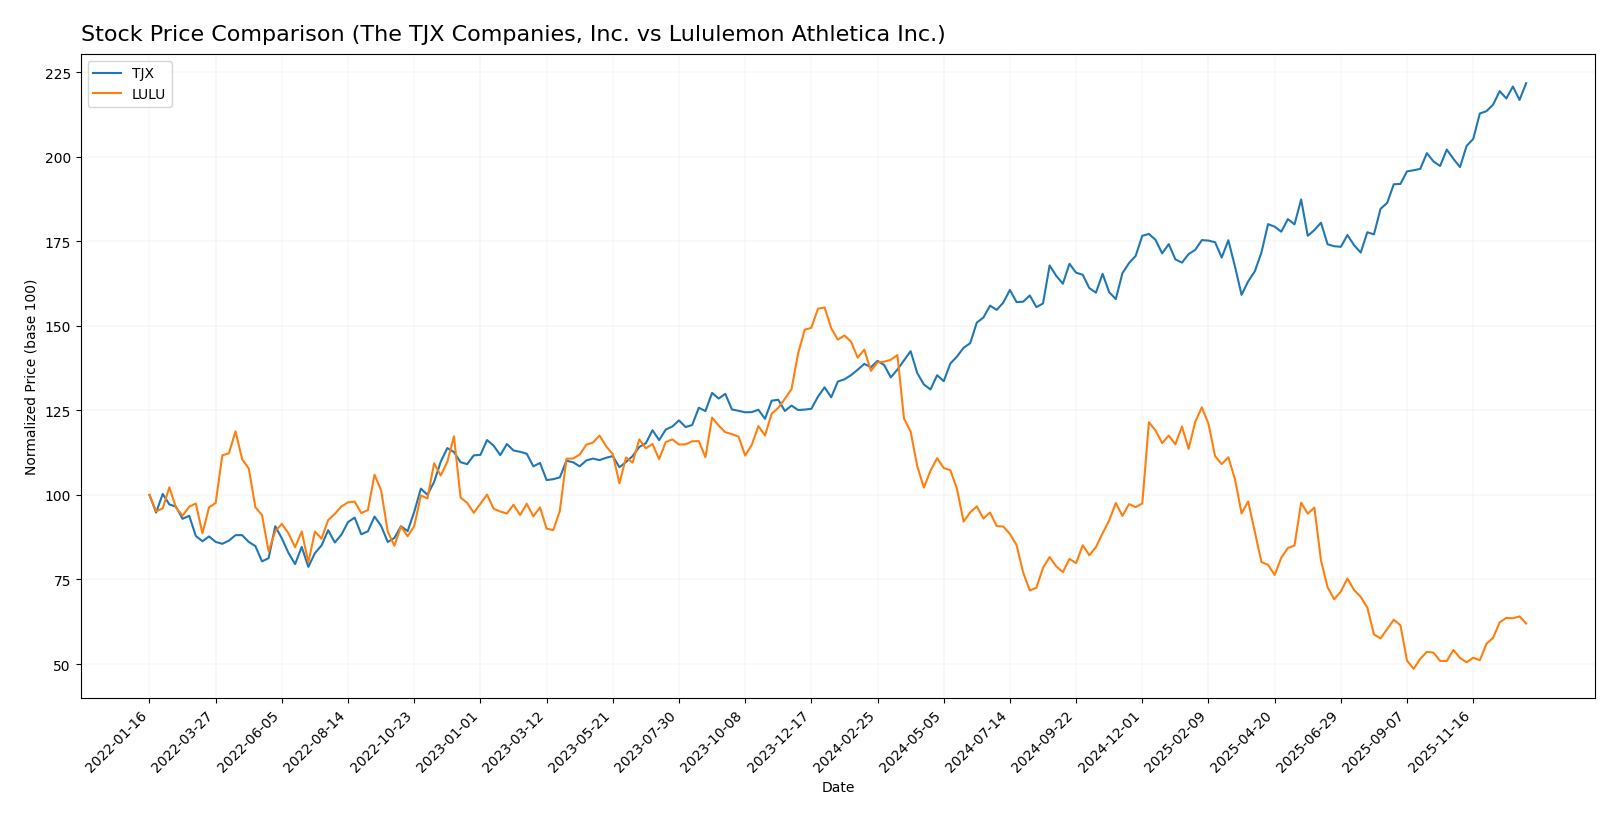
The stock price chart over the past 12 months reveals distinct trading dynamics: The TJX Companies, Inc. experienced a strong bullish trend with accelerating gains, while Lululemon Athletica Inc. faced a pronounced bearish trend despite recent upward momentum.
Trend Analysis
The TJX stock showed a 60.96% price increase over the past year, indicating a bullish trend with acceleration. Its price ranged from 93.36 to 157.81, accompanied by moderate volatility (std deviation 15.86).
Lululemon’s stock price declined by 54.65% over the same period, reflecting a bearish trend with acceleration. The price fluctuated between 159.87 and 464.94, showing higher volatility (std deviation 79.71).
Comparing both stocks, TJX delivered the highest market performance with a significant positive return, whereas LULU experienced a substantial loss despite recent gains.
Target Prices
The current analyst consensus indicates a positive outlook for both The TJX Companies, Inc. and Lululemon Athletica Inc.
| Company | Target High | Target Low | Consensus |
|---|---|---|---|
| The TJX Companies, Inc. | 193 | 150 | 170.33 |
| Lululemon Athletica Inc. | 303 | 146 | 201.3 |
Analysts expect TJX to trade moderately above its current price of $157.81, suggesting potential upside. Lululemon’s consensus target of $201.3 is close to its current price of $203.9, indicating a more balanced outlook with some volatility risk.
Analyst Opinions Comparison
This section compares analysts’ ratings and grades for The TJX Companies, Inc. (TJX) and Lululemon Athletica Inc. (LULU):
Rating Comparison
TJX Rating
- Rating: B, categorized as Very Favorable by analysts.
- Discounted Cash Flow Score: Moderate at 3 out of 5.
- ROE Score: Very Favorable with a perfect 5 out of 5.
- ROA Score: Very Favorable with 5 out of 5.
- Debt To Equity Score: Very Unfavorable at 1 out of 5.
- Overall Score: Moderate at 3 out of 5.
LULU Rating
- Rating: A+, also considered Very Favorable by analysts.
- Discounted Cash Flow Score: Very Favorable at 5 out of 5.
- ROE Score: Very Favorable with a perfect 5 out of 5.
- ROA Score: Very Favorable with 5 out of 5.
- Debt To Equity Score: Moderate at 3 out of 5.
- Overall Score: Favorable at 4 out of 5.
Which one is the best rated?
Based strictly on the provided data, LULU holds a superior overall rating (A+) and higher overall score (4) compared to TJX’s B rating and score of 3. LULU also outperforms TJX in discounted cash flow and debt-to-equity scores, indicating a stronger financial position according to analysts.
Scores Comparison
The following table compares the Altman Z-Score and Piotroski Score of TJX and Lululemon:
TJX Scores
- Altman Z-Score: 6.73, indicating a safe zone with low bankruptcy risk.
- Piotroski Score: 7, reflecting strong financial health and value.
LULU Scores
- Altman Z-Score: 9.31, indicating a safe zone with very low bankruptcy risk.
- Piotroski Score: 6, indicating average financial strength and value.
Which company has the best scores?
Lululemon has a higher Altman Z-Score, suggesting lower bankruptcy risk, while TJX has a stronger Piotroski Score, indicating better financial health. Each company shows strengths in different financial dimensions based on these scores.
Grades Comparison
Here is a detailed comparison of the recent grades assigned to The TJX Companies, Inc. and Lululemon Athletica Inc.:
The TJX Companies, Inc. Grades
The following table summarizes recent grades from major financial institutions for TJX:
| Grading Company | Action | New Grade | Date |
|---|---|---|---|
| UBS | Maintain | Buy | 2026-01-08 |
| Wells Fargo | Maintain | Equal Weight | 2025-12-16 |
| Barclays | Maintain | Overweight | 2025-12-04 |
| Telsey Advisory Group | Maintain | Outperform | 2025-12-04 |
| Baird | Maintain | Outperform | 2025-12-04 |
| Barclays | Maintain | Overweight | 2025-11-20 |
| BTIG | Maintain | Buy | 2025-11-20 |
| JP Morgan | Maintain | Overweight | 2025-11-20 |
| B of A Securities | Maintain | Buy | 2025-11-20 |
| Goldman Sachs | Maintain | Buy | 2025-11-20 |
The TJX Companies, Inc. has consistently received positive grades with a consensus rating of “Buy,” indicating a strong favorable outlook from analysts.
Lululemon Athletica Inc. Grades
The following table summarizes recent grades from major financial institutions for Lululemon:
| Grading Company | Action | New Grade | Date |
|---|---|---|---|
| Stifel | Maintain | Hold | 2025-12-30 |
| Jefferies | Maintain | Hold | 2025-12-18 |
| Citigroup | Maintain | Neutral | 2025-12-12 |
| JP Morgan | Maintain | Neutral | 2025-12-12 |
| UBS | Maintain | Neutral | 2025-12-12 |
| Barclays | Maintain | Equal Weight | 2025-12-12 |
| BTIG | Maintain | Buy | 2025-12-12 |
| Piper Sandler | Maintain | Neutral | 2025-12-12 |
| Goldman Sachs | Maintain | Neutral | 2025-12-12 |
| Baird | Maintain | Neutral | 2025-12-12 |
Lululemon Athletica Inc. has a more mixed set of grades with a consensus rating of “Hold,” reflecting a cautious or neutral stance by analysts.
Which company has the best grades?
The TJX Companies, Inc. has received consistently stronger grades, predominantly “Buy” and “Outperform,” compared to Lululemon’s mostly “Hold” and “Neutral” ratings. This disparity suggests investors might perceive TJX as having a more favorable growth or stability outlook, which could influence portfolio positioning and risk assessment.
Strengths and Weaknesses
Below is a comparative overview of the key strengths and weaknesses for The TJX Companies, Inc. (TJX) and Lululemon Athletica Inc. (LULU) based on the latest available data.
| Criterion | The TJX Companies, Inc. (TJX) | Lululemon Athletica Inc. (LULU) |
|---|---|---|
| Diversification | Strong diversification across segments: Marmaxx $34.6B, HomeGoods $9.4B, Canada $5.2B, International $7.2B | More concentrated with focus on Women’s $6.7B, Men’s $2.6B, and Other $1.3B segments |
| Profitability | Moderate net margin at 8.6%, very high ROE 57.95%, ROIC 21.13% | Higher net margin at 17.1%, ROE 41.97%, ROIC 29.23% |
| Innovation | Competitive advantage through scale and value retail model; steady growth in ROIC (+715%) | Strong brand innovation and product development; consistent ROIC growth (+72%) |
| Global presence | Established North American and international footprint | Primarily North American with growing global presence |
| Market Share | Large market share in off-price retail market | Leading position in premium athletic apparel market |
Key takeaways: TJX offers broad diversification and strong financial efficiency but with moderate profitability margins. Lululemon excels in profitability and innovation with a focused product portfolio and favorable financial ratios. Both demonstrate durable competitive advantages with growing ROIC, but investment choice depends on preference for diversification versus high-margin growth potential.
Risk Analysis
Below is a comparative table summarizing the key risks for The TJX Companies, Inc. (TJX) and Lululemon Athletica Inc. (LULU) based on the latest available data from 2025 and 2024, respectively.
| Metric | The TJX Companies, Inc. (TJX) | Lululemon Athletica Inc. (LULU) |
|---|---|---|
| Market Risk | Moderate (Beta 0.75, stable retail sector) | Moderate-High (Beta 1.02, sensitive to consumer trends) |
| Debt level | Elevated (Debt/Equity 1.52, neutral debt-to-assets 40.25%) | Low (Debt/Equity 0.36, debt-to-assets 20.73%) |
| Regulatory Risk | Moderate (US-focused with some international exposure) | Moderate (Global footprint with complex supply chain regulations) |
| Operational Risk | Moderate (Extensive store network and supply chain) | Moderate (Direct-to-consumer and retail stores, reliance on brand loyalty) |
| Environmental Risk | Moderate (Retail operations with growing sustainability initiatives) | Moderate-High (Pressure on sustainable production and environmental impact in apparel) |
| Geopolitical Risk | Moderate (Operations in North America, Europe, and Australia) | Moderate (Presence in multiple countries including China and Europe) |
TJX’s most impactful risk lies in its relatively high debt level, which could pressure financial flexibility despite strong operational metrics. Lululemon faces higher market sensitivity and environmental pressures but benefits from a stronger balance sheet and favorable profitability. Both companies are in the safe zone regarding bankruptcy risk, with Altman Z-Scores well above 3, though Lululemon’s lower Piotroski score suggests room for improvement in financial robustness.
Which Stock to Choose?
The TJX Companies, Inc. shows a favorable income evolution with a 75.37% revenue increase over 2021-2025 and strong profitability metrics such as a 57.95% ROE and 21.13% ROIC, though it faces some unfavorable valuation ratios and moderate debt concerns. Its financial health is supported by a very favorable “B” rating and a very favorable moat status indicating durable competitive advantage.
Lululemon Athletica Inc. exhibits robust income growth of 140.54% over 2020-2024, superior profitability with a 41.97% ROE and 29.23% ROIC, and mostly favorable financial ratios including lower leverage and strong liquidity. The company holds a very favorable “A+” rating and a very favorable moat, reflecting sustained profitability and value creation.
Investors prioritizing growth and strong profitability might find Lululemon’s higher income growth and favorable ratios appealing, while those valuing a durable competitive moat combined with steady profitability and moderate valuation metrics could view TJX as a compelling quality-focused option. The choice may depend on individual risk tolerance and investment strategy.
Disclaimer: Investment carries a risk of loss of initial capital. The past performance is not a reliable indicator of future results. Be sure to understand risks before making an investment decision.
Go Further
I encourage you to read the complete analyses of The TJX Companies, Inc. and Lululemon Athletica Inc. to enhance your investment decisions: