The Home Depot, Inc. (HD) and Lowe’s Companies, Inc. (LOW) are two giants in the home improvement retail industry, both serving millions of homeowners and professionals alike. Their overlapping markets and focus on innovation in product offerings and installation services make them natural competitors. This article explores their strengths and risks to help you decide which company aligns best with your investment goals. Let’s uncover the most compelling choice for your portfolio.

Table of contents
Companies Overview
I will begin the comparison between The Home Depot, Inc. and Lowe’s Companies, Inc. by providing an overview of these two companies and their main differences.
The Home Depot, Inc. Overview
The Home Depot, Inc. operates as a leading home improvement retailer in the US, offering a broad range of building materials, home improvement products, and installation services. With over 2,300 stores, it serves both homeowners and professional customers, including contractors and tradesmen. The company emphasizes tool rental and online sales, positioning itself as a comprehensive supplier in the home improvement sector.
Lowe’s Companies, Inc. Overview
Lowe’s Companies, Inc. is a home improvement retailer operating in the US and internationally, providing products for construction, maintenance, and decor. It offers installation services via independent contractors and sells through physical stores and online platforms. With nearly 2,000 stores, Lowe’s targets homeowners, renters, and professional customers, focusing on national and private brand merchandise across a wide product range.
Key similarities and differences
Both companies operate in the home improvement retail industry, targeting a mix of professional and consumer customers with extensive product lines and installation services. The Home Depot has a larger store footprint and workforce, while Lowe’s international presence adds geographic diversification. Lowe’s emphasizes contractor partnerships for installation, whereas Home Depot provides tool rentals, reflecting nuanced differences in service offerings.
Income Statement Comparison
This table presents a side-by-side comparison of key income statement metrics for The Home Depot, Inc. and Lowe’s Companies, Inc. for the fiscal year 2024.

| Metric | The Home Depot, Inc. | Lowe’s Companies, Inc. |
|---|---|---|
| Market Cap | 373B | 150B |
| Revenue | 160B | 83.7B |
| EBITDA | 25.4B | 12.6B |
| EBIT | 21.7B | 10.6B |
| Net Income | 14.8B | 6.95B |
| EPS | 14.96 | 12.25 |
| Fiscal Year | 2024 | 2024 |
Income Statement Interpretations
The Home Depot, Inc.
The Home Depot showed overall revenue growth of 20.74% and net income growth of 15.08% from 2020 to 2024, with generally favorable gross and net margins around 33.42% and 9.28%, respectively. However, in the most recent year, revenue growth slowed to 4.48%, while net margin contracted by 6.42%, reflecting some margin pressure and a slight decline in EBIT.
Lowe’s Companies, Inc.
Lowe’s experienced a decline in revenue by 6.61% over the 2020-2024 period but achieved net income growth of 19.23% and improved net margin by 27.67%. Margins remain favorable with a gross margin of 31.25% and net margin near 8.31%. The latest fiscal year showed a revenue decrease of 3.13% alongside declines in EBIT and net margin, indicating recent operational challenges.
Which one has the stronger fundamentals?
The Home Depot exhibits stronger fundamentals based on sustained revenue growth, higher gross margins, and a favorable global income statement evaluation despite recent margin pressures. Lowe’s, while showing impressive net income and margin improvements over time, faces consistent revenue declines and a neutral overall income statement outlook. The Home Depot’s scale and margin stability provide a more robust income profile.
Financial Ratios Comparison
The table below presents a side-by-side comparison of key financial ratios for The Home Depot, Inc. (HD) and Lowe’s Companies, Inc. (LOW) for the fiscal year 2024, offering a clear view of their latest performance metrics.
| Ratios | The Home Depot, Inc. (HD) | Lowe’s Companies, Inc. (LOW) |
|---|---|---|
| ROE | 2.23% | -0.49% |
| ROIC | 22.3% | 26.5% |
| P/E | 27.55 | 21.19 |
| P/B | 61.42 | -10.36 |
| Current Ratio | 1.11 | 1.09 |
| Quick Ratio | 0.29 | 0.16 |
| D/E (Debt-to-Equity) | 9.38 | -2.79 |
| Debt-to-Assets | 64.8% | 89.0% |
| Interest Coverage | 9.27 | 6.88 |
| Asset Turnover | 1.66 | 1.88 |
| Fixed Asset Turnover | 4.52 | 3.91 |
| Payout ratio | 60.3% | 36.9% |
| Dividend yield | 2.19% | 1.74% |
Interpretation of the Ratios
The Home Depot, Inc.
The Home Depot shows a mix of strong and weak ratios. Favorable metrics include a high return on equity (223%) and return on invested capital (22.3%), as well as good interest coverage and asset turnover. However, concerns arise from unfavorable price-to-book (61.42) and debt ratios. Dividend yield is attractive at 2.19%, supported by stable payout and buybacks, though debt levels warrant caution.
Lowe’s Companies, Inc.
Lowe’s exhibits generally favorable operating efficiency with good returns on invested capital (26.5%) and asset turnover, but a negative return on equity (-48.9%) signals profitability challenges. Debt-to-equity is favorable due to negative value, but high debt-to-assets ratio (89%) is a concern. Lowe’s dividend yield is 1.74%, reflecting modest shareholder returns relative to its financial profile.
Which one has the best ratios?
Both companies have 50% favorable ratios, yet Lowe’s has fewer unfavorable ratios (21.43% vs. 35.71%) and a more balanced price-to-earnings ratio. However, Home Depot’s superior profitability and dividend yield contrast with its higher leverage concerns. The assessment depends on weighing profitability strength against financial risk and shareholder returns.
Strategic Positioning
This section compares the strategic positioning of The Home Depot and Lowe’s, focusing on market position, key segments, and exposure to technological disruption:
The Home Depot, Inc.
- Market leader in home improvement with 2,317 US stores; faces competition in a large sector.
- Diversified product lines in building materials, hardlines, and décor with strong installation services.
- Limited explicit exposure to technological disruption mentioned; operates online sales channels.
Lowe’s Companies, Inc.
- Operates 1,971 stores primarily in the US and internationally; competes in home improvement retail.
- Product focus on building products, hardlines, home décor; offers installation via contractors.
- No specific technological disruption exposure detailed; also uses online platforms and mobile apps.
The Home Depot, Inc. vs Lowe’s Companies, Inc. Positioning
The Home Depot presents a diversified portfolio emphasizing installation and professional services, while Lowe’s has a somewhat concentrated product focus including international presence. Home Depot’s larger store base contrasts with Lowe’s broader geographic reach and contractor-based services.
Which has the best competitive advantage?
Lowe’s shows a favorable moat with stable profitability and efficient capital use, while Home Depot has a slightly favorable moat but faces declining profitability, suggesting Lowe’s currently holds a stronger competitive advantage.
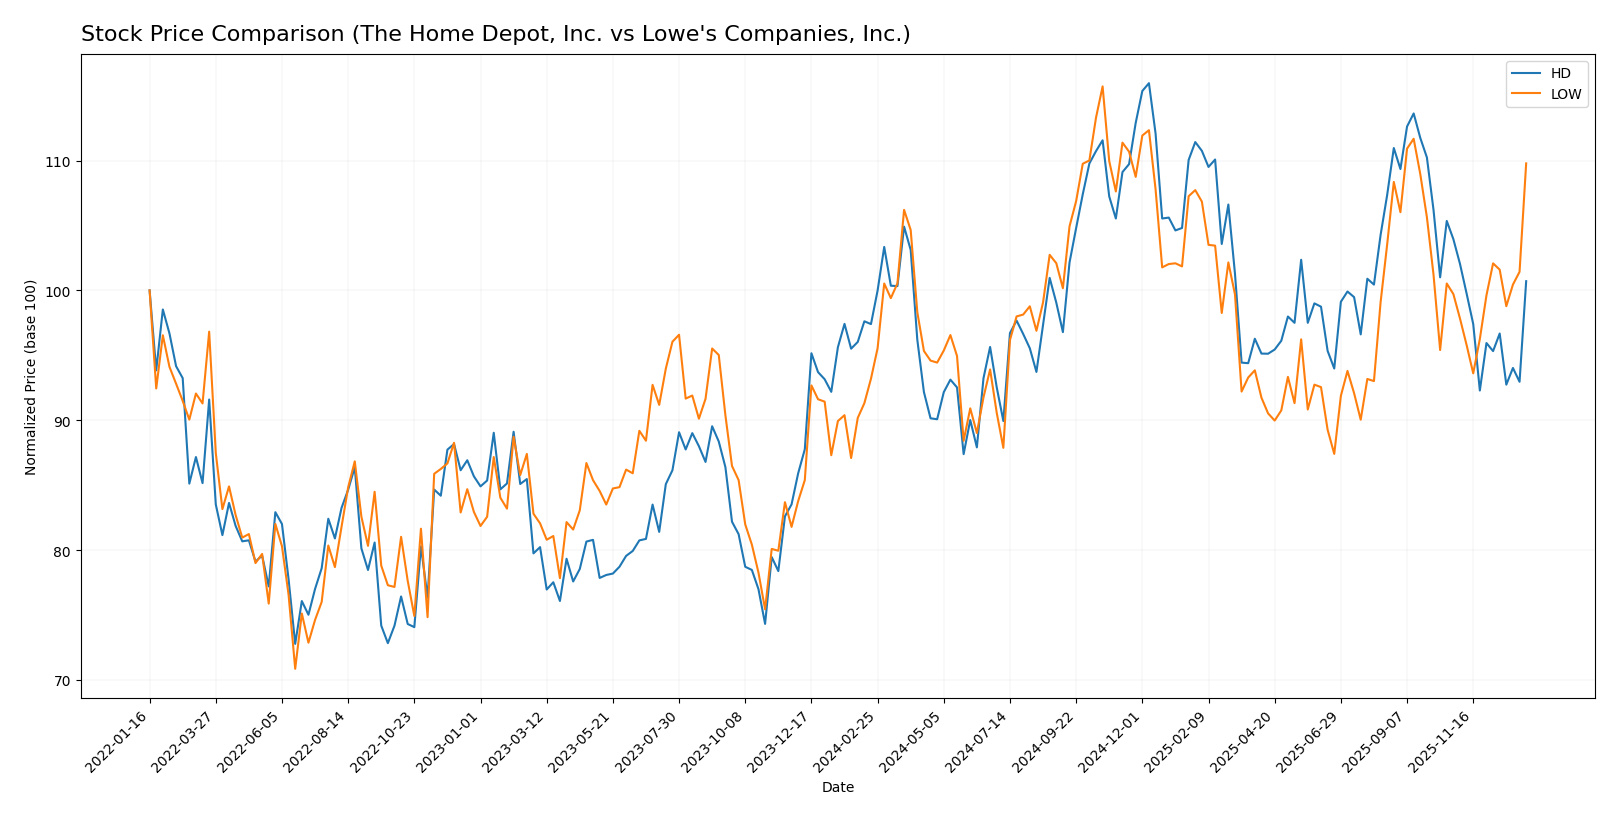
Stock Comparison
The stock price movements of The Home Depot, Inc. and Lowe’s Companies, Inc. over the past 12 months reveal distinct bullish trends with varying acceleration and recent performance dynamics.
Trend Analysis
The Home Depot, Inc. (HD) exhibited a 3.39% price increase over the past year, indicating a bullish trend with deceleration. The stock ranged between 325.1 and 431.37, showing notable volatility with a standard deviation of 25.78.
Lowe’s Companies, Inc. (LOW) showed a stronger 17.79% price gain over the same period, confirming a bullish trend with acceleration. Its price fluctuated between 212.75 and 281.64, with less volatility than HD at a standard deviation of 16.94.
Comparatively, LOW delivered the highest market performance over the past year, showing both stronger gains and accelerating momentum relative to HD.
Target Prices
The current analyst consensus presents a positive outlook for both The Home Depot, Inc. and Lowe’s Companies, Inc.
| Company | Target High | Target Low | Consensus |
|---|---|---|---|
| The Home Depot, Inc. | 497 | 320 | 405.86 |
| Lowe’s Companies, Inc. | 316 | 230 | 275.6 |
Analysts expect The Home Depot’s stock to appreciate above its current price of $374.64, while Lowe’s consensus target is also above its current $267.21, signaling moderate upside potential for both.
Analyst Opinions Comparison
This section compares analysts’ ratings and grades for The Home Depot, Inc. (HD) and Lowe’s Companies, Inc. (LOW):
Rating Comparison
HD Rating
- Rating: B, indicating a very favorable evaluation of financial standing.
- Discounted Cash Flow Score: Moderate score of 3, suggesting an average valuation outlook.
- ROE Score: Very favorable top score of 5, showing efficient profit generation from equity.
- ROA Score: Very favorable top score of 5, reflecting strong asset utilization.
- Debt To Equity Score: Very unfavorable score of 1, indicating higher financial risk.
- Overall Score: Moderate score of 3, reflecting a balanced but not outstanding overall rating.
LOW Rating
- Rating: B-, also very favorable but slightly lower than HD.
- Discounted Cash Flow Score: Moderate score of 3, similar valuation perspective to HD.
- ROE Score: Very unfavorable score of 1, indicating weaker profit generation from equity.
- ROA Score: Very favorable top score of 5, equal to HD in asset efficiency.
- Debt To Equity Score: Very unfavorable score of 1, same level of financial risk as HD.
- Overall Score: Moderate score of 2, slightly below HD’s overall score.
Which one is the best rated?
Based strictly on the provided data, HD is better rated overall with a higher rating of B and stronger ROE performance. Both share similar moderate discounted cash flow scores and financial risk, but HD’s overall score surpasses LOW’s by one point.
Scores Comparison
The comparison of financial scores for The Home Depot, Inc. and Lowe’s Companies, Inc. is as follows:
The Home Depot, Inc. Scores
- Altman Z-Score of 5.69, indicating a safe financial zone
- Piotroski Score of 6, reflecting average financial health
Lowe’s Companies, Inc. Scores
- Altman Z-Score of 3.22, also in the safe financial zone
- Piotroski Score of 6, also reflecting average financial health
Which company has the best scores?
Both companies are in the safe zone for Altman Z-Score, but Home Depot’s score is higher, indicating stronger financial stability. Both share the same average Piotroski Score of 6.
Grades Comparison
The following presents the latest verified grades and ratings from reputable firms for The Home Depot, Inc. and Lowe’s Companies, Inc.:
The Home Depot, Inc. Grades
This table lists recent analyst grades for The Home Depot from established grading companies.
| Grading Company | Action | New Grade | Date |
|---|---|---|---|
| Piper Sandler | Maintain | Overweight | 2025-12-10 |
| UBS | Maintain | Buy | 2025-12-10 |
| Telsey Advisory Group | Maintain | Outperform | 2025-12-10 |
| DA Davidson | Maintain | Buy | 2025-12-10 |
| Wells Fargo | Maintain | Overweight | 2025-12-10 |
| RBC Capital | Maintain | Sector Perform | 2025-12-10 |
| Oppenheimer | Maintain | Perform | 2025-12-05 |
| Stifel | Maintain | Hold | 2025-12-01 |
| Citigroup | Maintain | Buy | 2025-11-21 |
| B of A Securities | Maintain | Buy | 2025-11-19 |
The Home Depot’s grades predominantly indicate a Buy or Overweight stance, with a few Hold or Sector Perform ratings, reflecting a generally positive analyst outlook.
Lowe’s Companies, Inc. Grades
This table shows recent analyst grades for Lowe’s Companies from recognized grading institutions.
| Grading Company | Action | New Grade | Date |
|---|---|---|---|
| Barclays | Upgrade | Overweight | 2026-01-07 |
| Oppenheimer | Maintain | Outperform | 2025-12-05 |
| Stifel | Maintain | Hold | 2025-12-01 |
| JP Morgan | Maintain | Overweight | 2025-11-20 |
| UBS | Maintain | Buy | 2025-11-20 |
| RBC Capital | Maintain | Sector Perform | 2025-11-20 |
| Bernstein | Maintain | Outperform | 2025-11-20 |
| Mizuho | Maintain | Outperform | 2025-11-20 |
| Truist Securities | Maintain | Buy | 2025-11-20 |
| Baird | Maintain | Outperform | 2025-11-20 |
Lowe’s exhibits a strong consensus of Outperform, Buy, and Overweight ratings, with only one Hold, indicating positive analyst sentiment and a recent upgrade by Barclays.
Which company has the best grades?
Both companies hold a consensus rating of Buy, but Lowe’s has a higher concentration of Outperform and Overweight ratings, including a recent upgrade. This suggests a slightly stronger analyst confidence in Lowe’s, potentially impacting investor sentiment favorably toward growth expectations.
Strengths and Weaknesses
Below is a comparison of key strengths and weaknesses for The Home Depot, Inc. (HD) and Lowe’s Companies, Inc. (LOW) based on the most recent data available.
| Criterion | The Home Depot, Inc. (HD) | Lowe’s Companies, Inc. (LOW) |
|---|---|---|
| Diversification | Broad product range including Building Materials (53B), Décor (52B), Hardlines (49B) | Diverse product lines with Building Products (26B), Home Decor (31B), Hardlines (24B) |
| Profitability | ROIC 22.3% (favorable), Net margin 9.28% (neutral), ROE very strong at 223% | ROIC 26.5% (favorable), Net margin 8.31% (neutral), ROE negative at -49% due to recent losses |
| Innovation | Moderate innovation focus, stable operational metrics | Stable profitability with consistent ROIC growth, slightly more innovation in product lines |
| Global presence | Primarily US-focused with strong market penetration | Also mainly US-focused, with a slightly smaller footprint |
| Market Share | Largest in home improvement retail, strong brand loyalty | Second largest, growing steadily but trailing HD in scale |
Key takeaways: Both companies show strong value creation with ROIC well above WACC, indicating competitive moats. Home Depot leads in scale and profitability metrics, though its ROIC is declining. Lowe’s shows stable ROIC growth but faces challenges in returns on equity. Investors should weigh HD’s scale and strong margins against LOW’s potential for recovery and innovation.
Risk Analysis
Below is a comparative table summarizing key risks for The Home Depot, Inc. (HD) and Lowe’s Companies, Inc. (LOW) based on their most recent 2024 financial and market data:
| Metric | The Home Depot, Inc. (HD) | Lowe’s Companies, Inc. (LOW) |
|---|---|---|
| Market Risk | Beta 1.07 – slightly above market volatility | Beta 0.96 – slightly less volatile than market |
| Debt level | Debt-to-assets 64.8% – relatively high leverage | Debt-to-assets 89.0% – very high leverage, riskier balance sheet |
| Regulatory Risk | Moderate, US-centric retail regulations | Moderate, US & some international exposure |
| Operational Risk | Large scale operations with 2,317 stores, supply chain complexity | 1,971 stores, operational scale slightly smaller but similar risks |
| Environmental Risk | Exposure to sustainability and energy use regulations in retail | Similar exposure, with incremental risk from international operations |
| Geopolitical Risk | Primarily US market – limited geopolitical risk | Some international exposure raises geopolitical uncertainty |
The most impactful risks are the high debt levels for both companies, especially Lowe’s with nearly 90% debt-to-assets ratio, which could strain financial flexibility in adverse economic conditions. Market risk is moderate, with Home Depot showing a bit more sensitivity to market swings. Operational risks are significant but well managed given their scale. Investors should watch leverage closely as it presents the highest likelihood for financial pressure.
Which Stock to Choose?
The Home Depot, Inc. (HD) shows a favorable income statement with steady revenue growth of 20.74% over 2020-2024, strong profitability, and a slightly favorable overall financial ratios evaluation despite some debt concerns. Its economic moat is slightly favorable, indicating value creation but declining profitability. HD holds a very favorable rating and is in the safe zone by Altman Z-Score, with an average Piotroski score.
Lowe’s Companies, Inc. (LOW) presents a mixed income evolution with a negative revenue trend over the period but favorable net income and margin growth. Its financial ratios are slightly favorable overall, supported by a favorable moat with stable profitability. LOW also has a very favorable rating and is in the safe zone per Altman Z-Score, sharing an average Piotroski score.
Investors with a growth focus might find HD appealing due to its favorable income growth and strong profitability metrics, while those seeking stability in profitability and a favorable moat trend could perceive LOW as more suitable given its stable economic moat and recent positive price acceleration.
Disclaimer: Investment carries a risk of loss of initial capital. The past performance is not a reliable indicator of future results. Be sure to understand risks before making an investment decision.
Go Further
I encourage you to read the complete analyses of The Home Depot, Inc. and Lowe’s Companies, Inc. to enhance your investment decisions: