Home > Comparison > Financial Services > WRB vs L
The strategic rivalry between W. R. Berkley Corporation and Loews Corporation shapes the property and casualty insurance landscape. Berkley operates as a focused commercial lines insurer with a strong reinsurance arm. Loews presents a diversified model spanning insurance, energy infrastructure, and manufacturing. This analysis contrasts their operational approaches to identify which offers a superior risk-adjusted return for a balanced portfolio navigating sector and macroeconomic cycles.

Table of contents
Companies Overview
W. R. Berkley and Loews Corporation stand as influential players in the U.S. property and casualty insurance market.
W. R. Berkley Corporation: Specialist in Commercial Insurance
W. R. Berkley Corporation excels as a commercial lines insurance writer in the U.S. and internationally. It generates revenue primarily through underwriting commercial insurance covering property, liability, workers’ compensation, and cyber risk solutions. In 2026, Berkley focuses strategically on expanding its specialty insurance and reinsurance segments, enhancing risk management capabilities across diverse industries.
Loews Corporation: Diversified Insurance and Energy Operator
Loews Corporation operates as a commercial property and casualty insurer with a significant footprint in specialty insurance, surety bonds, and casualty coverages. It diversifies through transportation and storage of natural gas and NGLs via extensive pipelines, alongside plastic container manufacturing and hospitality. Loews’ 2026 strategy emphasizes integrating insurance with its energy and manufacturing businesses to optimize capital allocation.
Strategic Collision: Similarities & Divergences
Both companies prioritize commercial insurance but diverge in diversification approaches. Berkley focuses on specialty insurance and reinsurance, while Loews blends insurance with energy infrastructure and manufacturing. Their primary battleground lies in underwriting commercial risk with tailored solutions. Berkley appeals to investors favoring insurance specialization, whereas Loews offers a broader, multi-industry investment profile with varied operational risks.
Income Statement Comparison
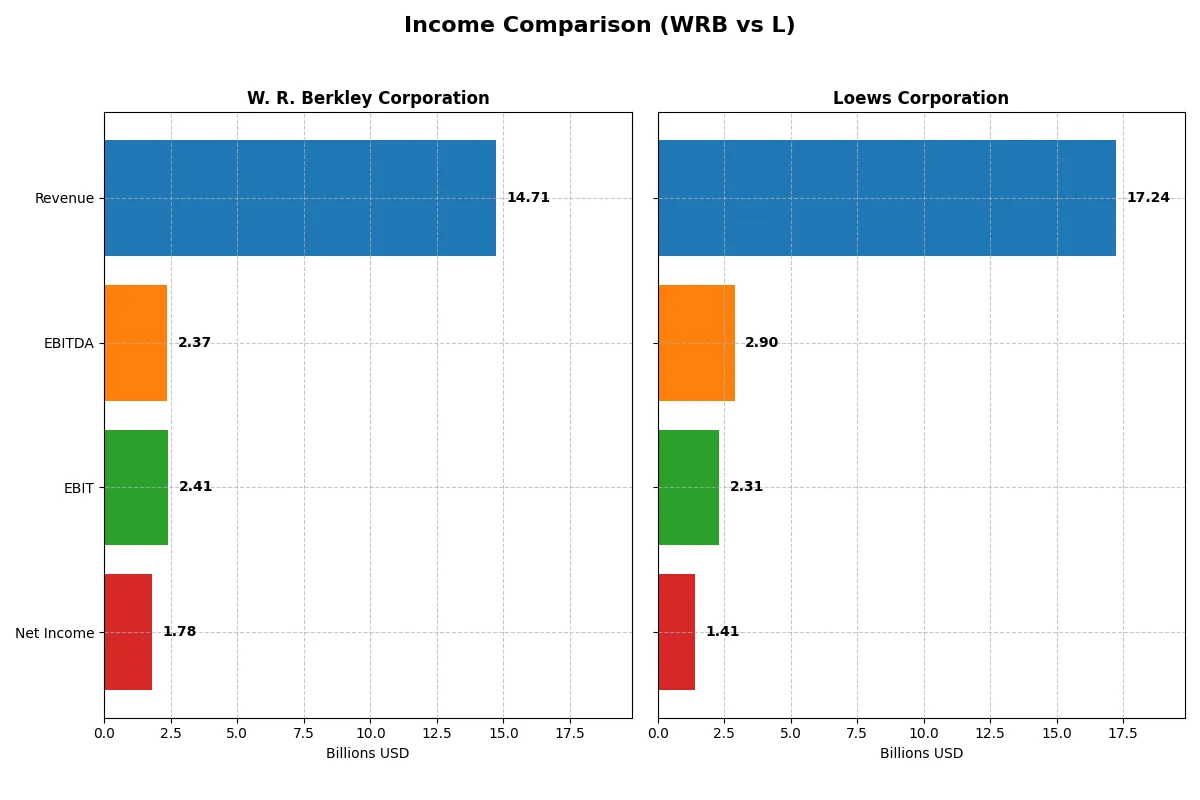
This data dissects the core profitability and scalability of both corporate engines to reveal who dominates the bottom line:
| Metric | W. R. Berkley Corporation (WRB) | Loews Corporation (L) |
|---|---|---|
| Revenue | 14.7B | 17.2B |
| Cost of Revenue | 11.8B | 9.5B |
| Operating Expenses | 579M | 5.8B |
| Gross Profit | 2.9B | 7.7B |
| EBITDA | 2.4B | 2.9B |
| EBIT | 2.4B | 2.3B |
| Interest Expense | 127M | 441M |
| Net Income | 1.8B | 1.4B |
| EPS | 4.48 | 6.42 |
| Fiscal Year | 2025 | 2024 |
Income Statement Analysis: The Bottom-Line Duel
This income statement comparison reveals which company runs a more efficient and profitable corporate engine through recent financial performance.
W. R. Berkley Corporation Analysis
W. R. Berkley’s revenue rose steadily from 9.46B in 2021 to 14.7B in 2025, with net income climbing from 1.02B to 1.33B. Its gross margin hovered near 20%, while net margin improved to a favorable 12.1% in 2025, signaling disciplined cost control and stable profitability despite a slight dip in gross profit growth last year.
Loews Corporation Analysis
Loews grew revenue from 13.7B in 2021 to 17.2B in 2024, with net income jumping significantly from 1.56B to 1.41B in 2024. It boasts a strong gross margin of 44.7%, though net margin lags at 8.2%. Recent growth rates show robust revenue and gross profit expansion but a modest decline in EBIT and net margin, indicating margin pressure.
Margin Strength vs. Growth Momentum
W. R. Berkley delivers consistent margin improvement and steady net income growth, reflecting strong operational efficiency. Loews leads in top-line scale and gross margin but faces margin compression and slower earnings growth. For investors, W. R. Berkley’s stable profitability suits those prioritizing margin resilience, while Loews appeals to those chasing growth backed by sizeable revenue expansion.
Financial Ratios Comparison
These vital ratios act as a diagnostic tool to expose the underlying fiscal health, valuation premiums, and capital efficiency of the companies compared below:
| Ratios | W. R. Berkley Corporation (WRB) | Loews Corporation (L) |
|---|---|---|
| ROE | 20.9% (2024) | 8.3% (2024) |
| ROIC | N/A | 298.8% (2024) |
| P/E | 13.3 (2024) | 13.2 (2024) |
| P/B | 2.79 (2024) | 1.09 (2024) |
| Current Ratio | N/A | N/A |
| Quick Ratio | N/A | N/A |
| D/E | 0.34 (2024) | 0.52 (2024) |
| Debt-to-Assets | 7.0% (2024) | 10.9% (2024) |
| Interest Coverage | 17.8x (2024) | 4.2x (2024) |
| Asset Turnover | 0.34 (2024) | 0.21 (2024) |
| Fixed Asset Turnover | 28.5 (2024) | 1.61 (2024) |
| Payout Ratio | 30.3% (2024) | 3.9% (2024) |
| Dividend Yield | 2.27% (2024) | 0.29% (2024) |
| Fiscal Year | 2024 | 2024 |
Efficiency & Valuation Duel: The Vital Signs
Financial ratios serve as a company’s DNA, unveiling operational excellence and hidden risks crucial for informed investment decisions.
W. R. Berkley Corporation
W. R. Berkley shows a strong net margin of 12.1%, indicating solid profitability. Its P/E of 15.63 suggests a fairly valued stock. The company maintains a healthy dividend yield at 2.64%, rewarding shareholders steadily. However, absent ROE and ROIC data temper the view on capital efficiency.
Loews Corporation
Loews posts a moderate net margin of 8.2% and a favorable P/E of 13.19, signaling an attractively priced stock. It boasts an exceptional ROIC of 29,880%, a rare capital efficiency signal. Dividend yield is low at 0.29%, reflecting a cautious shareholder return approach amid moderate debt levels.
Balance of Profitability and Valuation: Risk-Reward Snapshot
W. R. Berkley offers consistent profitability and shareholder income with a neutral valuation stance. Loews impresses with superior capital returns and a slightly favorable valuation but pays minimal dividends. Investors prioritizing stable income may lean toward Berkley; those seeking capital efficiency might prefer Loews.
Which one offers the Superior Shareholder Reward?
I find W. R. Berkley Corporation (WRB) offers a superior shareholder reward compared to Loews Corporation (L) in 2026. WRB delivers a robust 2.64% dividend yield with a sustainable 41% payout ratio, backed by strong free cash flow coverage near 97%. Its consistent buyback activity complements dividends, enhancing total return. Conversely, Loews yields a mere 0.29% with a very low payout ratio under 4%, favoring reinvestment over distributions. However, Loews’ free cash flow conversion is weaker at 79%, and its heavy debt load raises risks. WRB’s balanced distribution via dividends and buybacks presents a more reliable, value-creating model. I conclude WRB better aligns with long-term shareholder interests amid current market conditions.
Comparative Score Analysis: The Strategic Profile
The radar chart reveals the fundamental DNA and trade-offs of both firms, highlighting their financial strengths and vulnerabilities across key metrics:
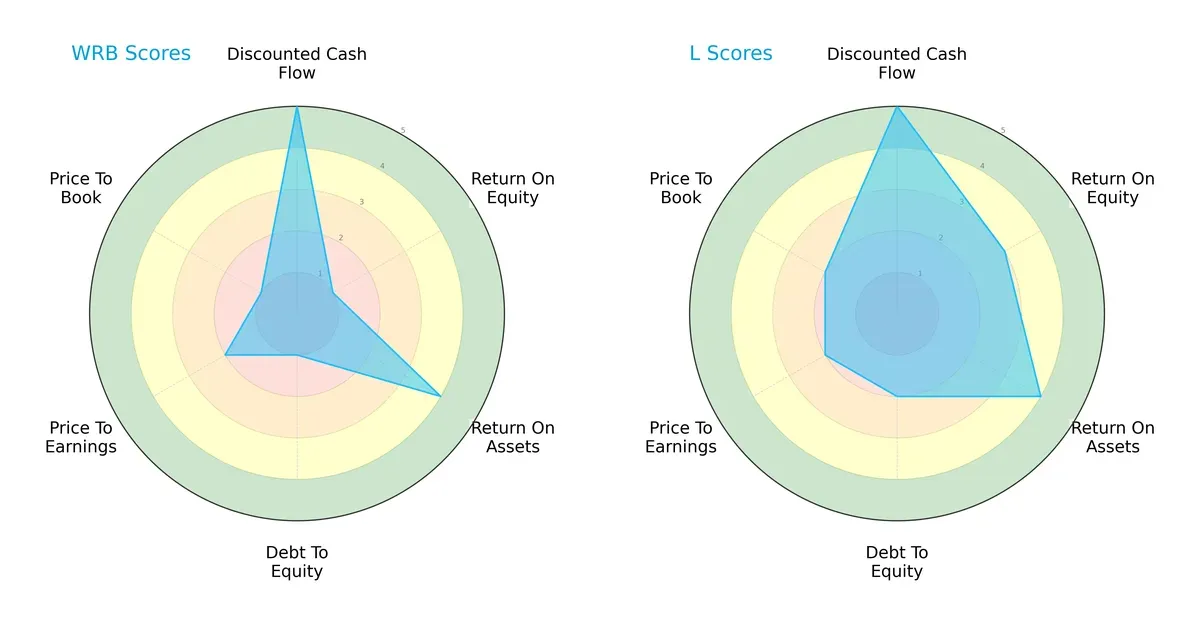
W. R. Berkley Corporation (WRB) and Loews Corporation (L) both score a maximum 5 in discounted cash flow, signaling strong valuation support. However, WRB suffers from very unfavorable return on equity and debt-to-equity scores, indicating poor shareholder returns and high leverage risk. Loews presents a more balanced profile with moderate ROE and healthier leverage metrics, making it the more stable choice despite similar ROA and valuation scores.
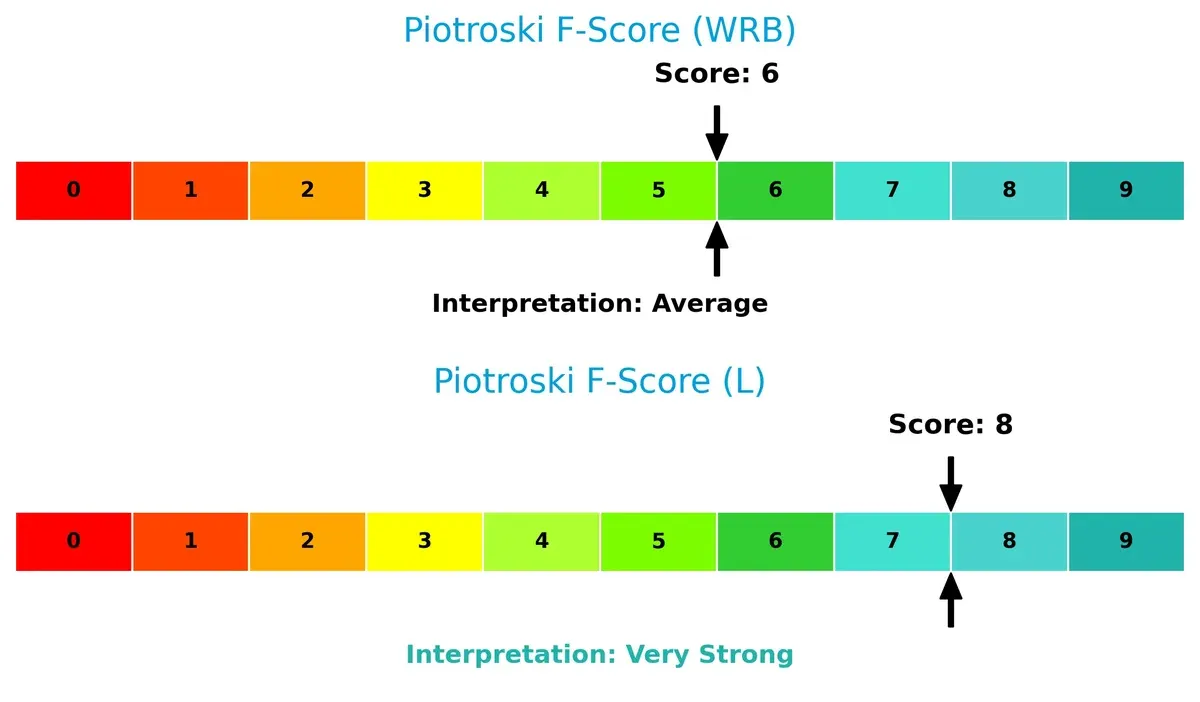
Financial Health: Quality of Operations
Loews Corporation outperforms W. R. Berkley Corporation in Piotroski F-Score, scoring 8 versus 6, reflecting stronger profitability, liquidity, and operational efficiency. WRB’s average score raises mild red flags regarding internal financial discipline compared to Loews’ very strong health:
How are the two companies positioned?
This section dissects the operational DNA of WRB and L by comparing their revenue distribution and internal dynamics. The goal is to confront their economic moats to reveal which model offers the most resilient and sustainable advantage today.
Revenue Segmentation: The Strategic Mix
The following visual comparison dissects how W. R. Berkley Corporation and Loews Corporation diversify their income streams and where their primary sector bets lie:
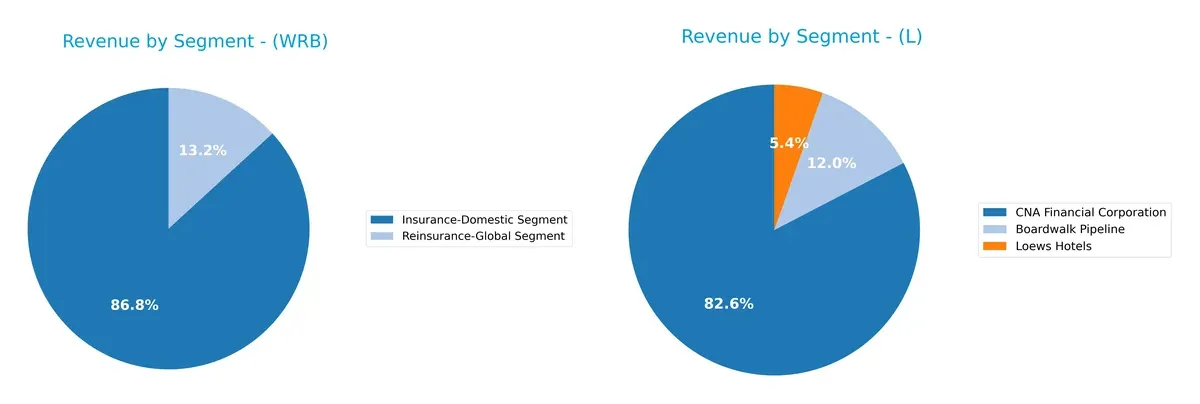
W. R. Berkley anchors its revenue heavily in the Insurance-Domestic segment, generating $11.2B in 2024, dwarfing its smaller Reinsurance-Global segment at $1.7B. This concentration signals robust domestic market dominance but exposes some concentration risk. Loews, by contrast, boasts a more diversified mix: $14.3B from CNA Financial, plus $2.1B from Boardwalk Pipeline and $933M from Loews Hotels. This diversification spreads risk across insurance, energy infrastructure, and hospitality sectors.
Strengths and Weaknesses Comparison
This table compares the Strengths and Weaknesses of W. R. Berkley Corporation and Loews Corporation:
W. R. Berkley Corporation Strengths
- Strong net margin at 12.1%
- Favorable debt-to-assets ratio
- High interest coverage at 18.95
- Consistent domestic insurance revenue growth
Loews Corporation Strengths
- Favorable ROIC at 29880%
- Positive WACC at 5.81%
- Attractive PE ratio at 13.19
- Diversified revenue from insurance, pipeline, and hotels
W. R. Berkley Corporation Weaknesses
- Unfavorable ROE and ROIC at 0%
- Poor liquidity with zero current and quick ratios
- Low asset and fixed asset turnover
- Neutral PE ratio
- Limited global presence data
Loews Corporation Weaknesses
- Lower net margin at 8.2%
- Unfavorable ROE at 8.29%
- Low dividend yield at 0.29%
- Moderate debt-to-equity ratio at 0.52
- Unfavorable liquidity ratios
Overall, W. R. Berkley shows strong profitability and debt management but struggles with liquidity and asset efficiency. Loews exhibits strong return metrics and diversification but faces challenges in margin and liquidity. Both companies present balanced profiles with distinct financial strengths and weaknesses that influence their strategic positioning.
The Moat Duel: Analyzing Competitive Defensibility
A structural moat shields long-term profits from relentless competitive erosion. Its strength determines who thrives or fades in the market:
W. R. Berkley Corporation: Intangible Asset Moat
I see Berkley’s moat rooted in specialized underwriting expertise and diversified insurance products. This supports stable margins and a favorable 12% net margin. However, absent ROIC data clouds moat durability in 2026.
Loews Corporation: Capital Efficiency Moat
Loews wields a powerful capital allocation edge, boasting ROIC vastly exceeding WACC by 29,874 bps and a soaring ROIC trend of 956%. This signals a widening moat and robust value creation potential through diversified insurance and energy assets.
Capital Efficiency vs. Intangible Expertise: The Moat Verdict
Loews’ exceptional ROIC gap and upward trend reveal a deeper, more durable moat than Berkley’s less transparent advantage. Loews is better positioned to defend market share amid intensifying competition.
Which stock offers better returns?
Over the past year, W. R. Berkley Corporation and Loews Corporation both showed bullish trends with decelerating momentum, marked by significant price gains and distinct volume dynamics.
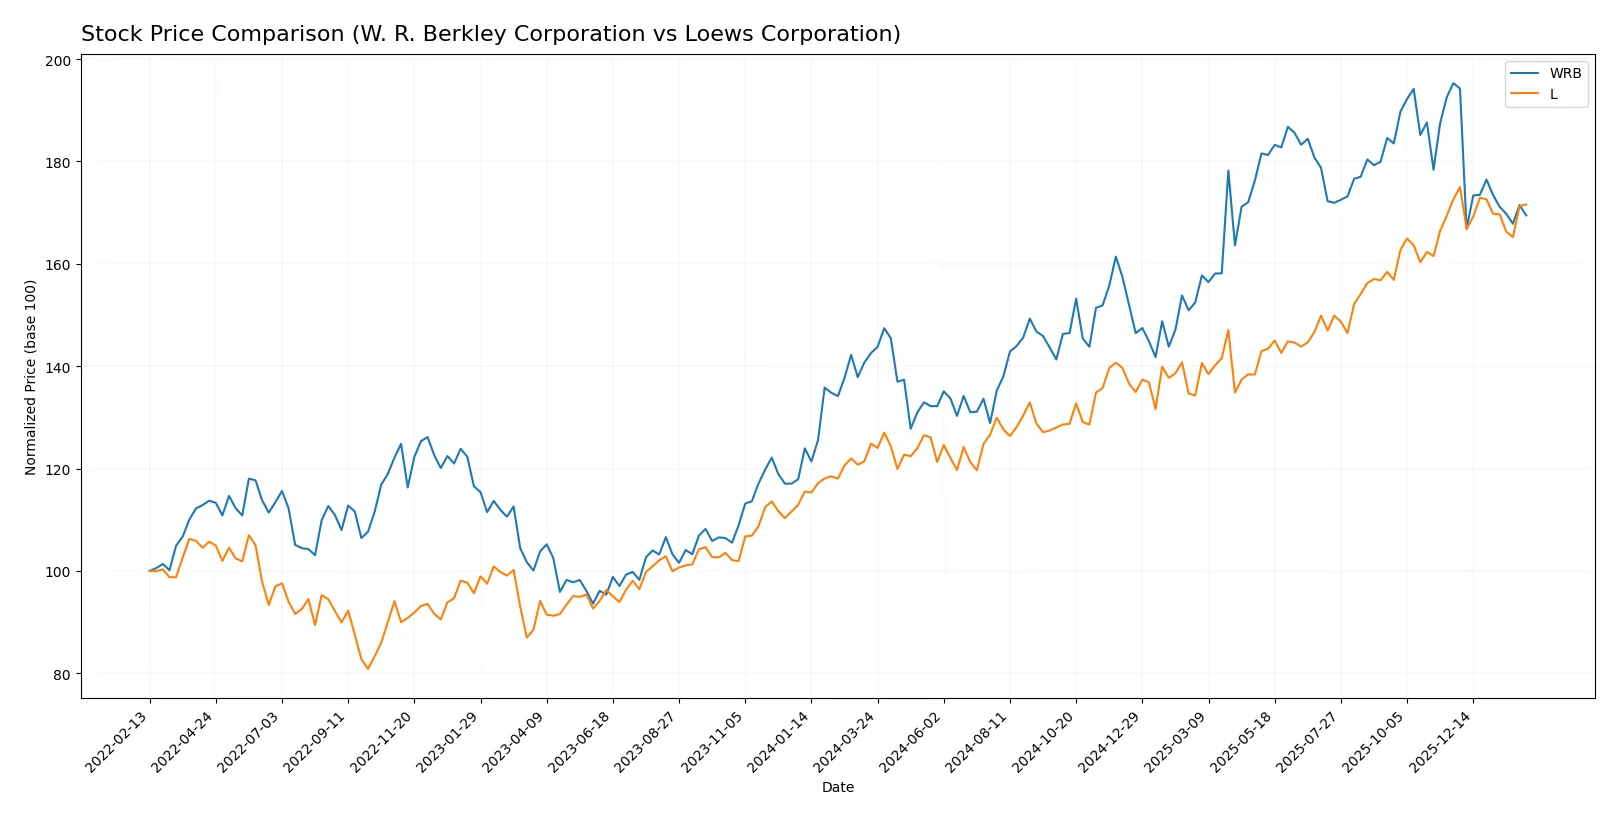
Trend Comparison
W. R. Berkley Corporation’s stock rose 18.87% over the past 12 months, showing a bullish trend with deceleration. The price ranged between 51.1 and 78.1, with recent mild downward pressure.
Loews Corporation’s stock gained 37.43% over the same period, also bullish with deceleration. It hit a high of 107.87 and low of 73.76, maintaining a nearly flat recent trend.
Loews outperformed W. R. Berkley in total returns and demonstrated stronger price appreciation despite both stocks showing slower momentum recently.
Target Prices
Analysts set a clear target consensus for W. R. Berkley Corporation, reflecting moderate upside potential.
| Company | Target Low | Target High | Consensus |
|---|---|---|---|
| W. R. Berkley Corporation | 64 | 80 | 71 |
The consensus target of $71 sits roughly 5% above the current $67.77 price, signaling modest analyst confidence. No verified target price data is available for Loews Corporation.

Don’t Let Luck Decide Your Entry Point
Optimize your entry points with our advanced ProRealTime indicators. You’ll get efficient buy signals with precise price targets for maximum performance. Start outperforming now!
How do institutions grade them?
The following tables summarize recent institutional grades for W. R. Berkley Corporation and Loews Corporation:
W. R. Berkley Corporation Grades
The table below shows the latest grades issued by recognized financial institutions for W. R. Berkley Corporation.
| Grading Company | Action | New Grade | Date |
|---|---|---|---|
| Cantor Fitzgerald | Maintain | Overweight | 2026-02-02 |
| Argus Research | Maintain | Buy | 2026-02-02 |
| Truist Securities | Maintain | Buy | 2026-01-28 |
| Jefferies | Maintain | Hold | 2026-01-27 |
| Mizuho | Maintain | Neutral | 2026-01-27 |
| B of A Securities | Maintain | Neutral | 2026-01-27 |
| Wells Fargo | Maintain | Equal Weight | 2026-01-27 |
| TD Cowen | Downgrade | Sell | 2026-01-20 |
| Cantor Fitzgerald | Maintain | Overweight | 2026-01-14 |
| Wells Fargo | Maintain | Equal Weight | 2026-01-13 |
Loews Corporation Grades
The table below presents the most recent institutional grades available for Loews Corporation.
| Grading Company | Action | New Grade | Date |
|---|---|---|---|
| RBC Capital | Maintain | Outperform | 2025-05-27 |
| Deutsche Bank | Maintain | Hold | 2018-08-01 |
| Deutsche Bank | Maintain | Hold | 2018-07-31 |
| Deutsche Bank | Maintain | Hold | 2015-11-06 |
| Deutsche Bank | Maintain | Hold | 2015-11-05 |
| JP Morgan | Maintain | Hold | 2014-08-08 |
| JP Morgan | Maintain | Hold | 2014-08-07 |
| Deutsche Bank | Downgrade | Hold | 2014-03-24 |
| Deutsche Bank | Downgrade | Hold | 2014-03-23 |
| Deutsche Bank | Maintain | Buy | 2013-09-04 |
Which company has the best grades?
W. R. Berkley Corporation has more recent and generally more positive grades, including multiple Buy and Overweight ratings. Loews Corporation’s latest grade is Outperform but dates back to mid-2025, with many older Hold ratings. Investors may view Berkley’s current favorable assessments as a sign of stronger near-term confidence.
Risks specific to each company
The following categories identify the critical pressure points and systemic threats facing both firms in the 2026 market environment:
1. Market & Competition
W. R. Berkley Corporation
- Strong niche in specialty commercial insurance, but faces stiff competition in property & casualty markets.
Loews Corporation
- Diversified insurance portfolio plus energy and manufacturing segments, but competitive pressures in insurance persist.
2. Capital Structure & Debt
W. R. Berkley Corporation
- Favorable debt metrics with low leverage and high interest coverage ratio of 18.95, indicating strong financial stability.
Loews Corporation
- Moderate leverage at 0.52 debt/equity ratio; interest coverage at 5.25 is adequate but less robust than WRB’s.
3. Stock Volatility
W. R. Berkley Corporation
- Low beta at 0.36 signals defensive stock behavior with limited volatility against market swings.
Loews Corporation
- Higher beta of 0.605 implies more price variability and market sensitivity than WRB.
4. Regulatory & Legal
W. R. Berkley Corporation
- Subject to complex regulations in US and international insurance markets; regulatory compliance costs persist.
Loews Corporation
- Faces similar regulatory risks in insurance; additional scrutiny possible in energy and manufacturing operations.
5. Supply Chain & Operations
W. R. Berkley Corporation
- Insurance underwriting less dependent on physical supply chains; operational risks mainly in risk assessment accuracy.
Loews Corporation
- More exposed to physical supply chain disruptions due to energy pipelines, manufacturing plastics, and hotel operations.
6. ESG & Climate Transition
W. R. Berkley Corporation
- Increasing pressure to manage climate risk underwriting and invest in sustainable insurance products.
Loews Corporation
- Greater ESG risk from energy sector exposure; transition risks from fossil fuels and regulatory changes.
7. Geopolitical Exposure
W. R. Berkley Corporation
- Moderate international operations expose it to geopolitical risks in global markets.
Loews Corporation
- Higher geopolitical risk due to energy infrastructure across multiple US states and international insurance markets.
Which company shows a better risk-adjusted profile?
W. R. Berkley faces its biggest risk in regulatory complexity but benefits from a conservative capital structure and low stock volatility. Loews carries material risks from its energy and manufacturing businesses, alongside elevated leverage and market sensitivity. WRB’s low beta and strong interest coverage indicate a safer risk profile. Meanwhile, Loews’ distress-level Altman Z-Score signals financial vulnerability despite strong Piotroski strength. WRB’s niche focus and financial conservatism provide better risk-adjusted stability in today’s volatile 2026 environment.
Final Verdict: Which stock to choose?
W. R. Berkley Corporation’s superpower lies in its strong earnings quality and favorable net margins, making it a reliable cash generator. Its point of vigilance is the lack of disclosed ROIC data, which clouds clarity on capital efficiency. This stock suits an aggressive growth portfolio seeking steady income streams.
Loews Corporation boasts a very favorable moat with a ROIC vastly exceeding its cost of capital, signaling durable competitive advantage. Its strategic strength is efficient capital allocation and value creation, though its higher debt level suggests moderate risk. It fits well within a GARP portfolio balancing growth and valuation discipline.
If you prioritize consistent cash generation with a focus on earnings quality, W. R. Berkley appears compelling despite limited ROIC transparency. However, if you seek durable competitive advantage and value creation with reasonable risk, Loews offers better stability and a stronger moat, commanding a premium for its sustainable profitability.
Disclaimer: Investment carries a risk of loss of initial capital. The past performance is not a reliable indicator of future results. Be sure to understand risks before making an investment decision.
Go Further
I encourage you to read the complete analyses of W. R. Berkley Corporation and Loews Corporation to enhance your investment decisions: