Home > Comparison > Financial Services > ALL vs L
The strategic rivalry between The Allstate Corporation and Loews Corporation shapes the competitive landscape of the property and casualty insurance industry. Allstate operates as a diversified insurer with broad personal and commercial lines, while Loews blends specialty insurance with diversified industrial assets. This analysis pits Allstate’s scale and focus against Loews’ multi-industry model to identify which offers superior risk-adjusted returns for a balanced portfolio.

Table of contents
Companies Overview
The Allstate Corporation and Loews Corporation remain pivotal players in the US property and casualty insurance market.
The Allstate Corporation: Leading US Personal Lines Insurer
The Allstate Corporation commands a strong position in property and casualty insurance across the US and Canada. Its core revenue stems from auto, homeowners, and specialty insurance products under multiple brands. In 2026, Allstate emphasizes expanding its Protection Services segment, integrating automotive telematics, roadside assistance, and identity protection to broaden its competitive moat.
Loews Corporation: Diversified Commercial Insurance & Energy Player
Loews Corporation focuses largely on commercial property and casualty insurance with specialty lines like management liability and surety bonds. Besides insurance, it operates extensive natural gas pipelines and a hotel chain. In 2026, Loews drives growth through its energy infrastructure and risk management services, diversifying beyond insurance to stabilize cash flows.
Strategic Collision: Similarities & Divergences
Both firms compete in property and casualty insurance but with distinct approaches—Allstate targets personal lines and tech-enabled services, while Loews emphasizes commercial insurance and energy infrastructure. Their primary battleground is risk diversification and customer reach. Investors face contrasting profiles: Allstate offers scale and innovation in consumer insurance; Loews blends insurance with capital-intensive energy assets.
Income Statement Comparison
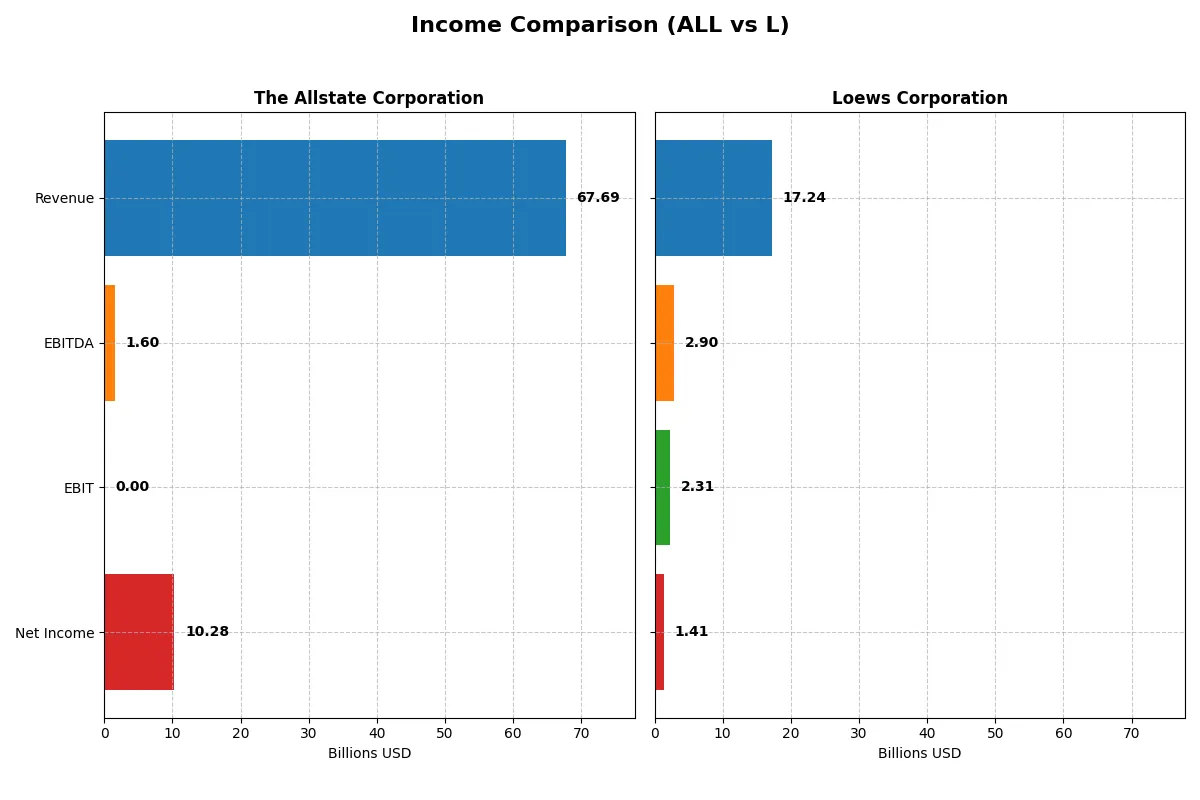
This data dissects the core profitability and scalability of both corporate engines to reveal who dominates the bottom line:
| Metric | The Allstate Corporation (ALL) | Loews Corporation (L) |
|---|---|---|
| Revenue | 67.7B | 17.2B |
| Cost of Revenue | 0 | 9.5B |
| Operating Expenses | 0 | 5.8B |
| Gross Profit | 0 | 7.7B |
| EBITDA | 1.6B | 2.9B |
| EBIT | 0 | 2.3B |
| Interest Expense | 399M | 441M |
| Net Income | 10.3B | 1.4B |
| EPS | 38.56 | 6.42 |
| Fiscal Year | 2025 | 2024 |
Income Statement Analysis: The Bottom-Line Duel
This income statement comparison reveals how efficiently each company converts revenue into profit, exposing the strength of their business engines.
The Allstate Corporation Analysis
Allstate’s revenue rose steadily from $48.7B in 2021 to $67.7B in 2025, with net income surging from $1.5B to $10.3B over the same period. Despite zero reported gross profit in 2025, Allstate’s net margin improved sharply to 15.2%, reflecting strong cost management and significant non-operating income gains. The 2025 net income growth signals robust momentum.
Loews Corporation Analysis
Loews grew revenue from $13.7B in 2021 to $17.2B in 2024, with net income expanding from $1.56B to $1.41B. Gross margin remains healthy at 44.7%, but net margin slipped to 8.2% in 2024, largely due to rising operating expenses. Although revenue and gross profit grew favorably, recent declines in EBIT and net margin hint at some efficiency challenges.
Margin Dominance vs. Growth Strength
Allstate outpaces Loews in net income growth and margin expansion, achieving a powerful bottom-line leap despite mixed gross profit trends. Loews maintains stronger gross margins but struggles with margin contraction and slower profit growth. For investors, Allstate’s profile offers compelling earnings momentum, while Loews presents steadier but less dynamic profitability.
Financial Ratios Comparison
These vital ratios act as a diagnostic tool to expose the underlying fiscal health, valuation premiums, and capital efficiency of each company:
| Ratios | The Allstate Corporation (ALL) | Loews Corporation (L) |
|---|---|---|
| ROE | 21.77% | 8.29% |
| ROIC | 4.12% | 298.80% |
| P/E | 10.92 | 13.19 |
| P/B | 2.38 | 1.09 |
| Current Ratio | N/A | N/A |
| Quick Ratio | N/A | N/A |
| D/E | 0.38 | 0.52 |
| Debt-to-Assets | 7.24% | 10.91% |
| Interest Coverage | 14.40 | 4.25 |
| Asset Turnover | 0.57 | 0.21 |
| Fixed Asset Turnover | 94.94 | 1.61 |
| Payout ratio | 23.12% | 3.89% |
| Dividend yield | 2.12% | 0.29% |
| Fiscal Year | 2024 | 2024 |
Efficiency & Valuation Duel: The Vital Signs
Financial ratios act as a company’s DNA, exposing hidden risks and operational strengths critical to investment decisions.
The Allstate Corporation
Allstate posts a robust ROE of 21.77%, signaling efficient equity use, while net margin remains neutral at 7.35%. Its P/E ratio at 10.92 indicates a favorable valuation, not stretched. The company supports shareholders with a solid 2.12% dividend yield, reflecting steady cash returns rather than aggressive reinvestment.
Loews Corporation
Loews displays moderate profitability with an 8.29% ROE and a neutral net margin of 8.2%. Its P/E of 13.19 is fair, while an exceptional ROIC of 29,880% suggests strong capital efficiency. However, dividend yield is low at 0.29%, implying a focus on growth or internal capital deployment over distributions.
Valuation Balance vs. Capital Efficiency
Both companies show slightly favorable ratio profiles, but Allstate offers stronger shareholder returns through dividends and a more attractive P/E. Loews impresses with extraordinary ROIC but falls short in dividend yield and asset turnover. Investors seeking income may prefer Allstate, while growth-oriented investors might lean toward Loews.
Which one offers the Superior Shareholder Reward?
I see Allstate (ALL) delivers a 2.12% dividend yield with a moderate 23% payout ratio and strong free cash flow coverage near 98%. Its buybacks are consistent, enhancing total returns sustainably. Loews (L) offers a tiny 0.29% yield and a minimal 4% payout ratio, focusing on reinvestment and modest buybacks. I prefer Allstate’s balanced dividend and buyback approach for a superior 2026 shareholder reward.
Comparative Score Analysis: The Strategic Profile
The radar chart reveals the fundamental DNA and trade-offs of The Allstate Corporation and Loews Corporation, highlighting their financial strengths and valuation nuances:
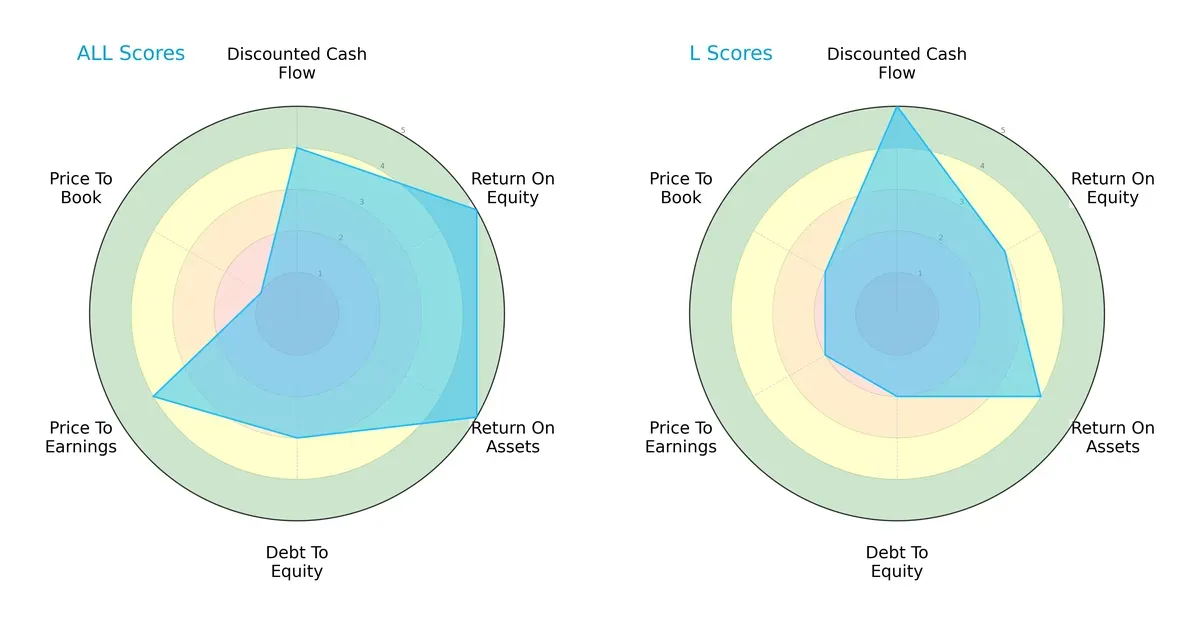
The Allstate Corporation presents a more balanced profile with solid DCF (4), very favorable ROE (5) and ROA (5), and decent debt management (3). However, its very unfavorable Price-to-Book score (1) signals potential overvaluation or asset concerns. Loews Corporation relies on a strong DCF score (5) but lags in ROE (3) and P/E (2), indicating weaker profitability and valuation appeal. Loews shows better Price-to-Book stability (2) but carries higher financial risk with a lower debt score (2). Overall, Allstate demonstrates operational efficiency, while Loews depends more on cash flow strength.
Bankruptcy Risk: Solvency Showdown
The Allstate Corporation (Z=1.47) and Loews Corporation (Z=1.03) both fall into the distress zone, warning investors of elevated bankruptcy risk in this cycle:
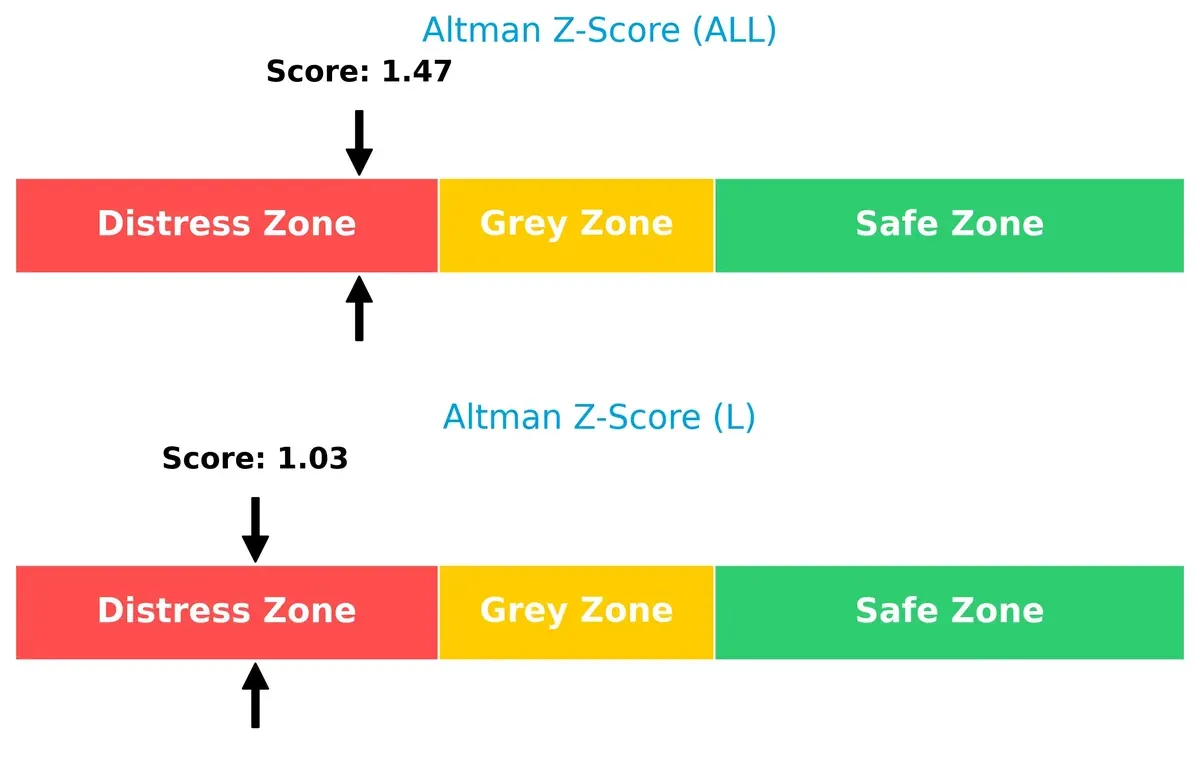
Both companies show vulnerability to financial distress, with Loews slightly more at risk. Given this, caution is essential when considering long-term exposure, especially amid economic uncertainties.
Financial Health: Quality of Operations
Loews Corporation scores an 8, indicating very strong financial health, while The Allstate Corporation scores 7, signaling strong but slightly weaker internal metrics:
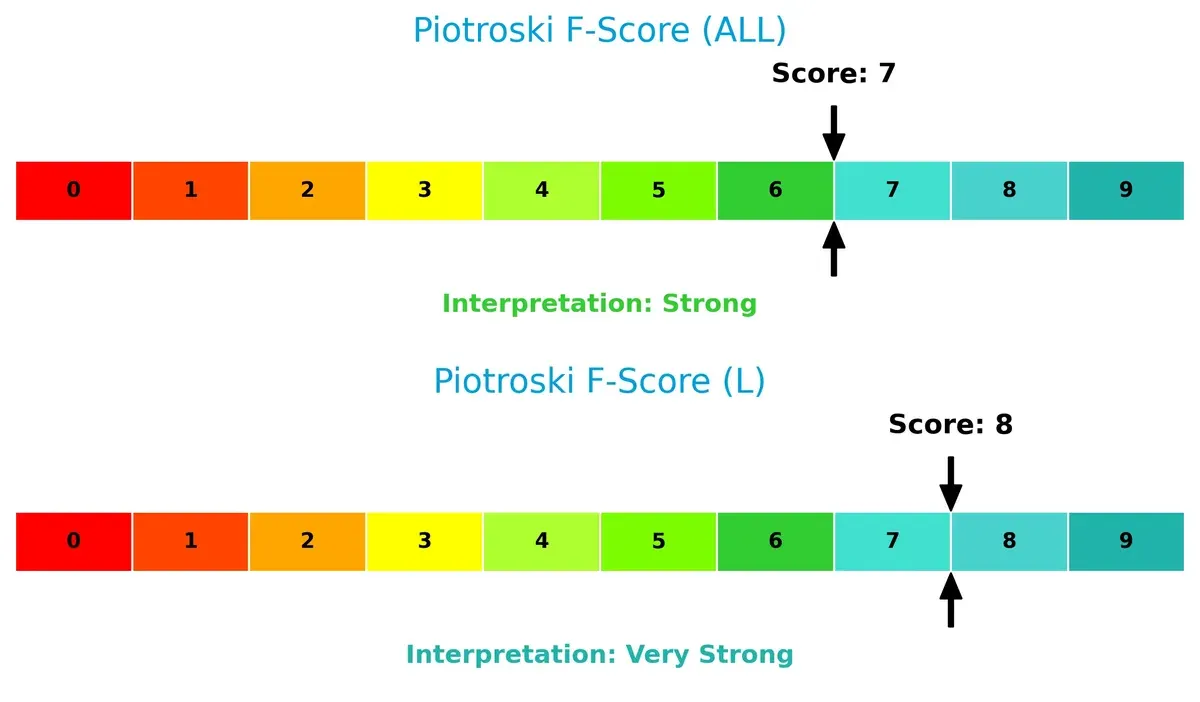
Loews edges ahead in operational quality and balance sheet strength. Allstate’s slightly lower Piotroski score suggests some red flags in profitability or efficiency metrics that investors should monitor closely.
How are the two companies positioned?
This section dissects the operational DNA of ALL and L by comparing their revenue distribution and internal dynamics—strengths and weaknesses. The goal is to confront their economic moats and identify which offers the most resilient, sustainable competitive advantage today.
Revenue Segmentation: The Strategic Mix
This visual comparison dissects how The Allstate Corporation and Loews Corporation diversify their income streams and where their primary sector bets lie:
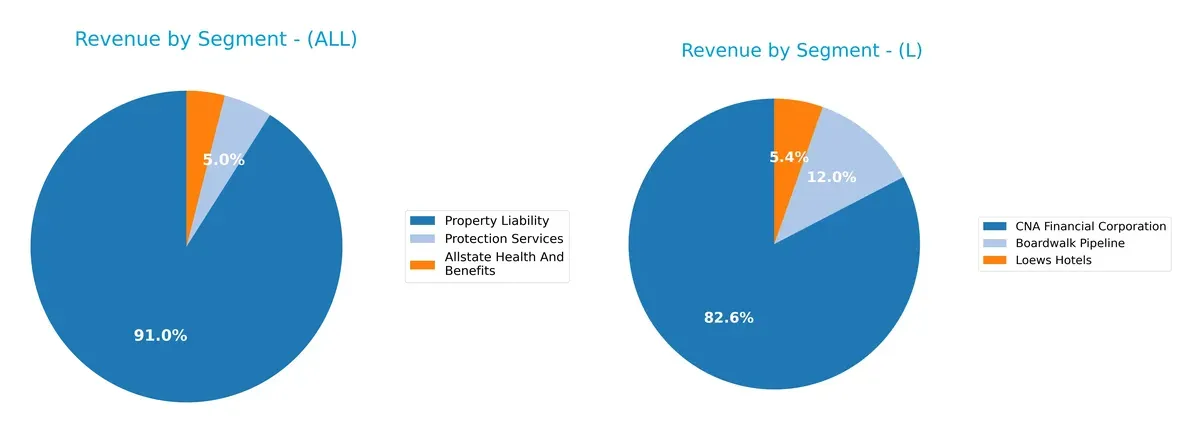
Allstate heavily anchors its revenue in Property Liability with $58.3B in 2024, dwarfing other segments like Protection Services ($3.2B) and Health and Benefits ($2.5B). Loews shows a more balanced mix, with CNA Financial Corporation dominating at $14.3B, but meaningful contributions also come from Boardwalk Pipeline ($2.1B) and Loews Hotels ($933M). Allstate’s concentration signals potential sector risk, while Loews’s diversification offers a cushion through infrastructure and hospitality exposure.
Strengths and Weaknesses Comparison
This table compares the strengths and weaknesses of The Allstate Corporation (ALL) and Loews Corporation (L):
ALL Strengths
- Diversified insurance segments with Property Liability at $58B and health benefits
- Strong ROE at 21.77% signals profitable shareholder returns
- Favorable debt ratios with debt-to-assets at 7.24%
- High fixed asset turnover of 94.94 indicates efficient asset use
- Dividend yield of 2.12% supports income investors
L Strengths
- Diversified revenue from CNA Financial, Boardwalk Pipeline, and Loews Hotels
- Extremely favorable ROIC at 29,880% shows superior capital efficiency
- Favorable WACC at 5.83% supports value creation
- Solid interest coverage at 5.25 times indicates manageable debt costs
- Favorable price-to-book at 1.09 suggests reasonable valuation
ALL Weaknesses
- Unfavorable liquidity with current and quick ratios at 0, a red flag for short-term solvency
- ROIC of 4.12% below expectations raises concerns on capital returns
- Interest coverage at 0.0 indicates vulnerability to debt servicing
- Neutral net margin at 7.35% suggests moderate profitability
- PB ratio at 2.38 is neutral, offering limited valuation edge
L Weaknesses
- Lower ROE at 8.29% reflects weaker profitability for shareholders
- Unfavorable asset turnover at 0.21 signals less efficient asset utilization
- Dividend yield at 0.29% is unattractive for income-focused investors
- Debt-to-equity at 0.52 is neutral, not a clear strength
- Neutral fixed asset turnover at 1.61 limits operational advantage
The Allstate Corporation leverages strong profitability and efficient asset use but faces liquidity concerns. Loews excels in capital efficiency and debt management but shows weaker shareholder returns and operational efficiency. These contrasts shape each company’s strategic focus on balancing growth, profitability, and financial stability.
The Moat Duel: Analyzing Competitive Defensibility
A structural moat is the only thing protecting long-term profits from the erosion of competition. Let’s dissect the competitive moats of two insurers:
The Allstate Corporation: Brand and Distribution Network Moat
Allstate leverages a strong brand and extensive agent network, reflected in stable net margins around 15%. However, its declining ROIC trend signals pressure on capital efficiency in 2026.
Loews Corporation: Capital Efficiency and Diversified Asset Moat
Loews excels with a rising ROIC vastly exceeding WACC, showing superior capital allocation. Its diverse insurance and energy assets fuel growth and deepen its competitive edge through 2026.
Brand Strength vs. Capital Mastery: The Moat Showdown
Loews commands a deeper moat with a very favorable ROIC trend and value creation, outpacing Allstate’s eroding capital returns. Loews stands better poised to defend and expand its market share.
Which stock offers better returns?
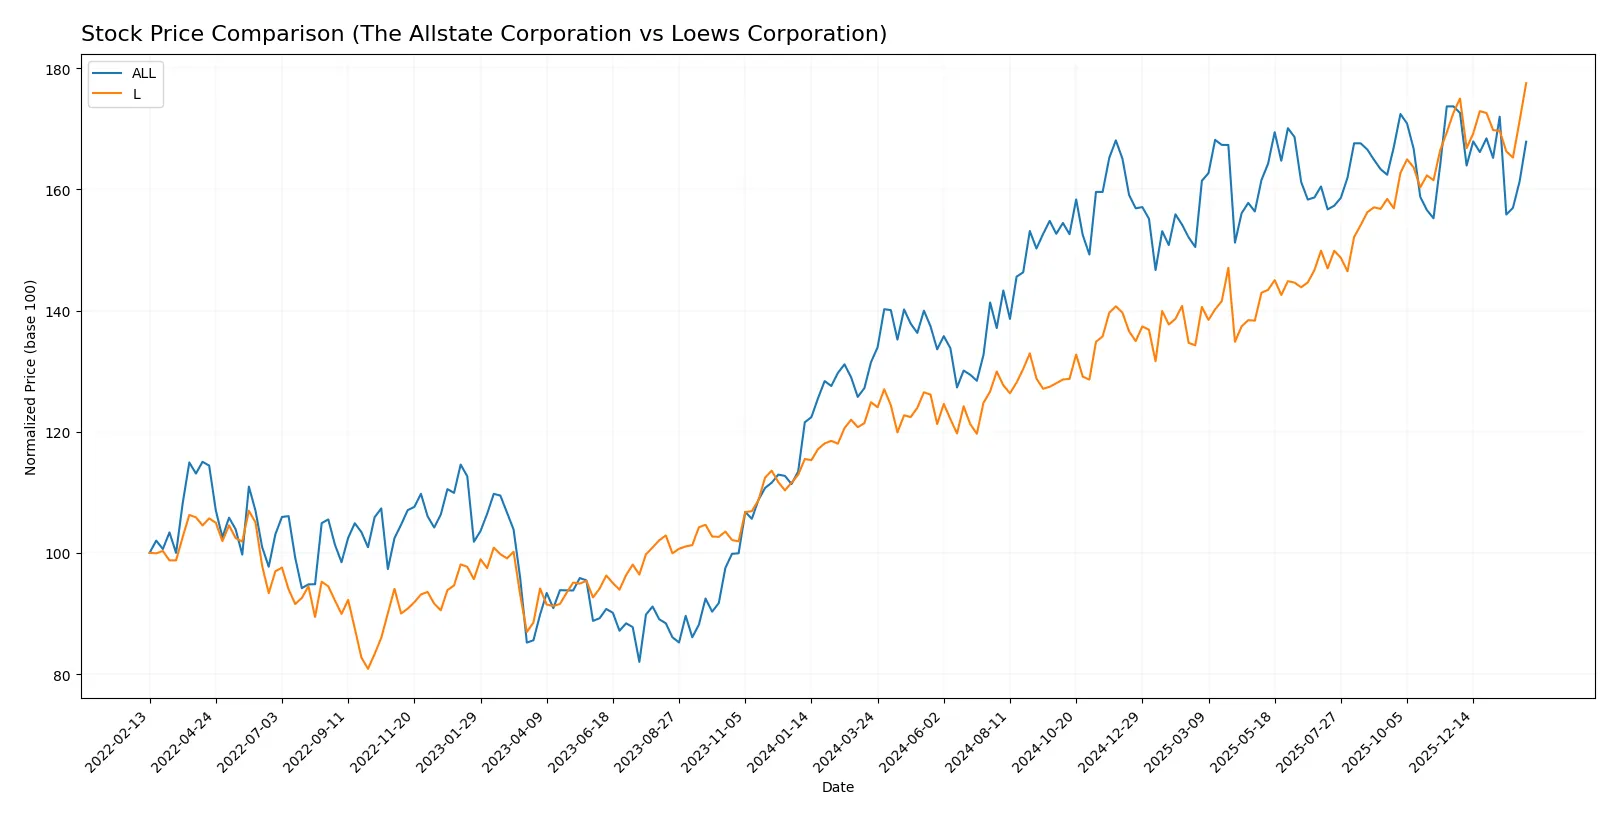
The past year reveals marked gains for both stocks, with Loews Corporation showing stronger overall growth despite recent stabilization. The Allstate Corporation experienced a decelerating rally but faced slight short-term weakness.
Trend Comparison
The Allstate Corporation’s stock rose 27.7% over the past 12 months, confirming a bullish trend with decelerating momentum. Its price fluctuated between $157.07 and $214.32, showing moderate volatility.
Loews Corporation’s stock climbed 42.2% during the same period, also bullish but with slowing acceleration. Price ranged from $73.76 to $109.43, accompanied by lower volatility than Allstate.
Loews outperformed Allstate in total returns, delivering the highest market gains despite a recent plateau, signaling stronger investor confidence over the year.
Target Prices
Analysts show a bullish consensus for The Allstate Corporation with a target price range signaling upside potential.
| Company | Target Low | Target High | Consensus |
|---|---|---|---|
| The Allstate Corporation | 215 | 255 | 233.57 |
The target consensus of 233.57 implies a 13% upside from the current price of 207.12. No verified target price data is available for Loews Corporation.

Don’t Let Luck Decide Your Entry Point
Optimize your entry points with our advanced ProRealTime indicators. You’ll get efficient buy signals with precise price targets for maximum performance. Start outperforming now!
How do institutions grade them?
The Allstate Corporation Grades
Here are the recent grades from established financial institutions for Allstate:
| Grading Company | Action | New Grade | Date |
|---|---|---|---|
| Wells Fargo | Maintain | Equal Weight | 2026-01-13 |
| TD Cowen | Downgrade | Hold | 2026-01-12 |
| Keefe, Bruyette & Woods | Maintain | Outperform | 2026-01-06 |
| William Blair | Downgrade | Market Perform | 2025-12-18 |
| Morgan Stanley | Downgrade | Equal Weight | 2025-12-16 |
| Roth Capital | Maintain | Buy | 2025-11-26 |
| Keefe, Bruyette & Woods | Maintain | Outperform | 2025-11-11 |
| UBS | Maintain | Buy | 2025-11-10 |
| Wells Fargo | Maintain | Equal Weight | 2025-11-07 |
| BMO Capital | Maintain | Outperform | 2025-11-07 |
Loews Corporation Grades
Here are the available grades from established financial institutions for Loews:
| Grading Company | Action | New Grade | Date |
|---|---|---|---|
| RBC Capital | Maintain | Outperform | 2025-05-27 |
| Deutsche Bank | Maintain | Hold | 2018-08-01 |
| Deutsche Bank | Maintain | Hold | 2018-07-31 |
| Deutsche Bank | Maintain | Hold | 2015-11-06 |
| Deutsche Bank | Maintain | Hold | 2015-11-05 |
| JP Morgan | Maintain | Hold | 2014-08-08 |
| JP Morgan | Maintain | Hold | 2014-08-07 |
| Deutsche Bank | Downgrade | Hold | 2014-03-24 |
| Deutsche Bank | Downgrade | Hold | 2014-03-23 |
| Deutsche Bank | Maintain | Buy | 2013-09-04 |
Which company has the best grades?
The Allstate Corporation holds more recent and generally stronger grades, including multiple Outperform ratings. Loews Corporation’s latest grades are older and mostly Hold. Investors may view Allstate’s current institutional confidence as more favorable.
Risks specific to each company
The following categories identify the critical pressure points and systemic threats facing both firms in the 2026 market environment:
1. Market & Competition
The Allstate Corporation
- Faces intense competition in personal and commercial insurance markets across US and Canada.
Loews Corporation
- Competes in specialty insurance and diverse industries including energy and manufacturing, increasing complexity.
2. Capital Structure & Debt
The Allstate Corporation
- Maintains moderate leverage with debt-to-equity at 0.38, favorable but interest coverage is zero, a red flag.
Loews Corporation
- Higher debt-to-equity at 0.52 with solid interest coverage at 5.25, indicating manageable debt costs.
3. Stock Volatility
The Allstate Corporation
- Low beta at 0.235 signals limited stock volatility, appealing for risk-averse investors.
Loews Corporation
- Beta of 0.605 shows moderate volatility, suggesting higher market sensitivity.
4. Regulatory & Legal
The Allstate Corporation
- Operates in heavily regulated insurance and health benefits sectors, exposing it to regulatory shifts.
Loews Corporation
- Subject to insurance and pipeline transportation regulations, complicating compliance across jurisdictions.
5. Supply Chain & Operations
The Allstate Corporation
- Relies on multi-channel distribution for insurance, vulnerable to technology disruptions and partner risks.
Loews Corporation
- Faces operational complexity with pipelines, hospitality, and plastics manufacturing, increasing supply chain risks.
6. ESG & Climate Transition
The Allstate Corporation
- Insurance underwriting exposed to climate risk; must adapt to rising natural disaster claims.
Loews Corporation
- Energy pipeline operations face transition risks amid decarbonization, requiring capital reallocation.
7. Geopolitical Exposure
The Allstate Corporation
- Primarily US and Canada exposure limits geopolitical risk but sensitive to North American policy changes.
Loews Corporation
- International insurance and energy assets increase exposure to geopolitical and trade uncertainties.
Which company shows a better risk-adjusted profile?
The Allstate Corporation’s most impactful risk is its zero interest coverage ratio, signaling potential financial strain despite moderate leverage. Loews faces its greatest risk from operational complexity and geopolitical exposure due to diversified industries. Despite both in distress zones per Altman Z-scores, Loews’ stronger Piotroski score and better interest coverage indicate a slightly better risk-adjusted profile. The Allstate’s zero interest coverage amid favorable debt ratios highlights a critical liquidity concern I find worrisome.
Final Verdict: Which stock to choose?
The Allstate Corporation’s superpower lies in its ability to generate strong returns on equity and deliver consistent free cash flow, reflecting operational efficiency and shareholder value creation. Its point of vigilance is the absence of liquidity ratios, which suggests caution around short-term solvency. It suits aggressive growth portfolios seeking robust earnings momentum.
Loews Corporation commands a strategic moat through its impressive return on invested capital, far exceeding its cost of capital, indicating sustained value creation. It offers a safer profile with lower volatility and a solid balance sheet compared to Allstate. Loews fits well within GARP portfolios that balance growth with financial stability.
If you prioritize aggressive growth and operational efficiency, Allstate is the compelling choice due to its strong equity returns and cash flow generation. However, if you seek durable competitive advantage and better stability, Loews offers superior value creation supported by a very favorable economic moat. Both present slightly favorable financial profiles but cater to distinct investor strategies.
Disclaimer: Investment carries a risk of loss of initial capital. The past performance is not a reliable indicator of future results. Be sure to understand risks before making an investment decision.
Go Further
I encourage you to read the complete analyses of The Allstate Corporation and Loews Corporation to enhance your investment decisions: