Home > Comparison > Industrials > LMT vs TXT
The strategic rivalry between Lockheed Martin Corporation and Textron Inc. shapes the aerospace and defense landscape. Lockheed Martin operates as a capital-intensive aerospace and defense powerhouse with a broad portfolio spanning advanced missile systems to space technologies. Textron, by contrast, combines aerospace manufacturing with diversified industrial and finance businesses. This analysis compares their strategic trajectories to identify which firm offers superior risk-adjusted returns for a balanced industrials portfolio.
Table of contents
Companies Overview
Lockheed Martin and Textron stand as major players shaping the aerospace and defense landscape in 2026.
Lockheed Martin Corporation: Aerospace & Defense Powerhouse
Lockheed Martin dominates as a global leader in aerospace and defense technology. Its revenue stems from advanced systems across aeronautics, missiles, rotary and mission systems, and space segments. For 2026, Lockheed focuses on integrating cutting-edge space and missile defense solutions, reinforcing its position as a critical supplier to the U.S. government and allied military forces.
Textron Inc.: Diversified Industrial & Defense Manufacturer
Textron operates as a multifaceted industrial and aerospace company with strong footholds in aviation, defense, and finance. It generates revenue through business jets, military helicopters, unmanned systems, and industrial products. In 2026, Textron prioritizes expanding its aircraft and defense capabilities alongside growing its finance segment to support equipment sales worldwide.
Strategic Collision: Similarities & Divergences
Both companies compete fiercely in aerospace and defense but differ strategically. Lockheed Martin emphasizes a high-tech integrated systems approach with heavy government contracting, while Textron pursues a diversified portfolio blending commercial aviation, defense, and industrial products. Their primary battleground lies in military aviation and defense systems. This contrast defines Lockheed as a focused defense giant, while Textron presents a broader industrial play with exposure to commercial markets.
Income Statement Comparison
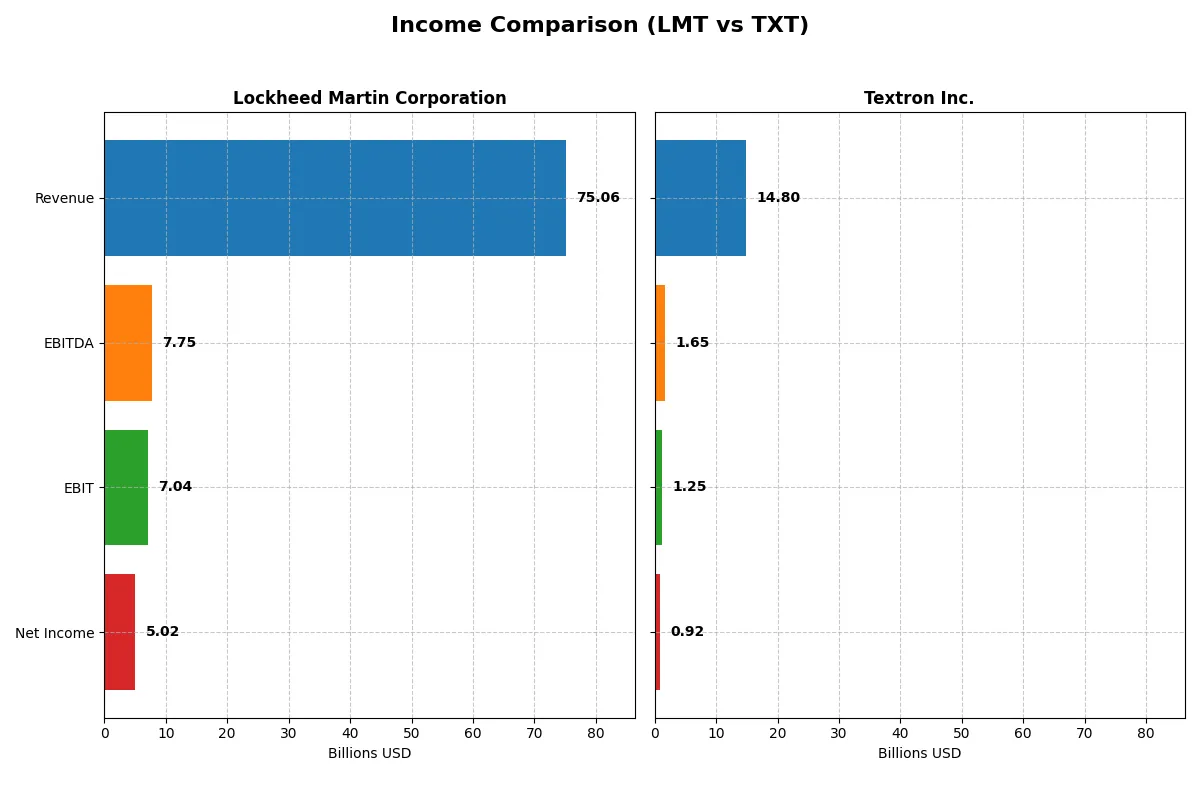
This data dissects the core profitability and scalability of both corporate engines to reveal who dominates the bottom line:
| Metric | Lockheed Martin (LMT) | Textron (TXT) |
|---|---|---|
| Revenue | 75.1B | 14.8B |
| Cost of Revenue | 67.4B | 12.3B |
| Operating Expenses | -103M | 1.25B |
| Gross Profit | 7.6B | 2.5B |
| EBITDA | 7.8B | 1.6B |
| EBIT | 7.0B | 1.2B |
| Interest Expense | 1.12B | 97M |
| Net Income | 5.0B | 921M |
| EPS | 21.56 | 5.11 |
| Fiscal Year | 2025 | 2025 |
Income Statement Analysis: The Bottom-Line Duel
This income statement comparison reveals which company runs a more efficient and profitable corporate engine through recent financial performance.
Lockheed Martin Corporation Analysis
Lockheed Martin’s revenue climbed steadily from $67.6B in 2023 to $75.1B in 2025, reflecting moderate 5.7% growth last year. Gross margins hovered near 10%, signaling tight cost control but limited pricing power. Net income slid from $6.9B in 2023 to $5.0B in 2025, driven by shrinking net margins and a 3% EBIT decline, indicating margin pressure despite rising sales.
Textron Inc. Analysis
Textron boosted revenues from $13.7B in 2023 to $14.8B in 2025, with an 8% jump last year showing solid top-line momentum. Gross margin held steady around 17%, delivering healthy profitability. Net income rose 12% to $921M in 2025, supported by a 20% EBIT surge and stable net margins just above 6%, underscoring improving operational efficiency and earnings growth.
Margin Discipline vs. Growth Momentum
Lockheed Martin impresses with scale and solid cost discipline but suffers from declining profitability and earnings. Textron, though smaller, delivers stronger revenue and net income growth with expanding EBIT margins. For investors prioritizing growth and improving margins, Textron’s profile currently presents a more attractive earnings momentum.
Financial Ratios Comparison
These vital ratios act as a diagnostic tool to expose the underlying fiscal health, valuation premiums, and capital efficiency for Lockheed Martin Corporation (LMT) and Textron Inc. (TXT):
| Ratios | Lockheed Martin (LMT) | Textron (TXT) |
|---|---|---|
| ROE | 74.6% | 11.7% |
| ROIC | 17.4% | 9.4% |
| P/E | 22.3 | 17.0 |
| P/B | 16.6 | 2.0 |
| Current Ratio | 1.09 | 5.94 |
| Quick Ratio | 0.94 | 2.33 |
| D/E (Debt-to-Equity) | 0.17 | 0.45 |
| Debt-to-Assets | 2.0% | 19.5% |
| Interest Coverage | 6.9 | 12.9 |
| Asset Turnover | 1.25 | 0.82 |
| Fixed Asset Turnover | 8.46 | 5.71 |
| Payout Ratio | 62.4% | 2.1% |
| Dividend Yield | 2.80% | 0.12% |
| Fiscal Year | 2025 | 2025 |
Efficiency & Valuation Duel: The Vital Signs
Ratios serve as the company’s DNA, revealing hidden risks and operational excellence essential for evaluating investment quality.
Lockheed Martin Corporation
Lockheed Martin delivers robust profitability with a 74.65% ROE and 6.68% net margin, signaling operational strength. Its P/E of 22.26 suggests a fairly valued stock, though a high P/B at 16.62 is less favorable. The company rewards shareholders with a 2.8% dividend yield, reflecting steady income alongside solid capital allocation.
Textron Inc.
Textron shows modest profitability, with an 11.7% ROE and 6.22% net margin, indicating moderate operational efficiency. Its P/E of 17.04 is reasonable, and a low P/B of 1.99 points to a fairly priced stock. Dividend yield is minimal at 0.12%, implying reinvestment focuses on growth rather than income distribution.
Premium Valuation vs. Operational Safety
Lockheed Martin offers superior profitability and a favorable capital structure, balancing valuation with shareholder returns. Textron presents a more conservative valuation but lower profitability and dividend yield. Investors seeking operational strength and income may prefer Lockheed Martin’s profile, while Textron suits those favoring modest valuation and growth potential.
Which one offers the Superior Shareholder Reward?
Lockheed Martin pays a robust 2.8% dividend yield with a 62% payout ratio, supported by strong free cash flow coverage (80%). Its buyback program is substantial, boosting shareholder returns. Textron, in contrast, pays a negligible 0.12% yield with a 2% payout ratio, focusing on reinvestment and modest buybacks. I find Lockheed Martin’s balanced cash return and buyback strategy more sustainable and attractive for total returns in 2026.
Comparative Score Analysis: The Strategic Profile
The radar chart reveals the fundamental DNA and trade-offs of Lockheed Martin Corporation and Textron Inc., highlighting their core financial strengths and vulnerabilities:
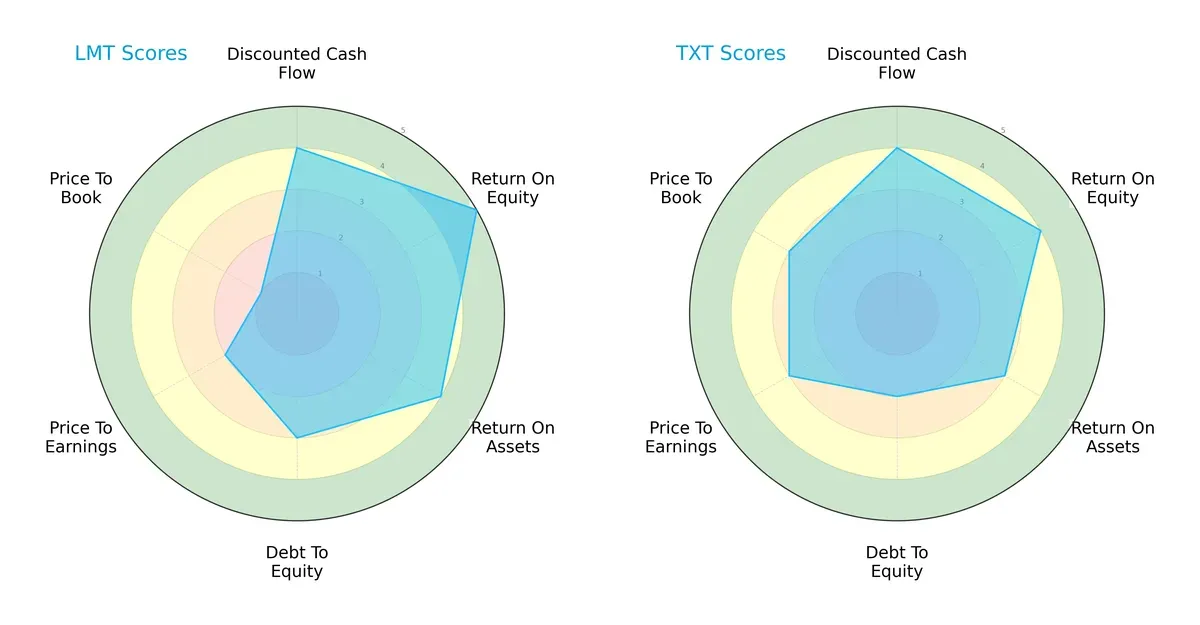
Lockheed Martin shows superior returns, with ROE at 5 versus Textron’s 4 and ROA at 4 versus 3, indicating more efficient capital use. Textron, however, scores better in valuation metrics (PE/PB) and has a lower Debt/Equity risk profile. Lockheed Martin’s profile is more skewed towards operational efficiency, while Textron displays a more balanced but moderate risk-return spectrum.
Bankruptcy Risk: Solvency Showdown
Lockheed Martin’s Altman Z-Score of 3.69 places it comfortably in the safe zone, while Textron’s 2.34 signals moderate bankruptcy risk in this cycle:
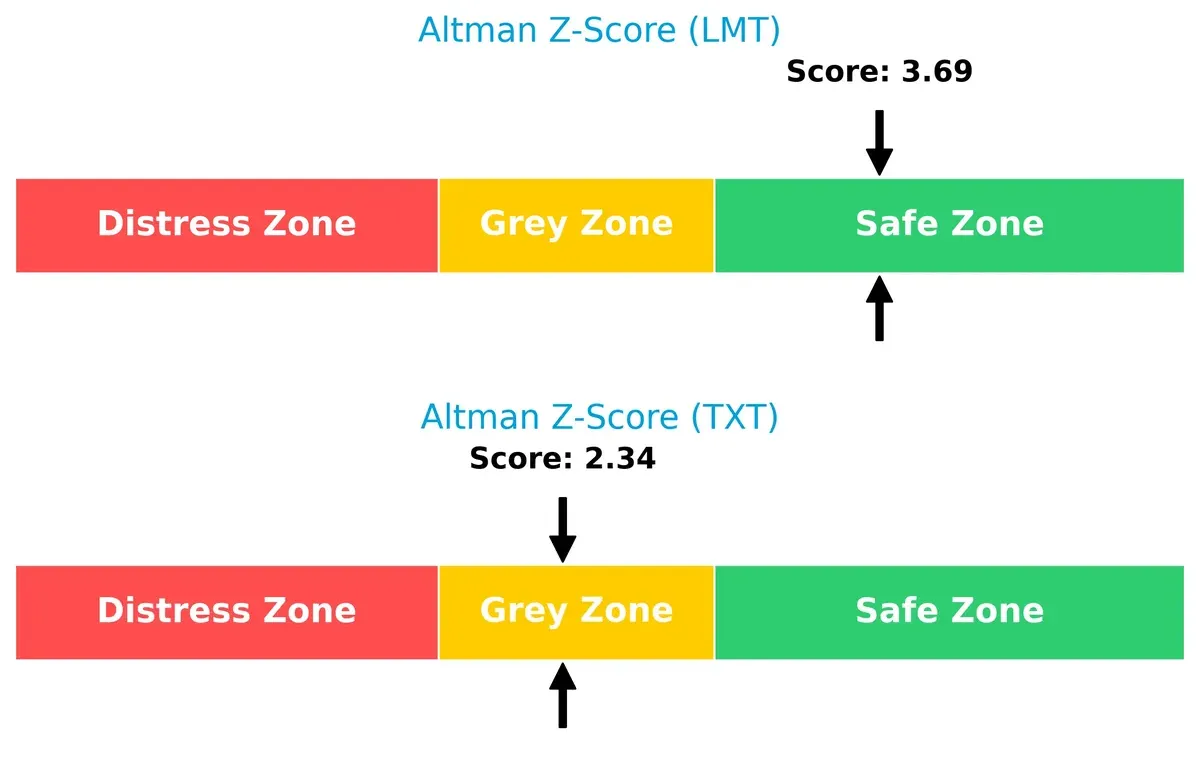
Lockheed Martin’s stronger solvency suggests better resilience against economic downturns. Textron’s position in the grey zone demands caution, as it faces higher financial stress and potential liquidity challenges.
Financial Health: Quality of Operations
Textron’s Piotroski F-Score of 7 edges out Lockheed Martin’s 6, indicating stronger internal financial health and operational quality:
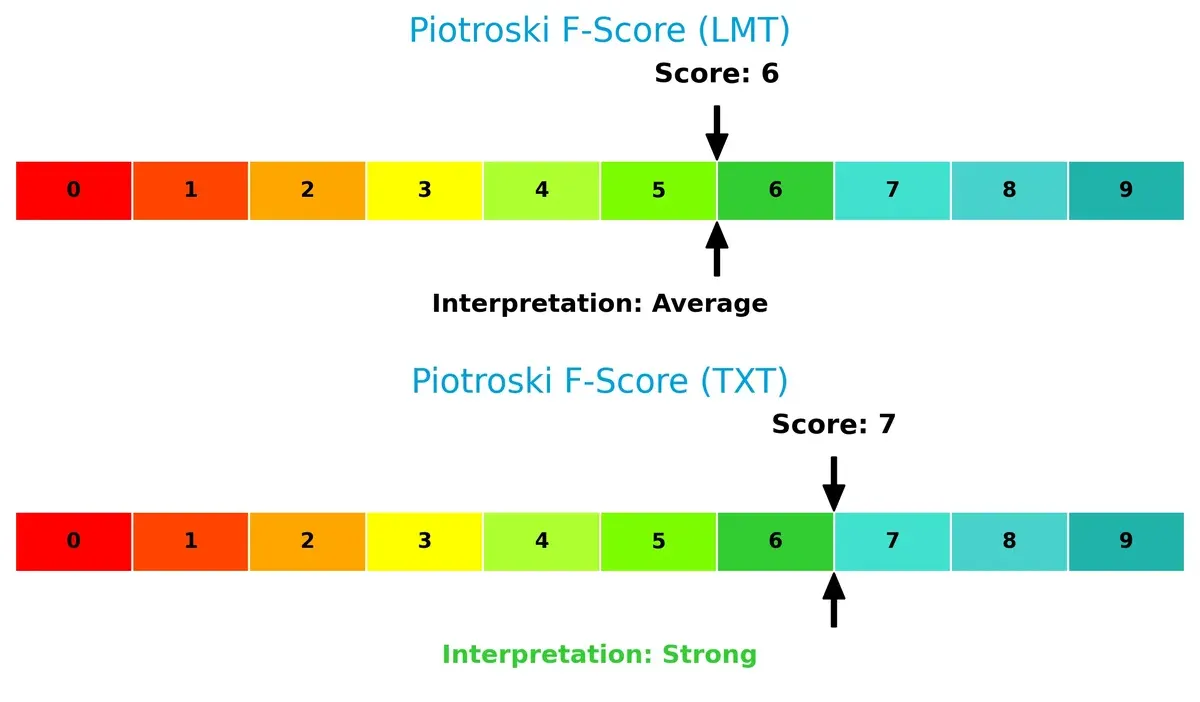
Textron’s higher score reflects better profitability, liquidity, and efficiency metrics. Lockheed Martin’s slightly lower score warns of some red flags in internal controls or asset management compared to Textron’s more robust fundamentals.
How are the two companies positioned?
This section dissects the operational DNA of Lockheed Martin and Textron by comparing their revenue distribution and internal dynamics. The objective is to confront their economic moats and identify which model offers the most resilient competitive advantage today.
Revenue Segmentation: The Strategic Mix
This visual comparison dissects how Lockheed Martin Corporation and Textron Inc. diversify their income streams and where their primary sector bets lie:
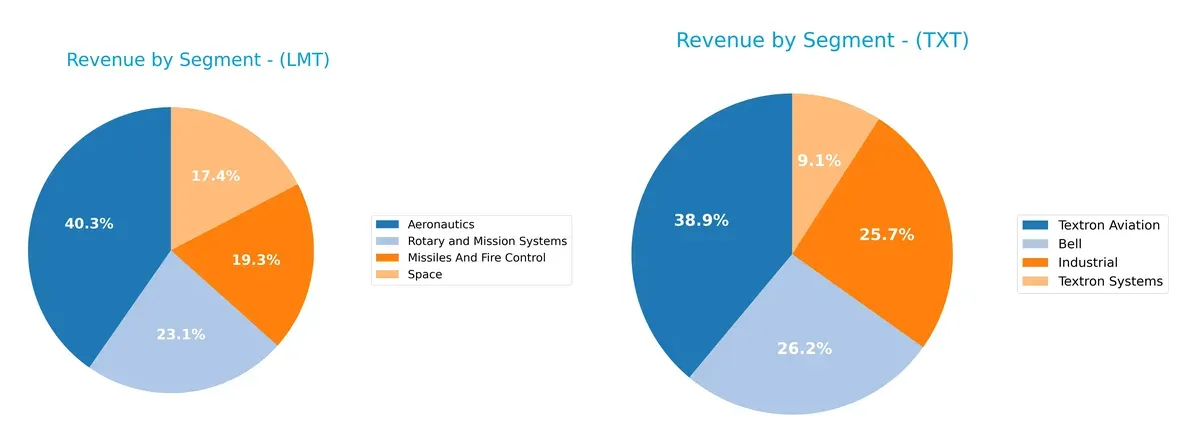
Lockheed Martin anchors revenue heavily in Aeronautics at $30.3B, with substantial contributions from Rotary and Mission Systems ($17.3B) and Space ($13.0B). Textron shows a more balanced mix, with Textron Aviation ($5.3B), Bell ($3.6B), and Industrial ($3.5B) revenues closely clustered. Lockheed’s concentration in aerospace and defense sectors implies strong ecosystem lock-in but higher segment risk. Textron’s diversified portfolio reduces dependency on any single unit, enhancing its resilience in cyclical markets.
Strengths and Weaknesses Comparison
This table compares the strengths and weaknesses of Lockheed Martin Corporation and Textron Inc. based on diversification, profitability, financials, innovation, global presence, and market share:
Lockheed Martin Strengths
- Diverse aerospace and defense segments with Aeronautics at $30B and Space at $13B
- High ROE of 74.65% and ROIC of 17.39%, well above WACC
- Low debt-to-assets at 1.95% and strong interest coverage of 6.3x
- Robust fixed asset turnover of 8.46 and dividend yield of 2.8%
- Significant US market presence with $53.7B revenue and solid Europe and Asia Pacific sales
Textron Strengths
- Balanced product portfolio including Bell, Industrial, and Textron Aviation segments each around $3.5B to $5.3B
- Favorable WACC of 7.58% and solid interest coverage of 12.84x
- Strong quick ratio of 2.33 and manageable debt-to-assets at 19.49%
- Geographic diversification with $9.7B US revenue and growing international presence
- Efficient fixed asset turnover of 5.71 and neutral PE at 17.04
Lockheed Martin Weaknesses
- High PB ratio at 16.62, indicating possible overvaluation
- Neutral net margin at 6.68% lower than expected for sector leaders
- Current and quick ratios near 1.0 reflect moderate liquidity
- Market heavily concentrated in US, limiting geographic diversification
- Neutral asset turnover at 1.25 suggests scope to improve operational efficiency
Textron Weaknesses
- Unfavorable current ratio at 5.94, potentially reflecting working capital management issues
- Low dividend yield at 0.12%, less attractive for income investors
- Lower ROE of 11.7% and ROIC of 9.41%, only neutral compared to peers
- Moderate asset turnover at 0.82 may indicate lower efficiency
- Smaller global footprint with limited revenue outside US and Europe
Lockheed Martin demonstrates strong profitability and financial discipline anchored in a highly diversified aerospace and defense portfolio with dominant US market share. Textron shows strengths in liquidity and interest coverage but faces challenges in profitability and geographic reach. These contrasts reflect differing strategic focuses and operational efficiencies.
The Moat Duel: Analyzing Competitive Defensibility
A structural moat is the only force protecting long-term profits from the relentless erosion of competition:
Lockheed Martin Corporation: Intangible Assets and Government Backing
Lockheed Martin’s moat stems from deep government contracts and proprietary defense technology. This drives a high ROIC, though its profitability shows a slight decline in 2026. New space and missile defense programs could reinforce its edge.
Textron Inc.: Operational Agility and Product Diversification
Textron relies on operational flexibility and diversified aerospace products, contrasting Lockheed’s scale. Its ROIC has grown strongly, signaling improving value creation. Expansion in unmanned systems and commercial aviation supports future moat strengthening.
The Moat Verdict: Intangible Assets vs. Operational Agility
Lockheed Martin holds a wider moat due to entrenched government ties and unique defense tech. Textron’s growing ROIC reveals a deepening moat, but it remains less defensible long term. Lockheed is better positioned to defend its market share in a competitive aerospace landscape.
Which stock offers better returns?
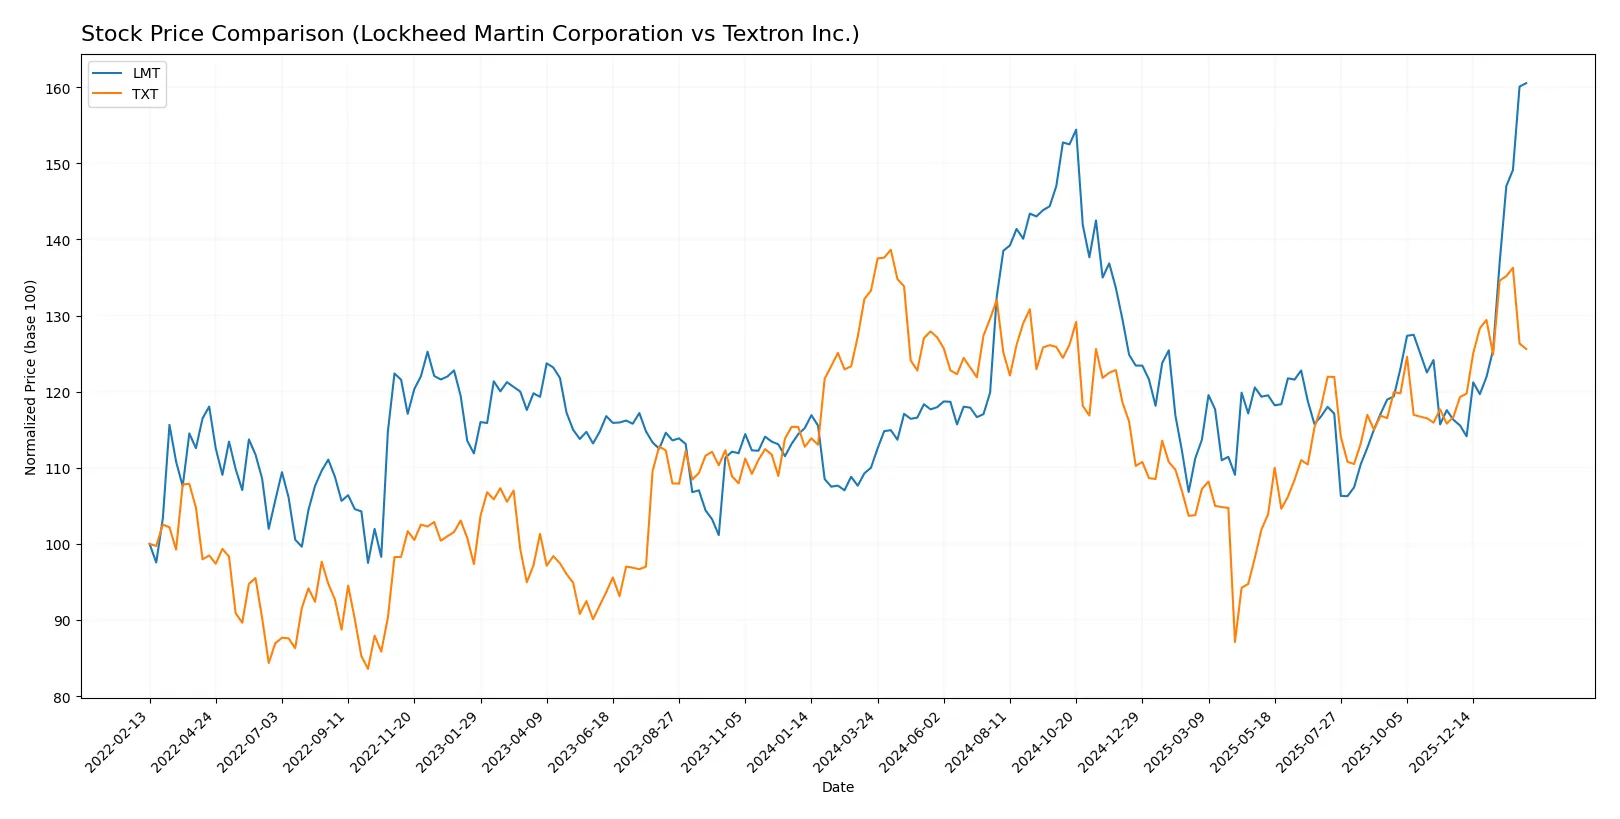
Over the past year, Lockheed Martin’s stock surged sharply, showing strong upward momentum. Textron’s shares declined overall but gained modestly in recent months, reflecting contrasting trading dynamics.
Trend Comparison
Lockheed Martin’s stock rose 45.93% over the past 12 months, marking a bullish trend with accelerating gains. It reached a high of 636 and a low of 421, showing notable price expansion.
Textron’s stock dropped 5.76% over the same period, indicating a bearish trend despite recent 7.66% gains. Its price fluctuated between 60.72 and 96.65, with moderate volatility.
Lockheed Martin outperformed Textron significantly, delivering the highest total return and stronger momentum throughout the year.
Target Prices
Analysts present a balanced target consensus for Lockheed Martin and Textron, reflecting measured optimism given current valuations.
| Company | Target Low | Target High | Consensus |
|---|---|---|---|
| Lockheed Martin Corporation | 517 | 695 | 607 |
| Textron Inc. | 92 | 110 | 101 |
Lockheed Martin’s consensus target of 607 sits slightly below its current price of 636, suggesting cautious upside potential. Textron’s target consensus of 101 exceeds its 87.56 stock price, indicating room for growth.

Don’t Let Luck Decide Your Entry Point
Optimize your entry points with our advanced ProRealTime indicators. You’ll get efficient buy signals with precise price targets for maximum performance. Start outperforming now!
How do institutions grade them?
The following tables summarize recent institutional grades for Lockheed Martin Corporation and Textron Inc.:
Lockheed Martin Corporation Grades
This table lists recent grades assigned by established financial institutions for Lockheed Martin Corporation.
| Grading Company | Action | New Grade | Date |
|---|---|---|---|
| Goldman Sachs | Maintain | Sell | 2026-02-02 |
| RBC Capital | Maintain | Sector Perform | 2026-01-30 |
| TD Cowen | Maintain | Hold | 2026-01-30 |
| UBS | Maintain | Neutral | 2026-01-15 |
| Citigroup | Maintain | Neutral | 2026-01-13 |
| Jefferies | Maintain | Hold | 2026-01-12 |
| Truist Securities | Upgrade | Buy | 2026-01-09 |
| JP Morgan | Downgrade | Neutral | 2025-12-19 |
| Morgan Stanley | Downgrade | Equal Weight | 2025-12-16 |
| UBS | Maintain | Neutral | 2025-10-22 |
Textron Inc. Grades
This table shows recent grades issued by recognized financial firms for Textron Inc.
| Grading Company | Action | New Grade | Date |
|---|---|---|---|
| Citigroup | Maintain | Neutral | 2026-01-29 |
| JP Morgan | Maintain | Neutral | 2026-01-29 |
| UBS | Maintain | Neutral | 2026-01-15 |
| Citigroup | Maintain | Neutral | 2026-01-13 |
| JP Morgan | Maintain | Neutral | 2025-10-27 |
| UBS | Maintain | Neutral | 2025-10-24 |
| TD Cowen | Maintain | Hold | 2025-10-24 |
| Barclays | Maintain | Overweight | 2025-07-29 |
| UBS | Upgrade | Neutral | 2025-07-28 |
| Susquehanna | Maintain | Positive | 2025-07-25 |
Which company has the best grades?
Lockheed Martin mostly receives neutral to sell ratings with a single buy upgrade. Textron holds consistently neutral to overweight ratings, signaling slightly more positive sentiment. Investors may view Textron’s steadier outlook as less risky.
Risks specific to each company
The following categories identify critical pressure points and systemic threats facing Lockheed Martin Corporation and Textron Inc. in the 2026 market environment:
1. Market & Competition
Lockheed Martin Corporation
- Dominates U.S. defense with strong government contracts but faces intense global competition and budget uncertainties.
Textron Inc.
- Diversified across aerospace and industrial sectors, exposed to cyclical commercial demand and competitive pressures in multiple markets.
2. Capital Structure & Debt
Lockheed Martin Corporation
- Maintains low debt-to-equity (0.17) and strong interest coverage (6.3), signaling prudent leverage use.
Textron Inc.
- Higher leverage (debt-to-equity 0.45) but solid interest coverage (12.84); elevated current ratio suggests some liquidity imbalance.
3. Stock Volatility
Lockheed Martin Corporation
- Very low beta (0.23) indicates stock stability and defensive characteristics in volatile markets.
Textron Inc.
- Beta near 1 (1.001) implies typical market volatility exposure, risking higher price swings.
4. Regulatory & Legal
Lockheed Martin Corporation
- Heavily regulated with reliance on U.S. government contracts, facing compliance and export control risks.
Textron Inc.
- Subject to aerospace and industrial regulations globally; less concentrated but exposed to multiple regulatory environments.
5. Supply Chain & Operations
Lockheed Martin Corporation
- Complex, global supply chain tied to defense programs; risks include geopolitical disruptions and supplier dependencies.
Textron Inc.
- Diverse operations increase supply chain complexity, with exposure to commercial aerospace and industrial supply constraints.
6. ESG & Climate Transition
Lockheed Martin Corporation
- Faces pressure to reduce carbon footprint in defense manufacturing and improve sustainability reporting.
Textron Inc.
- Industrial segment exposed to evolving emissions standards; potential opportunity in hybrid vehicle fuel systems.
7. Geopolitical Exposure
Lockheed Martin Corporation
- Major exposure to U.S. foreign military sales and geopolitical tensions affecting defense spending.
Textron Inc.
- International operations spread risk but increase vulnerability to trade policies and regional conflicts.
Which company shows a better risk-adjusted profile?
Lockheed Martin’s dominant government position and low leverage provide a more stable, lower-risk profile. Textron’s broader market exposure and higher volatility pose greater risks despite stronger liquidity. Lockheed Martin’s Altman Z-score of 3.69 confirms its safe financial zone, while Textron’s 2.34 signals moderate risk. The key risk for Lockheed Martin is geopolitical dependency on defense budgets; for Textron, it is market cyclicality and operational complexity. Overall, Lockheed Martin offers superior risk-adjusted stability in 2026.
Final Verdict: Which stock to choose?
Lockheed Martin’s superpower lies in its robust capital efficiency and value creation, consistently delivering returns well above its cost of capital. Its point of vigilance is a declining ROIC trend, hinting at potential challenges in sustaining profitability. This stock suits investors targeting Aggressive Growth with a tolerance for cyclical swings.
Textron offers a strategic moat through its improving profitability trajectory and strong liquidity position. Unlike Lockheed Martin, Textron provides a safer profile with a growing return on invested capital, though it lacks the same capital efficiency. It fits well in a GARP (Growth at a Reasonable Price) portfolio seeking steady upside with moderate risk.
If you prioritize high capital efficiency and aggressive value creation, Lockheed Martin is the compelling choice due to its dominant ROIC spread and bullish price momentum. However, if you seek improving profitability with better balance sheet stability, Textron offers superior risk management and growth potential, albeit with less capital efficiency.
Disclaimer: Investment carries a risk of loss of initial capital. The past performance is not a reliable indicator of future results. Be sure to understand risks before making an investment decision.
Go Further
I encourage you to read the complete analyses of Lockheed Martin Corporation and Textron Inc. to enhance your investment decisions: