Home > Comparison > Industrials > RTX vs LMT
The strategic rivalry between RTX Corporation and Lockheed Martin Corporation shapes the Aerospace & Defense sector’s evolution. RTX operates as a diversified industrial powerhouse with segments spanning aerospace systems, engines, and defense technologies. Lockheed Martin, by contrast, focuses on integrated security and advanced aerospace solutions with a strong emphasis on innovation in military and space domains. This analysis will assess which company’s operational model and capital allocation deliver superior risk-adjusted returns for a balanced portfolio.
Table of contents
Companies Overview
RTX Corporation and Lockheed Martin Corporation are key players in the aerospace and defense market, shaping U.S. and global security landscapes.
RTX Corporation: Aerospace & Defense Systems Leader
RTX Corporation generates revenue through three core segments: Collins Aerospace, Pratt & Whitney, and Raytheon. Its competitive advantage lies in integrated aerospace systems, including aircraft engines and defense threat detection. In 2026, RTX focuses on expanding advanced aerospace services and enhancing military and commercial product portfolios to secure long-term growth.
Lockheed Martin Corporation: Defense Technology Powerhouse
Lockheed Martin drives revenue via four segments: Aeronautics, Missiles and Fire Control, Rotary and Mission Systems, and Space. It excels in cutting-edge defense technologies, from combat aircraft to missile defense. The company’s 2026 strategy emphasizes innovation in space systems and integrated intelligence solutions, reinforcing its dominance in U.S. government contracts.
Strategic Collision: Similarities & Divergences
Both companies prioritize defense innovation but differ in approach: RTX integrates aerospace and defense systems broadly, while Lockheed Martin specializes in focused, high-tech defense solutions. Their primary battleground is advanced military technology and government contracts. RTX offers diversified aerospace exposure, whereas Lockheed Martin presents a concentrated defense technology profile.
Income Statement Comparison
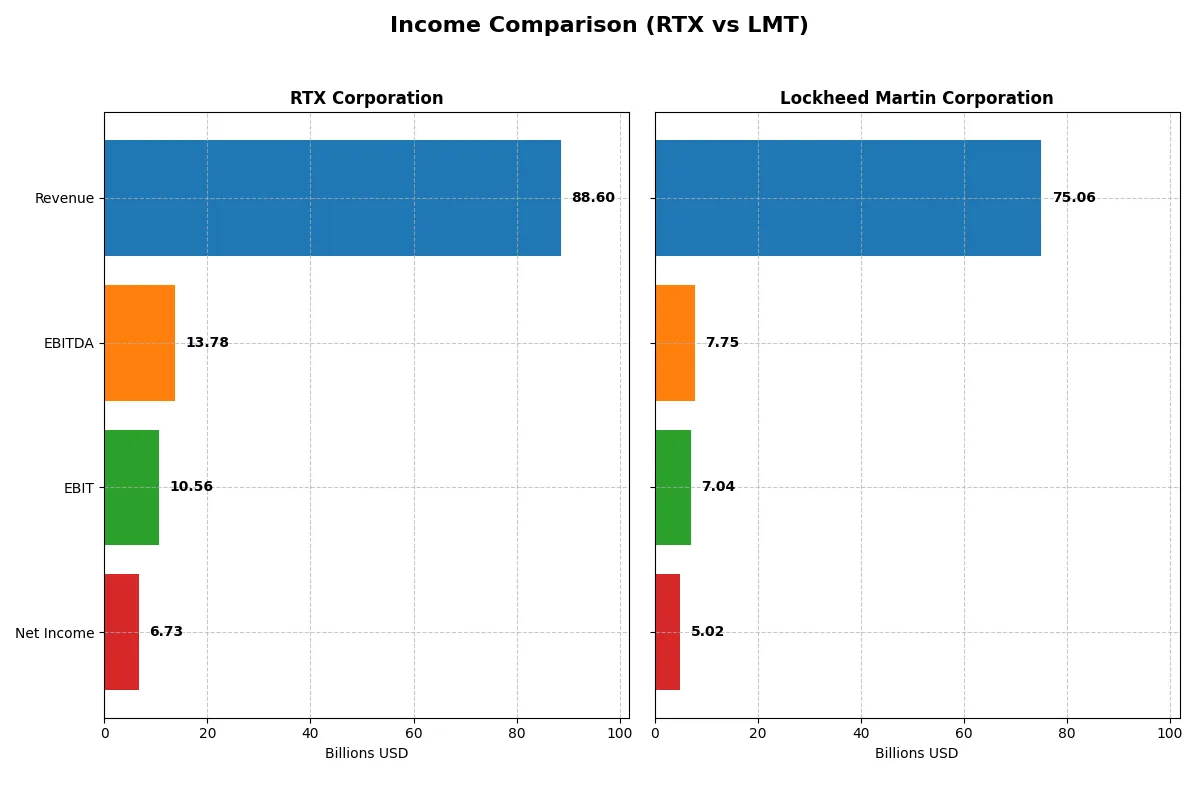
This data dissects the core profitability and scalability of both corporate engines to reveal who dominates the bottom line:
| Metric | RTX Corporation (RTX) | Lockheed Martin Corporation (LMT) |
|---|---|---|
| Revenue | 88.6B | 75.1B |
| Cost of Revenue | 70.8B | 67.4B |
| Operating Expenses | 8.90B | -0.10B |
| Gross Profit | 17.8B | 7.62B |
| EBITDA | 13.8B | 7.75B |
| EBIT | 10.6B | 7.04B |
| Interest Expense | 1.83B | 1.12B |
| Net Income | 6.73B | 5.02B |
| EPS | 5.03 | 21.56 |
| Fiscal Year | 2025 | 2025 |
Income Statement Analysis: The Bottom-Line Duel
Comparing these income statements reveals each company’s true operational efficiency and bottom-line strength over recent years.
RTX Corporation Analysis
RTX’s revenue climbed steadily from 64.4B in 2021 to 88.6B in 2025, with net income surging from 3.9B to 6.7B. Gross and net margins remain robust at 20.1% and 7.6%, respectively, indicating strong cost control and profitability. The 2025 year shows significant momentum, with net income growing 41% and EPS jumping nearly 40%, reflecting operational efficiency and effective capital allocation.
Lockheed Martin Corporation Analysis
Lockheed Martin’s revenue increased moderately from 67.0B in 2021 to 75.1B in 2025, but net income declined from 6.3B to 5.0B. Gross margin stands at a modest 10.2%, and net margin at 6.7%, signaling thinner profitability. The 2025 results reveal weakening momentum, with net income down 6% year-over-year and EBIT shrinking nearly 3%, suggesting margin pressures and less efficient cost management.
Margin Strength vs. Revenue Growth
RTX outpaces Lockheed Martin with stronger revenue growth, higher margins, and accelerating earnings, showcasing superior operational execution. Lockheed Martin lags on profitability despite revenue gains, reflecting margin compression and net income decline. For investors, RTX’s profile offers a more compelling blend of growth and margin expansion in a challenging market environment.
Financial Ratios Comparison
These vital ratios act as a diagnostic tool to expose the underlying fiscal health, valuation premiums, and capital efficiency of the companies compared below:
| Ratios | RTX Corporation (RTX) | Lockheed Martin Corporation (LMT) |
|---|---|---|
| ROE | N/A | 74.65% |
| ROIC | N/A | 17.39% |
| P/E | 36.64 | 22.26 |
| P/B | N/A | 16.62 |
| Current Ratio | 0.99 | 1.09 |
| Quick Ratio | 0.74 | 0.94 |
| D/E (Debt-to-Equity) | 0.71 | 0.17 |
| Debt-to-Assets | 26.34% | 1.95% |
| Interest Coverage | 3.39 | 6.92 |
| Asset Turnover | 0.50 | 1.25 |
| Fixed Asset Turnover | 4.50 | 8.46 |
| Payout ratio | 67.39% | 62.41% |
| Dividend yield | 2.09% | 2.80% |
| Fiscal Year | 2025 | 2025 |
Efficiency & Valuation Duel: The Vital Signs
Financial ratios function as a company’s DNA, uncovering hidden risks and revealing operational strengths essential for investment decisions.
RTX Corporation
RTX shows a neutral net margin at 7.6%, but weak ROE and ROIC signal profitability challenges. The stock trades at a stretched 36.64 P/E, suggesting overvaluation. Dividend yield of 1.45% offers modest shareholder returns, while reinvestment focuses on R&D at 3.6% of revenue, aiming for future growth despite current inefficiencies.
Lockheed Martin Corporation
Lockheed Martin demonstrates strong profitability with a 74.65% ROE and 17.39% ROIC. The P/E at 22.26 is reasonable given its operational efficiency. The company yields a solid 2.8% dividend and maintains low debt, reflecting disciplined capital allocation. Its high asset turnover and interest coverage underscore robust business health and shareholder value.
Operational Efficiency vs. Growth Ambitions
Lockheed Martin leads with superior profitability and valuation balance, minimizing risk while delivering shareholder returns. RTX’s stretched valuation and weak returns highlight operational risks, appealing more to growth-focused investors willing to accept short-term challenges. Investors prioritizing stable cash flow and efficiency may prefer Lockheed Martin’s profile.
Which one offers the Superior Shareholder Reward?
I observe RTX and LMT both distribute solid dividends, but their approaches diverge. RTX yields 1.45%, with a payout ratio near 53%, balancing dividends and buybacks. LMT offers a higher yield at 2.80%, with a 62% payout ratio, supported by robust free cash flow of 30B and aggressive buybacks. RTX’s free cash flow per share is 5.9, while LMT delivers nearly 30, showcasing stronger capital generation. LMT’s payout is more sustainable given its conservative leverage (debt-to-equity 0.17 vs. RTX’s 0.71) and superior cash flow coverage. I conclude LMT offers a more attractive total return profile in 2026, blending higher yield with sustainable buybacks and cash flow.
Comparative Score Analysis: The Strategic Profile
The radar chart reveals the fundamental DNA and trade-offs of RTX Corporation and Lockheed Martin Corporation, highlighting their distinct financial strengths and weaknesses:
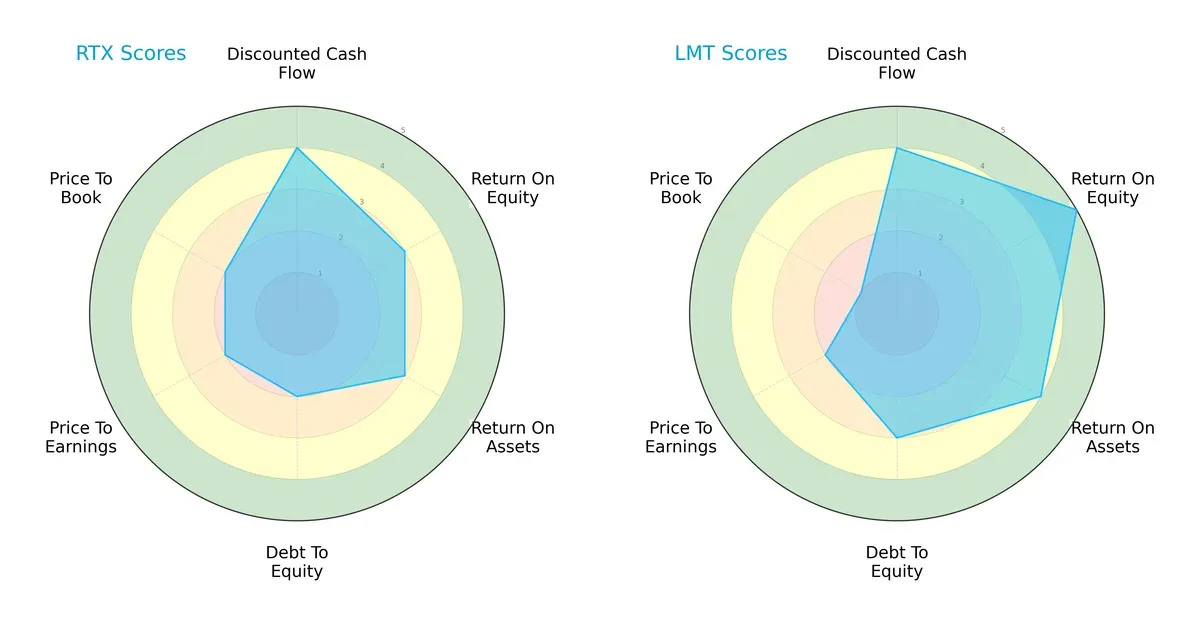
Lockheed Martin dominates in profitability metrics with superior ROE (5 vs. 3) and ROA (4 vs. 3), signaling efficient capital and asset use. RTX shows a weaker debt-to-equity score (2 vs. 3), indicating higher leverage risk. Both share strong DCF scores (4), but Lockheed’s valuation profile is less balanced with a very unfavorable P/B score (1 vs. 2). Overall, Lockheed Martin presents a more robust and balanced financial profile, while RTX leans on moderate returns with higher financial risk.
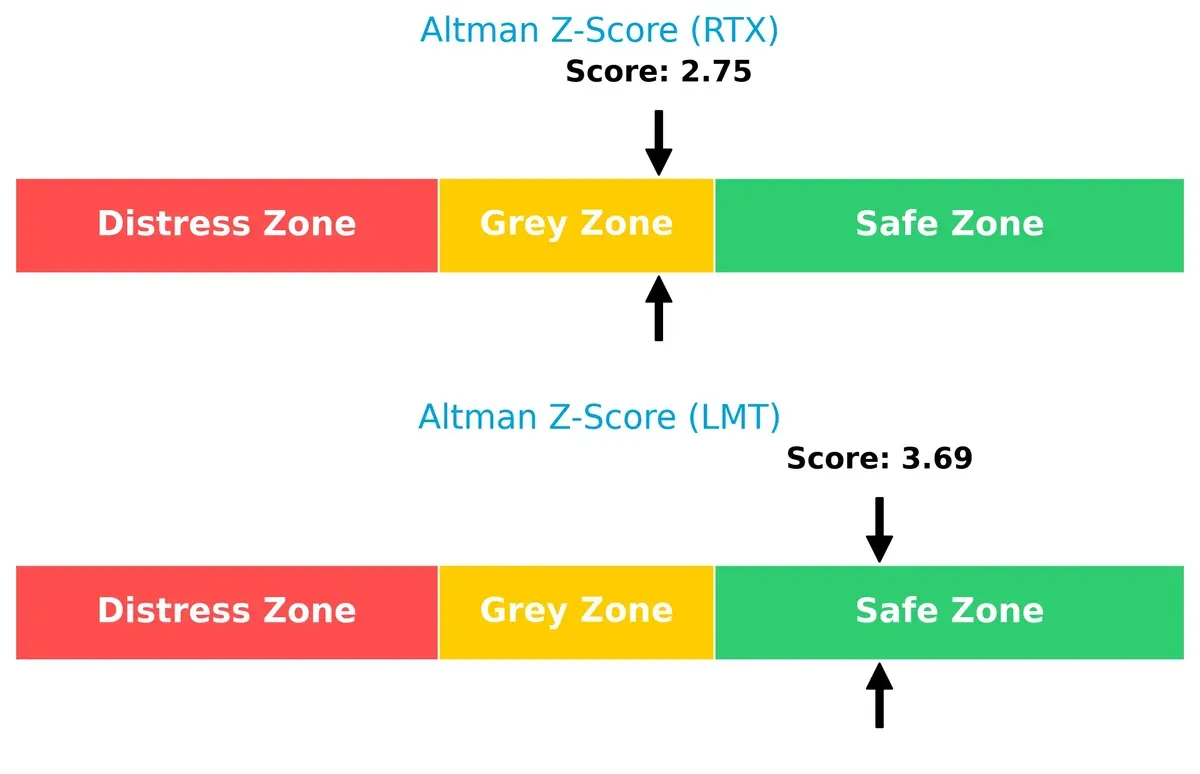
Bankruptcy Risk: Solvency Showdown
The Altman Z-Score gap (RTX: 2.75 grey zone, LMT: 3.69 safe zone) signals Lockheed Martin’s stronger solvency and lower bankruptcy risk in this economic cycle:
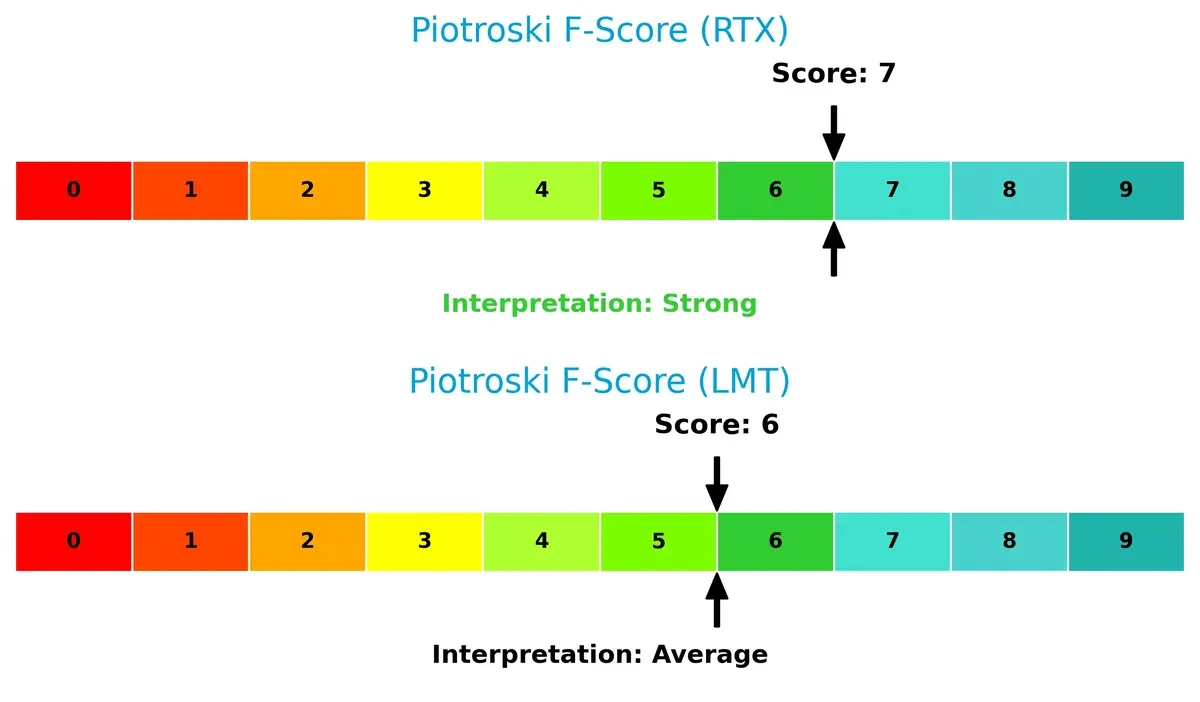
Financial Health: Quality of Operations
RTX exhibits a stronger Piotroski F-Score (7 strong) versus Lockheed Martin’s 6 (average), suggesting RTX maintains healthier internal financial quality and fewer operational red flags:
How are the two companies positioned?
This section dissects the operational DNA of RTX and LMT by comparing their revenue distribution and internal dynamics. The goal is to confront their economic moats and identify which model offers the most resilient, sustainable competitive advantage today.
Revenue Segmentation: The Strategic Mix
This visual comparison dissects how RTX Corporation and Lockheed Martin Corporation diversify their income streams and reveals where their primary sector bets lie:
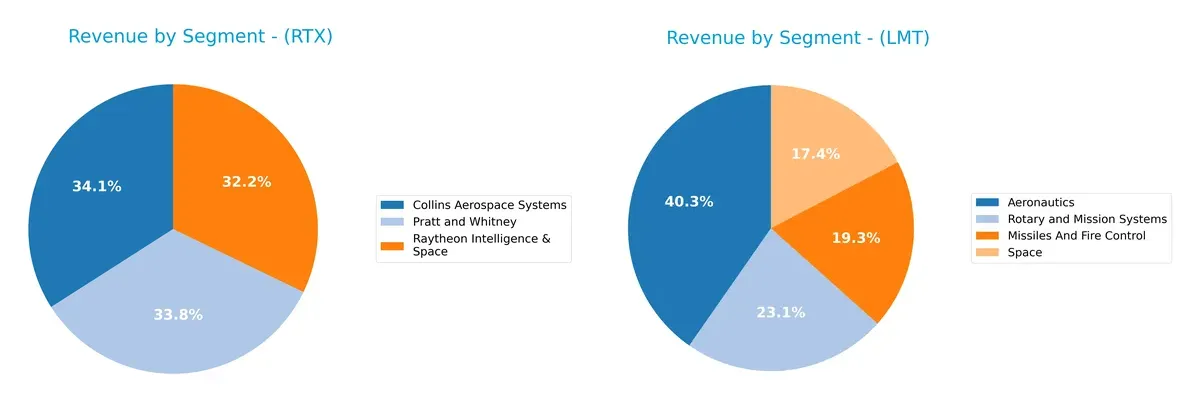
RTX balances its revenue across Collins Aerospace Systems ($28.3B), Pratt and Whitney ($28.1B), and Raytheon Intelligence & Space ($26.7B), showing a well-diversified aerospace and defense portfolio. Lockheed Martin leans more on Aeronautics ($30.3B), which dwarfs its other segments like Rotary and Mission Systems ($17.3B) and Space ($13B). RTX’s spread indicates lower concentration risk, while LMT’s Aeronautics dominance suggests infrastructure lock-in but higher exposure to that segment’s cyclicality.
Strengths and Weaknesses Comparison
This table compares the Strengths and Weaknesses of RTX Corporation and Lockheed Martin Corporation:
RTX Strengths
- Diverse revenue streams across aerospace and defense segments
- Significant U.S. market presence with $46B in 2024
- Favorable debt and interest coverage ratios
LMT Strengths
- High ROE and ROIC indicating strong profitability
- Diverse defense segments including Aeronautics and Space
- Favorable asset turnover and dividend yield
RTX Weaknesses
- Unfavorable liquidity ratios and asset turnover
- Zero reported ROE and ROIC reflect profitability challenges
- High P/E ratio may pressure valuation
LMT Weaknesses
- High price-to-book ratio suggests overvaluation risk
- Neutral liquidity ratios might constrain flexibility
- Slightly lower net margin compared to RTX
RTX shows strength in diversification and debt management but struggles with profitability and liquidity. LMT demonstrates robust profitability and efficiency but faces valuation risks and moderate liquidity. These factors will shape their strategic priorities going forward.
The Moat Duel: Analyzing Competitive Defensibility
A structural moat is the only durable shield protecting long-term profits from relentless competitive erosion. Let’s dissect the moats of RTX and Lockheed Martin:
RTX Corporation: Intangible Assets and Diversified Defense Ecosystem
RTX’s moat rests on its vast portfolio of aerospace and defense technologies spanning Pratt & Whitney engines to Raytheon’s threat detection. This manifests in solid margin stability and robust revenue growth, but its declining ROIC signals weakening capital efficiency in 2026.
Lockheed Martin Corporation: Cost Advantage and Government Contract Lock-in
Lockheed Martin leverages exclusive U.S. government contracts and integrated defense systems, creating high barriers to entry. Its ROIC comfortably exceeds WACC, reflecting value creation, though recent margin pressures hint at emerging challenges in sustaining growth.
Moat Strength Showdown: Intangible Assets vs. Contractual Lock-in
Lockheed Martin’s cost advantage and government lock-in create a wider moat than RTX’s intangible asset base. Despite both facing profitability headwinds, Lockheed Martin is better positioned to defend market share amid evolving defense budgets.
Which stock offers better returns?
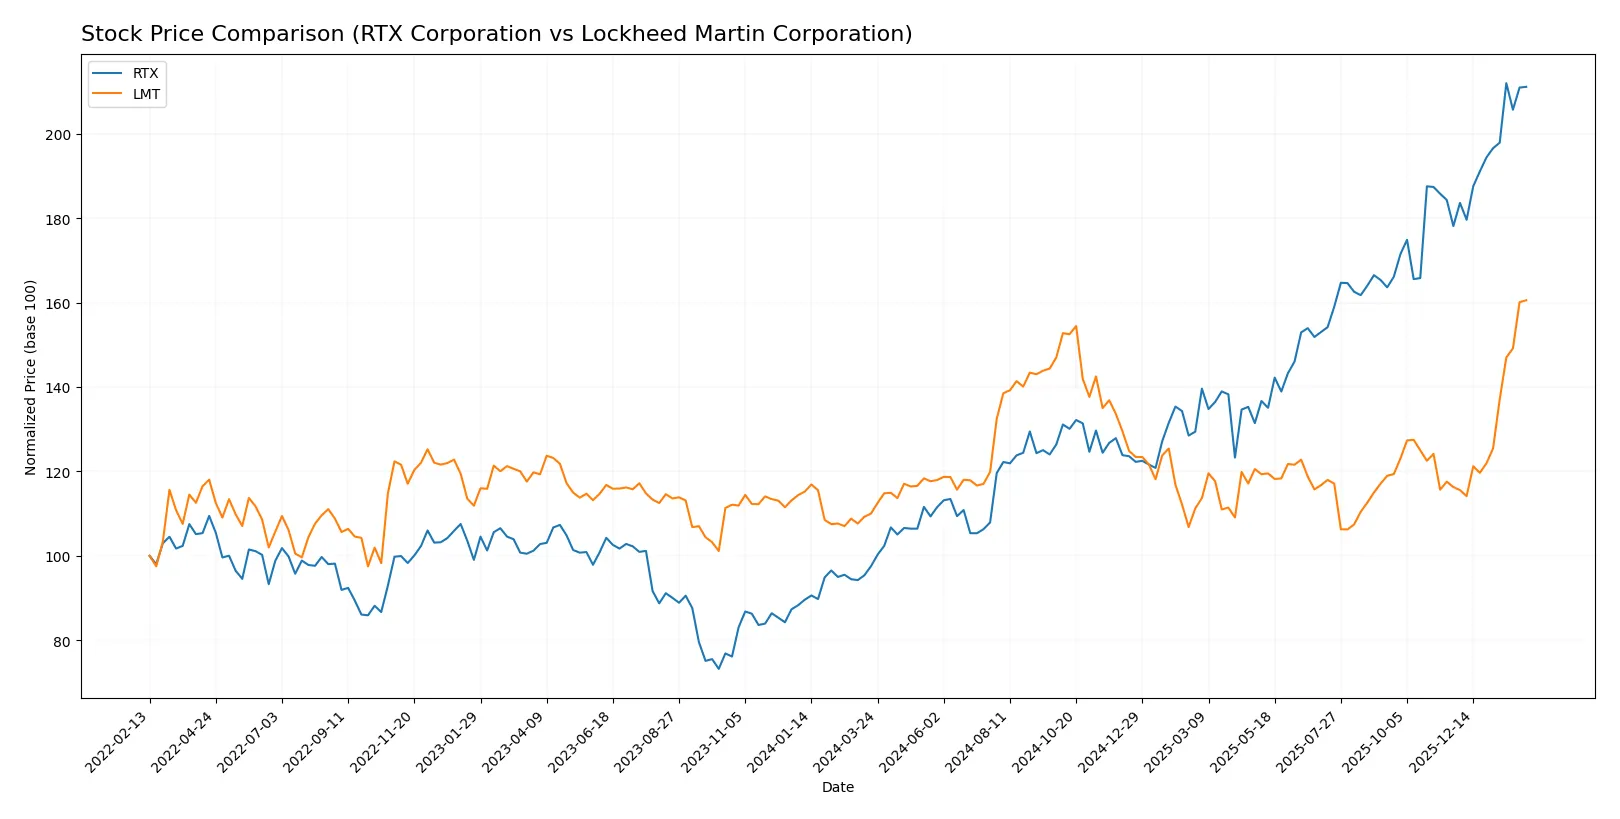
Stock price movements over the past year reveal strong bullish trends for both companies, with notable acceleration and distinct trading volume dynamics influencing their momentum.
Trend Comparison
RTX Corporation’s stock rose 116.39% over 12 months, showing a clear bullish trend with accelerating gains and a steady volatility level (27.73). The highest price reached 201.92, recovering sharply from a low of 92.93.
Lockheed Martin’s stock increased 45.93% in the same period, also exhibiting an accelerating bullish trend. Volatility is higher (49.72), with prices ranging from 421.01 to 636. Recent gains are strong but less than RTX’s in percentage terms.
RTX leads in market performance with a 116.39% increase, outperforming Lockheed Martin’s 45.93%. Both show acceleration, but RTX’s gains are more than double LMT’s over the past year.
Target Prices
Analysts show a confident upside potential for RTX Corporation and Lockheed Martin Corporation.
| Company | Target Low | Target High | Consensus |
|---|---|---|---|
| RTX Corporation | 168 | 235 | 214.7 |
| Lockheed Martin Corporation | 517 | 695 | 607 |
RTX trades below its consensus target of 214.7, suggesting room for appreciation. Lockheed Martin’s consensus target of 607 is slightly below its current price of 636, indicating a more cautious outlook.

Don’t Let Luck Decide Your Entry Point
Optimize your entry points with our advanced ProRealTime indicators. You’ll get efficient buy signals with precise price targets for maximum performance. Start outperforming now!
How do institutions grade them?
RTX Corporation Grades
The following table summarizes recent institutional grades for RTX Corporation:
| Grading Company | Action | New Grade | Date |
|---|---|---|---|
| UBS | maintain | Neutral | 2026-01-28 |
| JP Morgan | maintain | Overweight | 2026-01-28 |
| RBC Capital | maintain | Outperform | 2026-01-28 |
| Citigroup | maintain | Buy | 2026-01-13 |
| UBS | downgrade | Neutral | 2026-01-05 |
| JP Morgan | maintain | Overweight | 2025-12-19 |
| B of A Securities | maintain | Buy | 2025-10-27 |
| UBS | maintain | Buy | 2025-10-22 |
| Goldman Sachs | maintain | Neutral | 2025-10-22 |
| Susquehanna | maintain | Positive | 2025-10-22 |
Lockheed Martin Corporation Grades
The following table summarizes recent institutional grades for Lockheed Martin Corporation:
| Grading Company | Action | New Grade | Date |
|---|---|---|---|
| Goldman Sachs | maintain | Sell | 2026-02-02 |
| RBC Capital | maintain | Sector Perform | 2026-01-30 |
| TD Cowen | maintain | Hold | 2026-01-30 |
| UBS | maintain | Neutral | 2026-01-15 |
| Citigroup | maintain | Neutral | 2026-01-13 |
| Jefferies | maintain | Hold | 2026-01-12 |
| Truist Securities | upgrade | Buy | 2026-01-09 |
| JP Morgan | downgrade | Neutral | 2025-12-19 |
| Morgan Stanley | downgrade | Equal Weight | 2025-12-16 |
| UBS | maintain | Neutral | 2025-10-22 |
Which company has the best grades?
RTX Corporation holds consistently stronger grades, including multiple Buy, Outperform, and Overweight ratings. Lockheed Martin’s grades are more mixed, with Sell and Neutral prevailing. This contrast may influence investor sentiment toward RTX’s relative outlook.
Risks specific to each company
The following categories identify the critical pressure points and systemic threats facing both firms in the 2026 market environment:
1. Market & Competition
RTX Corporation
- Faces intense competition in aerospace and defense, with pressure on margins and innovation pace.
Lockheed Martin Corporation
- Dominates key defense sectors, but faces risks from evolving military technology demands and government contracts.
2. Capital Structure & Debt
RTX Corporation
- Shows favorable debt-to-equity metrics but weak liquidity ratios raise caution on short-term financial flexibility.
Lockheed Martin Corporation
- Maintains a strong balance sheet with low leverage and solid interest coverage, supporting financial stability.
3. Stock Volatility
RTX Corporation
- Exhibits low beta (0.42), indicating lower market risk but possibly less upside in bullish cycles.
Lockheed Martin Corporation
- Even lower beta (0.23) reflects defensive stock characteristics and reduced volatility versus the market.
4. Regulatory & Legal
RTX Corporation
- Subject to stringent aerospace and defense regulations; compliance costs could rise with evolving international standards.
Lockheed Martin Corporation
- Faces similar regulatory scrutiny, with additional risk from classified contract compliance and export controls.
5. Supply Chain & Operations
RTX Corporation
- Complex global supply chain vulnerable to geopolitical disruptions and raw material cost inflation.
Lockheed Martin Corporation
- Extensive integration and diversified operations reduce supply chain risks but increase complexity management.
6. ESG & Climate Transition
RTX Corporation
- ESG pressures growing; must navigate climate-related risks while innovating sustainable aerospace solutions.
Lockheed Martin Corporation
- Increasing focus on ESG mandates, with investments in cleaner technologies and sustainability initiatives underway.
7. Geopolitical Exposure
RTX Corporation
- High international exposure subjects RTX to geopolitical tensions and export restrictions.
Lockheed Martin Corporation
- Primarily U.S.-focused but sensitive to shifts in foreign military sales and international defense partnerships.
Which company shows a better risk-adjusted profile?
Lockheed Martin’s superior capital structure, higher profitability (ROE 74.65%), and safer Altman Z-Score (3.69) demonstrate a stronger risk-adjusted profile than RTX. RTX’s liquidity weaknesses and moderate bankruptcy risk (Altman Z-Score 2.75) require cautious monitoring. Despite RTX’s slightly lower market beta, Lockheed’s financial resilience and operational scale justify a more favorable risk stance in 2026.
Final Verdict: Which stock to choose?
RTX Corporation’s superpower lies in its strong top-line momentum and robust income growth, signaling a business scaling its operations effectively. However, its declining capital efficiency and weak liquidity remain points of vigilance. RTX might suit investors targeting aggressive growth with tolerance for operational risks.
Lockheed Martin Corporation boasts a durable moat through its exceptional return on invested capital, reflecting efficient capital allocation and a resilient competitive position. Its superior financial stability and healthier cash conversion cycle provide a safer profile than RTX. LMT fits well in GARP portfolios seeking steady growth balanced with quality.
If you prioritize rapid revenue and earnings expansion, RTX offers a compelling scenario due to its growth acceleration. However, if you seek superior capital efficiency and financial resilience, Lockheed Martin outshines with better stability and a proven value-creation track record. Each appeals to distinct investor avatars balancing growth ambition against risk tolerance.
Disclaimer: Investment carries a risk of loss of initial capital. The past performance is not a reliable indicator of future results. Be sure to understand risks before making an investment decision.
Go Further
I encourage you to read the complete analyses of RTX Corporation and Lockheed Martin Corporation to enhance your investment decisions: