Home > Comparison > Industrials > LMT vs NOC
The strategic rivalry between Lockheed Martin Corporation and Northrop Grumman Corporation shapes the aerospace & defense sector’s evolution. Lockheed Martin operates as a diversified aerospace technology leader with integrated defense systems. Northrop Grumman focuses on advanced aerospace solutions and mission systems with a strong emphasis on innovation. This analysis contrasts their operational models to identify which company offers the superior risk-adjusted return for diversified portfolios navigating a complex geopolitical landscape.
Table of contents
Companies Overview
Lockheed Martin and Northrop Grumman dominate the U.S. aerospace and defense landscape with complementary strengths.
Lockheed Martin Corporation: Aerospace & Defense Powerhouse
Lockheed Martin leads as a global security and aerospace giant. It generates revenue through four segments: Aeronautics, Missiles and Fire Control, Rotary and Mission Systems, and Space. In 2026, the company sharpened its strategic focus on integrated space and ground-based systems to enhance situational awareness and national security intelligence capabilities.
Northrop Grumman Corporation: Advanced Aerospace Innovator
Northrop Grumman excels in aeronautics and defense technologies with a diversified portfolio spanning Aeronautics Systems, Defense Systems, Mission Systems, and Space Systems. Its core revenue stems from designing and delivering advanced aircraft, missile defense, and cyber solutions. In 2026, it emphasized precision strike weapons and networked information systems to maintain battlefield dominance.
Strategic Collision: Similarities & Divergences
Both companies pursue advanced aerospace and defense innovation but diverge in approach. Lockheed Martin favors an integrated system ecosystem combining space and ground intelligence. Northrop Grumman prioritizes modular mission systems and cyber capabilities. Their primary battleground is next-generation defense technologies. Investors should note Lockheed Martin’s broader market cap and scale versus Northrop Grumman’s focused technological edge.
Income Statement Comparison
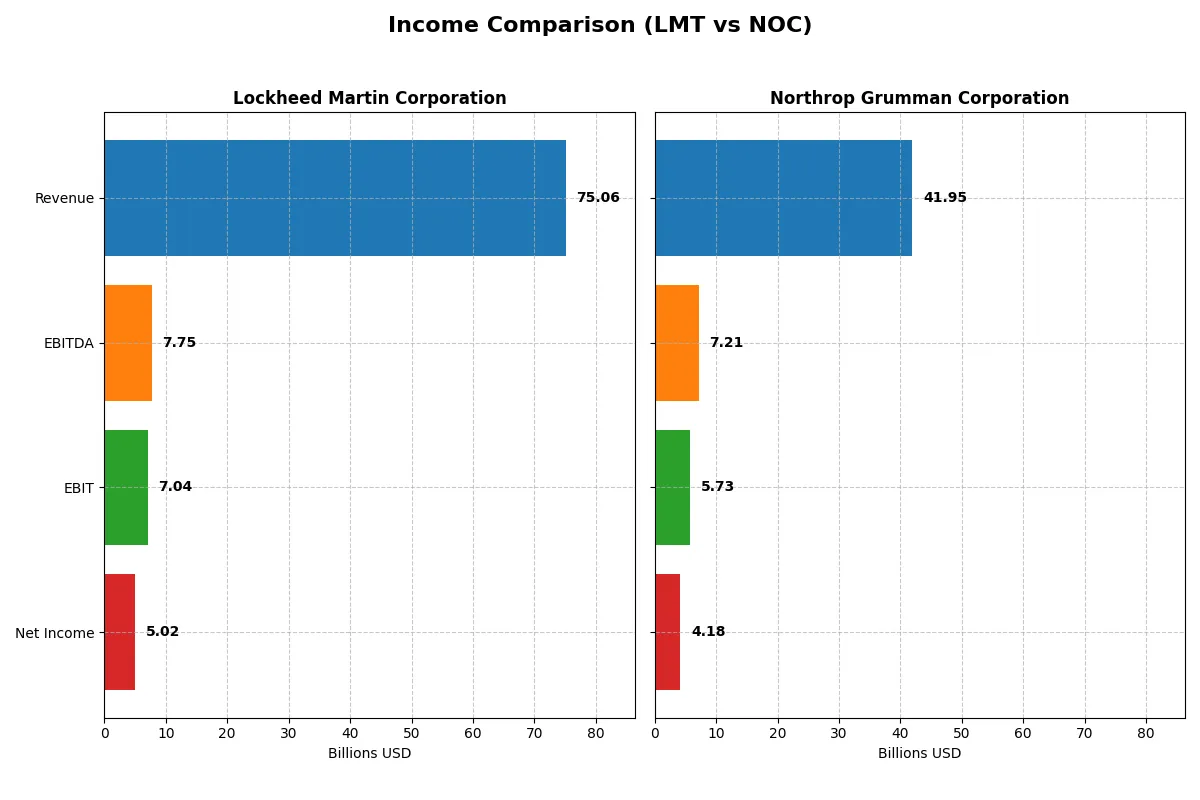
This data dissects the core profitability and scalability of both corporate engines to reveal who dominates the bottom line:
| Metric | Lockheed Martin (LMT) | Northrop Grumman (NOC) |
|---|---|---|
| Revenue | 75.1B | 41.9B |
| Cost of Revenue | 67.4B | 33.6B |
| Operating Expenses | -103M | 4.0B |
| Gross Profit | 7.6B | 8.3B |
| EBITDA | 7.8B | 7.2B |
| EBIT | 7.0B | 5.7B |
| Interest Expense | 1.1B | 665M |
| Net Income | 5.0B | 4.2B |
| EPS | 21.56 | 29.14 |
| Fiscal Year | 2025 | 2025 |
Income Statement Analysis: The Bottom-Line Duel
The following income statement comparison reveals each company’s operational efficiency and profit generation over recent years.
Lockheed Martin Corporation Analysis
Lockheed Martin’s revenue rose steadily from $67.6B in 2023 to $75.1B in 2025, reflecting modest growth. Gross margin narrowed to 10.15% by 2025, signaling cost pressures, while net margin remained favorable at 6.68%. Despite a 5.65% revenue increase in 2025, net income declined 6%, showing weakening profit momentum.
Northrop Grumman Corporation Analysis
Northrop Grumman’s revenue grew more slowly, from $39.3B in 2023 to $41.9B in 2025, with a 2.24% rise in 2025. Gross margin held strong near 19.8%, and net margin improved to 9.97%, indicating better cost control. Net income remained stable around $4.18B in 2025, supported by a modest 2.6% EPS growth, showing steady profitability.
Margin Discipline vs. Revenue Growth
Lockheed Martin outpaces Northrop Grumman in revenue scale and absolute net income, but faces margin compression and declining profitability. Northrop Grumman exhibits stronger margin health and stable EPS growth despite slower top-line gains. For investors, the choice hinges on preferring revenue-driven growth or disciplined margin management.
Financial Ratios Comparison
These vital ratios act as a diagnostic tool to expose the underlying fiscal health, valuation premiums, and capital efficiency for Lockheed Martin Corporation (LMT) and Northrop Grumman Corporation (NOC):
| Ratios | Lockheed Martin (LMT) | Northrop Grumman (NOC) |
|---|---|---|
| ROE | 74.6% | 25.1% |
| ROIC | 17.4% | 9.9% |
| P/E | 22.3 | 19.6 |
| P/B | 16.6 | 4.9 |
| Current Ratio | 1.09 | 1.10 |
| Quick Ratio | 0.94 | 1.10 |
| D/E | 0.17 | 0.11 |
| Debt-to-Assets | 2.0% | 3.6% |
| Interest Coverage | 6.9 | -6.8 |
| Asset Turnover | 1.25 | 0.82 |
| Fixed Asset Turnover | 8.46 | 3.27 |
| Payout ratio | 62.4% | 30.9% |
| Dividend yield | 2.80% | 1.58% |
| Fiscal Year | 2025 | 2025 |
Efficiency & Valuation Duel: The Vital Signs
Financial ratios serve as a company’s DNA, exposing hidden risks and operational strengths crucial for investment decisions.
Lockheed Martin Corporation
Lockheed Martin displays a robust ROE of 74.65% and a solid ROIC of 17.39%, signaling strong profitability and efficient capital use. Its P/E ratio of 22.26 suggests a fairly valued stock with a high price-to-book ratio of 16.62 marking a potential premium. The company supports shareholders with a favorable 2.8% dividend yield.
Northrop Grumman Corporation
Northrop Grumman shows a respectable ROE of 25.08% and a neutral ROIC at 9.93%, indicating moderate profitability and capital efficiency. Its P/E ratio of 19.57 reflects a reasonable valuation, while a lower price-to-book of 4.91 points to less premium pricing. Dividend yield stands at 1.58%, slightly less generous than its peer.
Premium Valuation vs. Operational Safety
Lockheed Martin offers superior profitability and stronger shareholder returns but trades at a higher valuation premium. Northrop Grumman presents a more conservative valuation with moderate returns. Investors seeking growth and income may prefer Lockheed Martin’s profile, while those prioritizing valuation discipline might lean toward Northrop Grumman.
Which one offers the Superior Shareholder Reward?
I see Lockheed Martin (LMT) offers a 2.8% dividend yield with a payout ratio near 62%, signaling a strong commitment to returning cash. Its free cash flow comfortably covers dividends and capex, supporting sustainability. LMT also executes steady buybacks, enhancing shareholder value. Northrop Grumman (NOC) yields a lower 1.6% with a conservative 31% payout ratio, prioritizing reinvestment and growth. However, NOC’s smaller buyback scale limits immediate returns. I judge LMT’s balanced dividend and buyback approach delivers a more attractive total shareholder return in 2026, combining yield and capital appreciation potential with sustainable cash flow coverage.
Comparative Score Analysis: The Strategic Profile
The radar chart reveals the fundamental DNA and trade-offs of Lockheed Martin and Northrop Grumman, highlighting their financial strengths and valuation nuances:
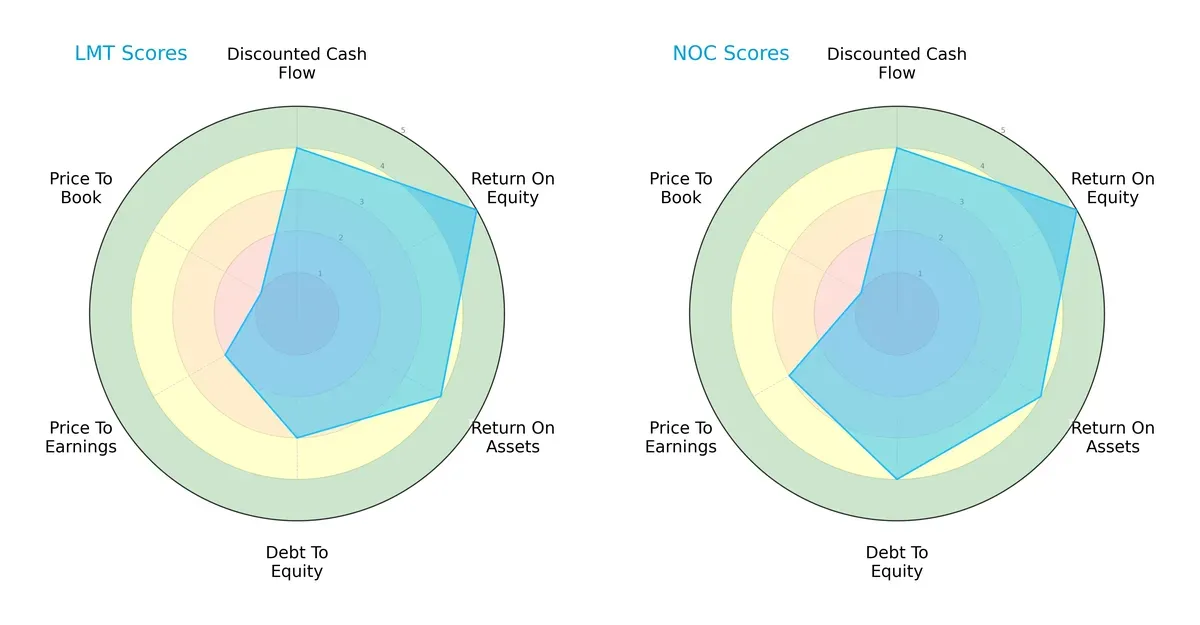
Lockheed Martin shows a balanced edge in Return on Equity (5) and Return on Assets (4), but weaker valuation metrics, especially Price-to-Book (1). Northrop Grumman matches LMT’s operational efficiency but has a stronger Debt-to-Equity score (4 vs. 3) and slightly better overall rating (4 vs. 3). Northrop leans more on financial stability, while Lockheed relies on profitability metrics.
Bankruptcy Risk: Solvency Showdown
The Altman Z-Scores place both companies firmly in the safe zone, indicating solid financial footing and low bankruptcy risk in this cycle:
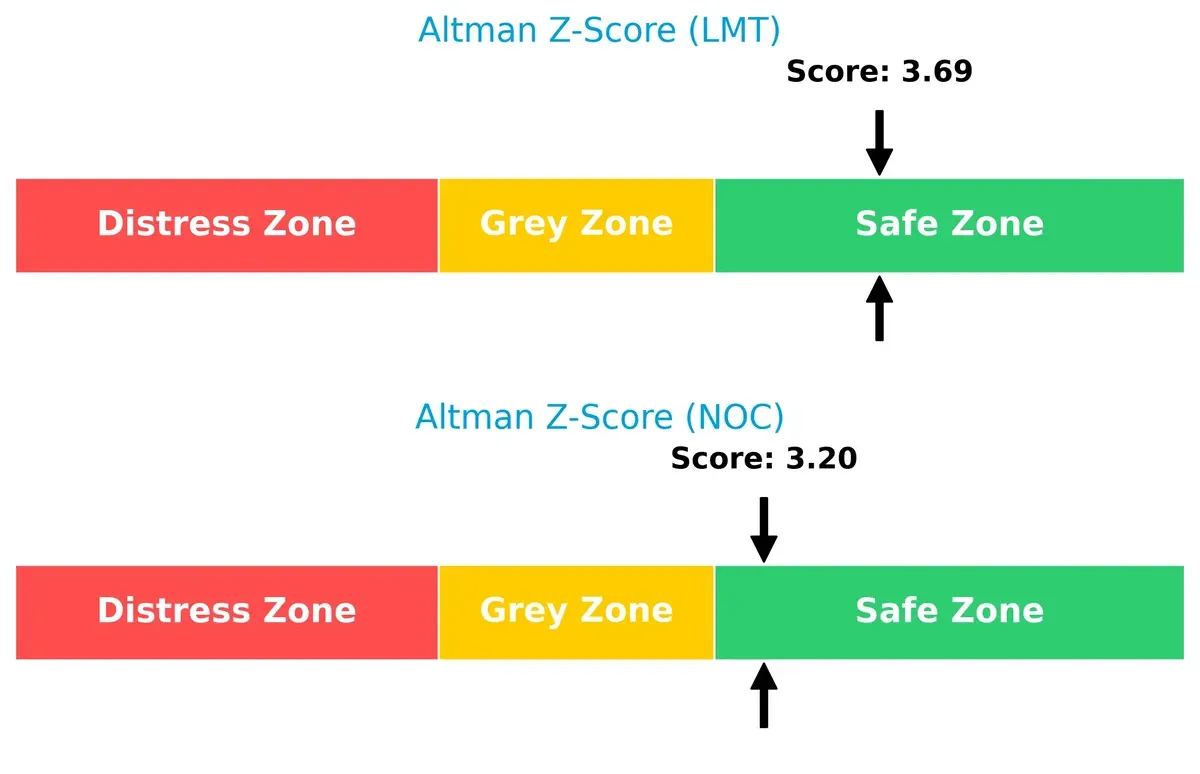
Lockheed Martin’s score stands at 3.69, slightly higher than Northrop Grumman’s 3.20, suggesting marginally better long-term solvency and lower distress risk under current market conditions.
Financial Health: Quality of Operations
Northrop Grumman’s Piotroski F-Score of 7 indicates strong financial health, surpassing Lockheed Martin’s average score of 6 and signaling more robust internal fundamentals:
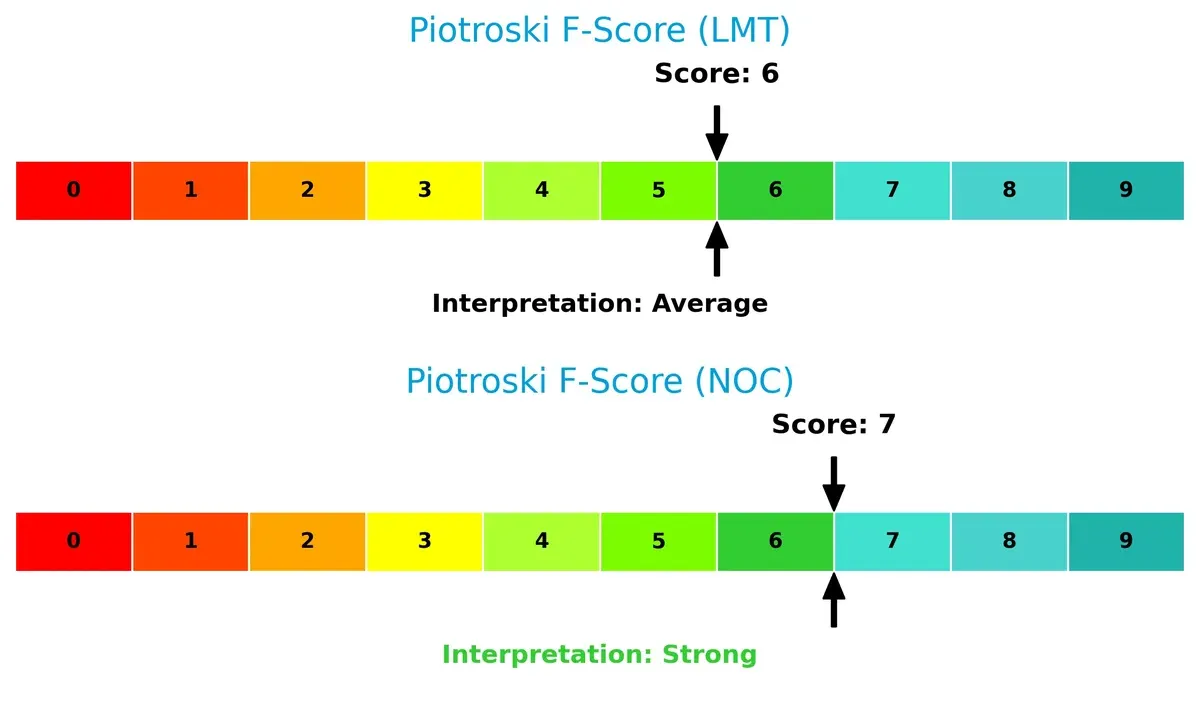
This difference highlights Northrop’s superior operational efficiency and financial quality, while Lockheed’s score warns of moderate caution in internal financial metrics.
How are the two companies positioned?
This section dissects the operational DNA of Lockheed Martin and Northrop Grumman by comparing their revenue distribution and internal strengths and weaknesses. The goal is to confront their economic moats to reveal which model offers the most resilient, sustainable competitive advantage in today’s aerospace and defense market.
Revenue Segmentation: The Strategic Mix
This visual comparison dissects how Lockheed Martin and Northrop Grumman diversify their income streams and reveals where their primary sector bets lie:
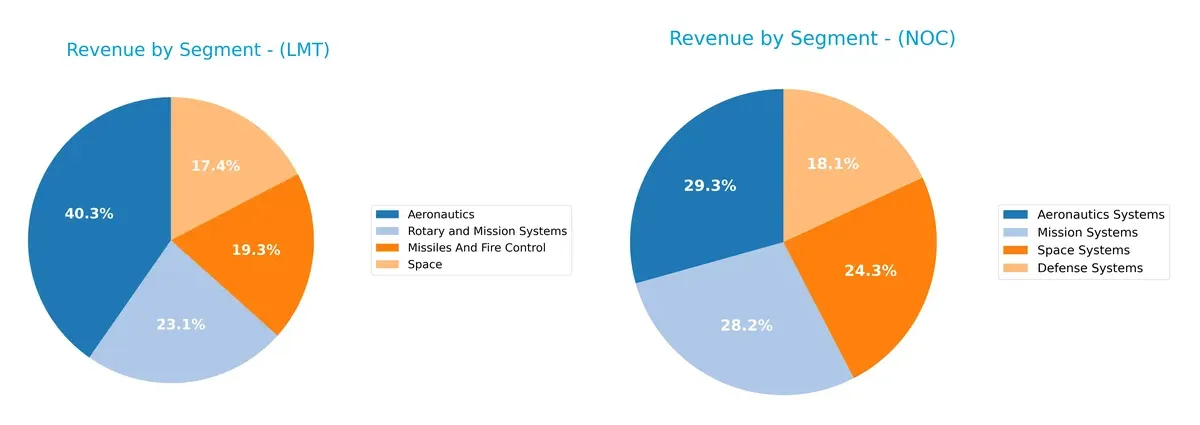
Lockheed Martin anchors revenue with Aeronautics at $30B, supported by three sizable segments totaling over $44B, reflecting balanced diversification. Northrop Grumman’s largest segment, Aeronautics Systems at $13B, competes closely with Mission and Space Systems, each around $11B. Northrop’s mix shows less concentration risk and emphasizes space and mission systems, hinting at a strategic pivot towards next-gen defense tech and ecosystem integration.
Strengths and Weaknesses Comparison
This table compares the Strengths and Weaknesses of Lockheed Martin Corporation (LMT) and Northrop Grumman Corporation (NOC):
LMT Strengths
- Diversified revenue across Aeronautics, Missiles, Rotary, and Space
- High ROE of 74.65% indicating strong profitability
- Favorable ROIC at 17.39% above WACC of 4.85% shows value creation
- Strong asset turnover ratios at 1.25 and fixed asset turnover at 8.46
- Robust dividend yield of 2.8% supports shareholder returns
- Global presence with significant US and Europe sales
NOC Strengths
- Balanced revenue in Aeronautics, Defense, Mission, and Space Systems
- ROE at 25.08% and neutral ROIC at 9.93%, maintaining profitability
- Favorable WACC at 4.51% supports efficient capital cost
- Good quick ratio of 1.1 and interest coverage at 8.62
- Favorable fixed asset turnover at 3.27 indicates effective asset use
- Solid US market presence with growing geographic diversification
LMT Weaknesses
- High Price-to-Book ratio at 16.62 signals possible overvaluation
- Neutral net margin at 6.68% lower than NOC’s 9.97%
- Current and quick ratios near 1 indicate limited liquidity buffer
- Higher proportion of revenue concentrated in US limits geographic depth
NOC Weaknesses
- Price-to-Book ratio at 4.91 also suggests valuation concerns
- Neutral net margin despite higher ROE may reflect cost pressures
- Asset turnover at 0.82 below LMT’s reflects lower operational efficiency
- Smaller international revenue footprint compared to LMT
Lockheed Martin shows superior capital efficiency and diversification across segments but faces valuation and liquidity caution. Northrop Grumman balances profitability with moderate risks in asset use and geographic reach. Both companies rely heavily on the US market, impacting global diversification strategies.
The Moat Duel: Analyzing Competitive Defensibility
A structural moat shields long-term profits from relentless competitive pressures. Without it, earnings erode quickly. Let’s dissect the sources of competitive advantage for these two aerospace giants:
Lockheed Martin Corporation: Intangible Assets and Integration Mastery
Lockheed’s moat stems from its unparalleled government contracts and classified technology assets. This drives stable margins and a 12.5% ROIC premium over WACC. In 2026, expanding space and missile defense projects may deepen this advantage but watch for tightening defense budgets.
Northrop Grumman Corporation: Technological Innovation and Cost Efficiency
Northrop’s competitive edge lies in advanced aerospace systems and cost-efficient production. Though it lags Lockheed in scale, its 5.4% ROIC premium indicates value creation. Continued growth in autonomous systems offers promising expansion but margin pressure looms.
Moat Battle: Intangible Assets vs. Innovation Efficiency
Lockheed Martin holds a wider moat, leveraging scale and government ties to sustain superior returns despite declining ROIC trends. Northrop innovates efficiently but faces a narrower moat. Lockheed is better positioned to defend market share amid evolving defense priorities.
Which stock offers better returns?
The past year shows strong upward momentum for both Lockheed Martin and Northrop Grumman, with notable price gains and accelerating trends reflecting robust trading dynamics.
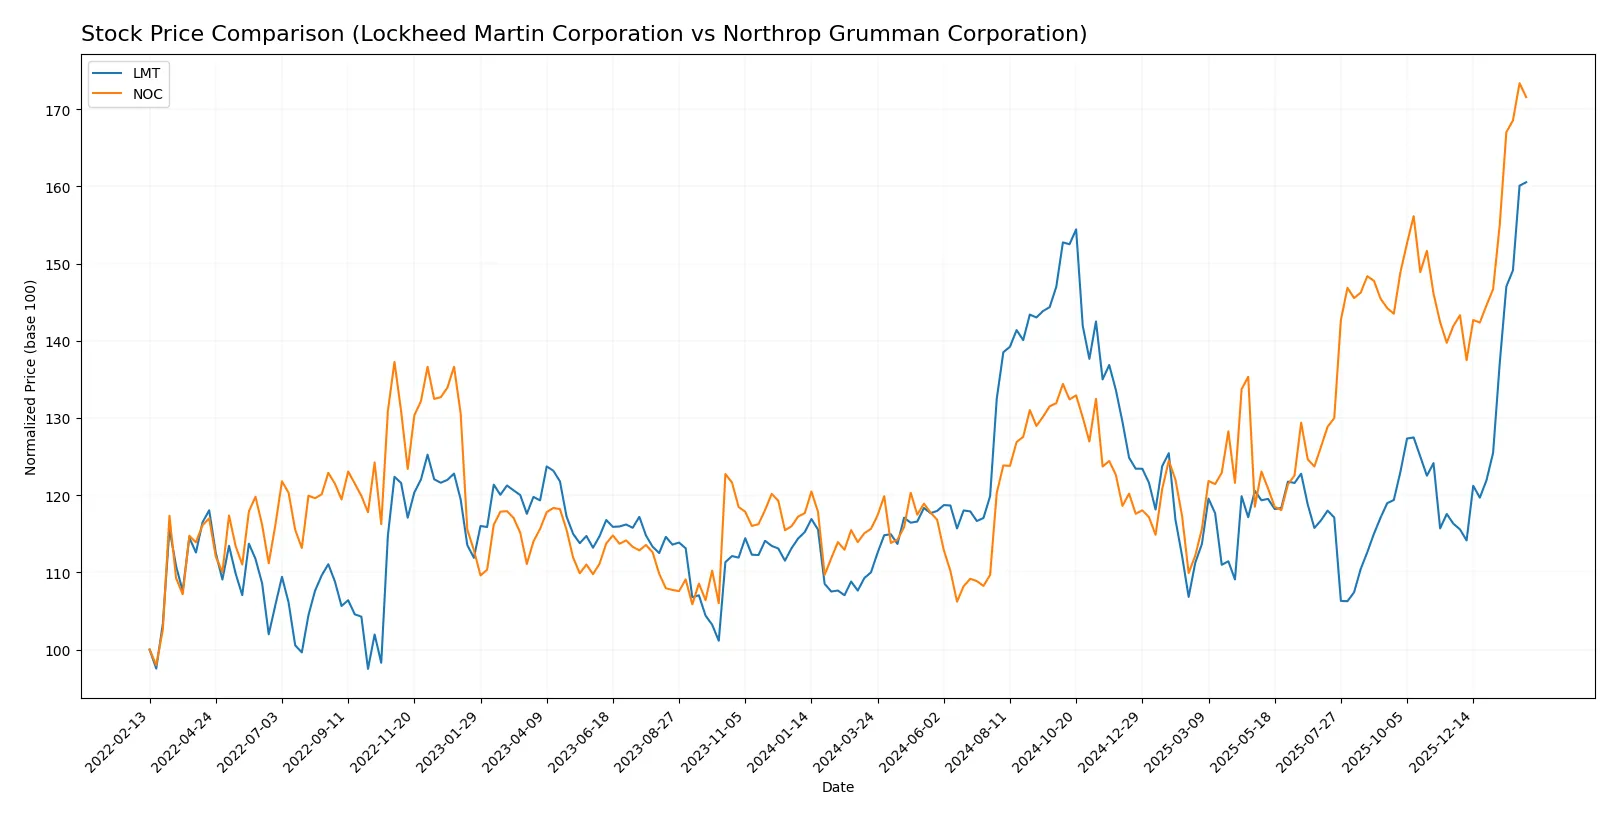
Trend Comparison
Lockheed Martin’s stock rose 45.93% over the past 12 months, marking a bullish trend with accelerating momentum. Prices ranged between 421.01 and 636.0, showing high volatility (std dev 49.72).
Northrop Grumman’s stock gained 48.35% in the same period, also bullish with acceleration. The price fluctuated from 424.09 to 692.26, accompanied by greater volatility (std dev 59.67).
Northrop Grumman slightly outperformed Lockheed Martin in market gains, delivering the highest return while both exhibit accelerating bullish trends.
Target Prices
Analysts show a positive outlook on aerospace giants Lockheed Martin and Northrop Grumman.
| Company | Target Low | Target High | Consensus |
|---|---|---|---|
| Lockheed Martin Corporation | 517 | 695 | 607 |
| Northrop Grumman Corporation | 623 | 815 | 732.25 |
Lockheed Martin’s consensus target sits slightly below its current price of 636, signaling modest upside or consolidation. Northrop Grumman’s target consensus at 732.25 suggests a stronger potential appreciation against its 685 price.

Don’t Let Luck Decide Your Entry Point
Optimize your entry points with our advanced ProRealTime indicators. You’ll get efficient buy signals with precise price targets for maximum performance. Start outperforming now!
How do institutions grade them?
Lockheed Martin Corporation Grades
The table below summarizes recent grade actions from reputable institutions for Lockheed Martin Corporation.
| Grading Company | Action | New Grade | Date |
|---|---|---|---|
| Goldman Sachs | maintain | Sell | 2026-02-02 |
| RBC Capital | maintain | Sector Perform | 2026-01-30 |
| TD Cowen | maintain | Hold | 2026-01-30 |
| UBS | maintain | Neutral | 2026-01-15 |
| Citigroup | maintain | Neutral | 2026-01-13 |
| Jefferies | maintain | Hold | 2026-01-12 |
| Truist Securities | upgrade | Buy | 2026-01-09 |
| JP Morgan | downgrade | Neutral | 2025-12-19 |
| Morgan Stanley | downgrade | Equal Weight | 2025-12-16 |
| UBS | maintain | Neutral | 2025-10-22 |
Northrop Grumman Corporation Grades
Below is the recent grading summary by established firms for Northrop Grumman Corporation.
| Grading Company | Action | New Grade | Date |
|---|---|---|---|
| B of A Securities | maintain | Buy | 2026-01-28 |
| BTIG | maintain | Buy | 2026-01-28 |
| UBS | maintain | Buy | 2026-01-28 |
| RBC Capital | maintain | Outperform | 2026-01-28 |
| Citigroup | maintain | Buy | 2026-01-28 |
| UBS | maintain | Buy | 2026-01-15 |
| Citigroup | maintain | Buy | 2026-01-13 |
| Truist Securities | downgrade | Hold | 2026-01-09 |
| Morgan Stanley | maintain | Overweight | 2025-12-16 |
| Alembic Global | upgrade | Overweight | 2025-12-15 |
Which company has the best grades?
Northrop Grumman consistently receives Buy and Outperform ratings from major firms, signaling stronger institutional confidence. Lockheed Martin’s grades lean towards Hold, Neutral, and Sell, indicating more cautious sentiment. This divergence may influence investors relying on analyst guidance to favor Northrop Grumman’s outlook.
Risks specific to each company
The following categories identify the critical pressure points and systemic threats facing both firms in the 2026 market environment:
1. Market & Competition
Lockheed Martin Corporation
- Dominates with diversified aerospace & defense segments but faces intense U.S. government dependency.
Northrop Grumman Corporation
- Strong in advanced aerospace systems but narrower product diversification increases exposure to sector shifts.
2. Capital Structure & Debt
Lockheed Martin Corporation
- Maintains low debt-to-equity at 0.17 and strong interest coverage (6.3), signaling financial stability.
Northrop Grumman Corporation
- Even lower debt-to-equity at 0.11 and superior interest coverage (8.62) indicate robust balance sheet resilience.
3. Stock Volatility
Lockheed Martin Corporation
- Beta of 0.23 shows limited volatility, appealing for risk-averse investors.
Northrop Grumman Corporation
- Remarkably low beta of 0.039 suggests exceptional stability amid market fluctuations.
4. Regulatory & Legal
Lockheed Martin Corporation
- Faces stringent U.S. and international defense regulations, with risks from export controls.
Northrop Grumman Corporation
- Similar regulatory environment but greater exposure to classified projects may heighten compliance risks.
5. Supply Chain & Operations
Lockheed Martin Corporation
- Complex global supply chains vulnerable to geopolitical tensions but mitigated by scale and integration.
Northrop Grumman Corporation
- Smaller scale heightens risk from supply disruptions, though innovation in autonomous systems offers operational flexibility.
6. ESG & Climate Transition
Lockheed Martin Corporation
- Moderate ESG risks; transitioning to greener technologies is ongoing but slower due to defense focus.
Northrop Grumman Corporation
- Slightly stronger ESG profile with investments in cyber and sustainable tech but still constrained by defense industry norms.
7. Geopolitical Exposure
Lockheed Martin Corporation
- High U.S. government reliance exposes it to shifts in defense budgets and foreign policy.
Northrop Grumman Corporation
- Also heavily dependent on U.S. contracts, but diversified ISR and strategic platforms provide some geopolitical hedge.
Which company shows a better risk-adjusted profile?
Lockheed Martin’s greatest risk lies in its heavy reliance on U.S. government contracts amid budget uncertainty. Northrop Grumman’s key risk centers on supply chain vulnerabilities due to smaller scale and complex product lines. Despite this, Northrop’s superior balance sheet metrics and exceptional stock stability yield a better risk-adjusted profile. Notably, Northrop’s beta of 0.039 underscores its resilience, while Lockheed’s high price-to-book ratio signals valuation risk.
Final Verdict: Which stock to choose?
Lockheed Martin’s superpower lies in its robust capital efficiency and superior return on equity. It consistently creates shareholder value despite a slightly declining profitability trend. Its moderate current ratio signals a point of vigilance on liquidity. This name suits portfolios focused on steady, long-term value creation with moderate risk tolerance.
Northrop Grumman commands a strategic moat through its strong free cash flow generation and solid interest coverage. Compared to Lockheed, it offers a slightly safer balance sheet and a stronger Piotroski score, reflecting financial health. This stock fits well within growth-at-a-reasonable-price (GARP) portfolios seeking stability alongside growth potential.
If you prioritize efficient capital deployment and high returns on equity, Lockheed Martin stands out due to its value creation despite some margin pressures. However, if you seek a more balanced risk profile with consistent free cash flow and operational stability, Northrop Grumman offers better stability and a compelling growth moat. Each choice aligns with distinct investor profiles and risk appetites.
Disclaimer: Investment carries a risk of loss of initial capital. The past performance is not a reliable indicator of future results. Be sure to understand risks before making an investment decision.
Go Further
I encourage you to read the complete analyses of Lockheed Martin Corporation and Northrop Grumman Corporation to enhance your investment decisions: