Warner Bros. Discovery, Inc. (WBD) and Live Nation Entertainment, Inc. (LYV) are two giants in the entertainment sector, each commanding strong positions yet focusing on distinct experiences—content creation versus live events. Both companies innovate to capture audience attention amid evolving consumer preferences and digital transformation. By comparing their market strategies and growth potential, I aim to help you identify which stock might be the more compelling addition to your investment portfolio.

Table of contents
Companies Overview
I will begin the comparison between Warner Bros. Discovery and Live Nation by providing an overview of these two companies and their main differences.
Warner Bros. Discovery Overview
Warner Bros. Discovery, Inc. is a global media and entertainment company operating through Studios, Network, and DTC segments. It produces and distributes films, television programs, and streaming content, leveraging a portfolio of popular brands like HBO, DC, and Warner Bros. Games. Headquartered in New York, it serves a broad audience with content across theaters, television, and digital platforms.
Live Nation Overview
Live Nation Entertainment, Inc. specializes in live entertainment, operating through Concerts, Ticketing, and Sponsorship & Advertising segments. It promotes live music events, manages venues, produces festivals, and provides ticketing services via Ticketmaster. Based in Beverly Hills, Live Nation focuses on live event experiences and related advertising, owning and operating numerous venues globally.
Key similarities and differences
Both companies belong to the communication services sector and operate in entertainment, but Warner Bros. Discovery centers on content creation and distribution across media formats, while Live Nation emphasizes live events and ticketing services. Warner Bros. Discovery’s business is broad across film, TV, and streaming, whereas Live Nation is concentrated on live music and event management with strong sponsorship and advertising components.
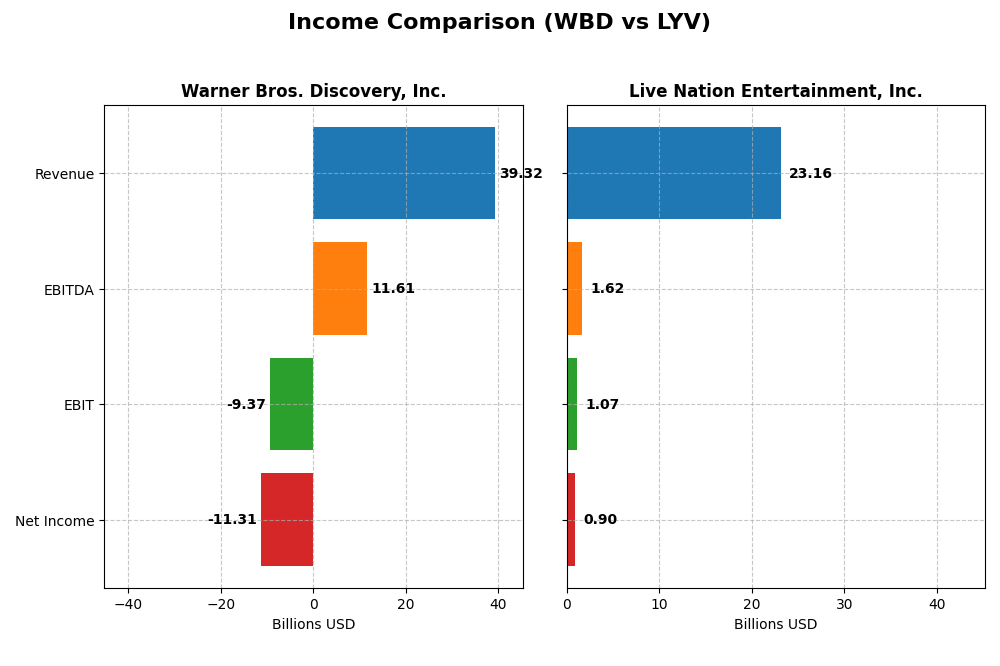
Income Statement Comparison
This table compares the key income statement metrics for Warner Bros. Discovery, Inc. and Live Nation Entertainment, Inc. for the fiscal year 2024.
| Metric | Warner Bros. Discovery, Inc. (WBD) | Live Nation Entertainment, Inc. (LYV) |
|---|---|---|
| Market Cap | 70.4B | 34.6B |
| Revenue | 39.3B | 23.2B |
| EBITDA | 11.6B | 1.62B |
| EBIT | -9.37B | 1.07B |
| Net Income | -11.3B | 896M |
| EPS | -4.62 | 2.77 |
| Fiscal Year | 2024 | 2024 |
Income Statement Interpretations
Warner Bros. Discovery, Inc.
Warner Bros. Discovery showed a 268% revenue growth from 2020 to 2024, yet net income declined sharply, with a 1028% drop over the same period. Gross margin remains favorable at 41.58%, but EBIT and net margins are negative, reflecting high expenses. In 2024, revenue fell 4.8%, and profitability worsened with net income down significantly, indicating margin pressures.
Live Nation Entertainment, Inc.
Live Nation demonstrated a strong overall revenue increase of 1144% from 2020 to 2024, accompanied by a 152% net income rise. Gross margin at 25.17% is solid, with EBIT and net margins positive and stable. The 2024 year saw modest 1.9% revenue growth, improved net margin by 58%, but a slight EBIT decline, showing mixed but generally favorable margin dynamics.
Which one has the stronger fundamentals?
Live Nation’s fundamentals appear stronger with a majority of favorable income statement metrics, including positive margins, significant net income growth, and improving profitability in 2024. Conversely, Warner Bros. Discovery faces adverse margin trends and declining net income despite revenue growth, leading to an overall unfavorable income statement evaluation.
Financial Ratios Comparison
The following table presents a side-by-side comparison of key financial ratios for Warner Bros. Discovery, Inc. and Live Nation Entertainment, Inc. for the fiscal year 2024.
| Ratios | Warner Bros. Discovery, Inc. (WBD) | Live Nation Entertainment, Inc. (LYV) |
|---|---|---|
| ROE | -33.2% | 517.3% |
| ROIC | -11.0% | 7.7% |
| P/E | -2.29 | 33.25 |
| P/B | 0.76 | 172.0 |
| Current Ratio | 0.89 | 0.99 |
| Quick Ratio | 0.89 | 0.99 |
| D/E (Debt-to-Equity) | 1.26 | 47.74 |
| Debt-to-Assets | 41.1% | 42.1% |
| Interest Coverage | -4.97 | 2.53 |
| Asset Turnover | 0.38 | 1.18 |
| Fixed Asset Turnover | 6.46 | 5.70 |
| Payout Ratio | 0 | 0 |
| Dividend Yield | 0 | 0 |
Interpretation of the Ratios
Warner Bros. Discovery, Inc.
Warner Bros. Discovery shows mostly weak financial ratios in 2024, with significant negative returns on equity (-33.23%) and invested capital (-11.0%), and a low current ratio of 0.89 indicating liquidity concerns. Favorable metrics include a low price-to-book ratio (0.76) and a solid fixed asset turnover (6.46). The company does not pay dividends, likely reflecting its negative profitability and focus on restructuring or reinvestment.
Live Nation Entertainment, Inc.
Live Nation presents a mixed ratio profile in 2024, with a strong return on equity at 517.3% and favorable asset turnover (1.18), yet faces unfavorable price multiples (PE 33.25, PB 172) and a high debt-to-equity ratio (47.74). The current ratio at 0.99 is slightly weak. Live Nation also does not pay dividends, consistent with its reinvestment strategy and emphasis on growth and operational expansion.
Which one has the best ratios?
Comparing both, Live Nation’s ratios are slightly more favorable overall, driven by extraordinary equity returns and efficient asset use, despite high valuation and leverage concerns. Warner Bros. Discovery exhibits more unfavorable results, especially in profitability and liquidity metrics. Neither company distributes dividends, reflecting distinct strategic priorities and financial challenges.
Strategic Positioning
This section compares the strategic positioning of Warner Bros. Discovery, Inc. (WBD) and Live Nation Entertainment, Inc. (LYV) regarding market position, key segments, and exposure to technological disruption:
Warner Bros. Discovery, Inc.
- Operates globally in media and entertainment with strong brand portfolio, facing high competitive pressure.
- Diversified segments: Studios, Network, DTC streaming services, advertising, and content licensing driving revenue.
- Exposure includes streaming and digital distribution; adapts through direct-to-consumer services and gaming.
Live Nation Entertainment, Inc.
- Operates live entertainment globally, owning and managing venues, with moderate competitive pressure.
- Concentrated segments: Concerts, Ticketing, Sponsorship & Advertising as main business drivers.
- Exposure tied to live events and ticketing technologies; focuses on venue and digital ticketing innovations.
Warner Bros. Discovery, Inc. vs Live Nation Entertainment, Inc. Positioning
WBD adopts a diversified media and entertainment strategy across multiple content platforms and distribution channels, offering broad revenue streams but facing intense competition. LYV focuses on live entertainment and related services, concentrating on event promotion and ticketing with operational venue control, which may limit diversification but enhances specialization.
Which has the best competitive advantage?
Based on MOAT evaluation, both companies are shedding value with ROIC below WACC. LYV shows improving profitability with a growing ROIC trend, whereas WBD has a declining ROIC trend, indicating LYV may have a slightly stronger competitive advantage despite current value destruction.
Stock Comparison
The stock price chart highlights significant bullish momentum for Warner Bros. Discovery, Inc. (WBD) and Live Nation Entertainment, Inc. (LYV) over the past 12 months, with notable acceleration in gains and distinct trading volume dynamics.
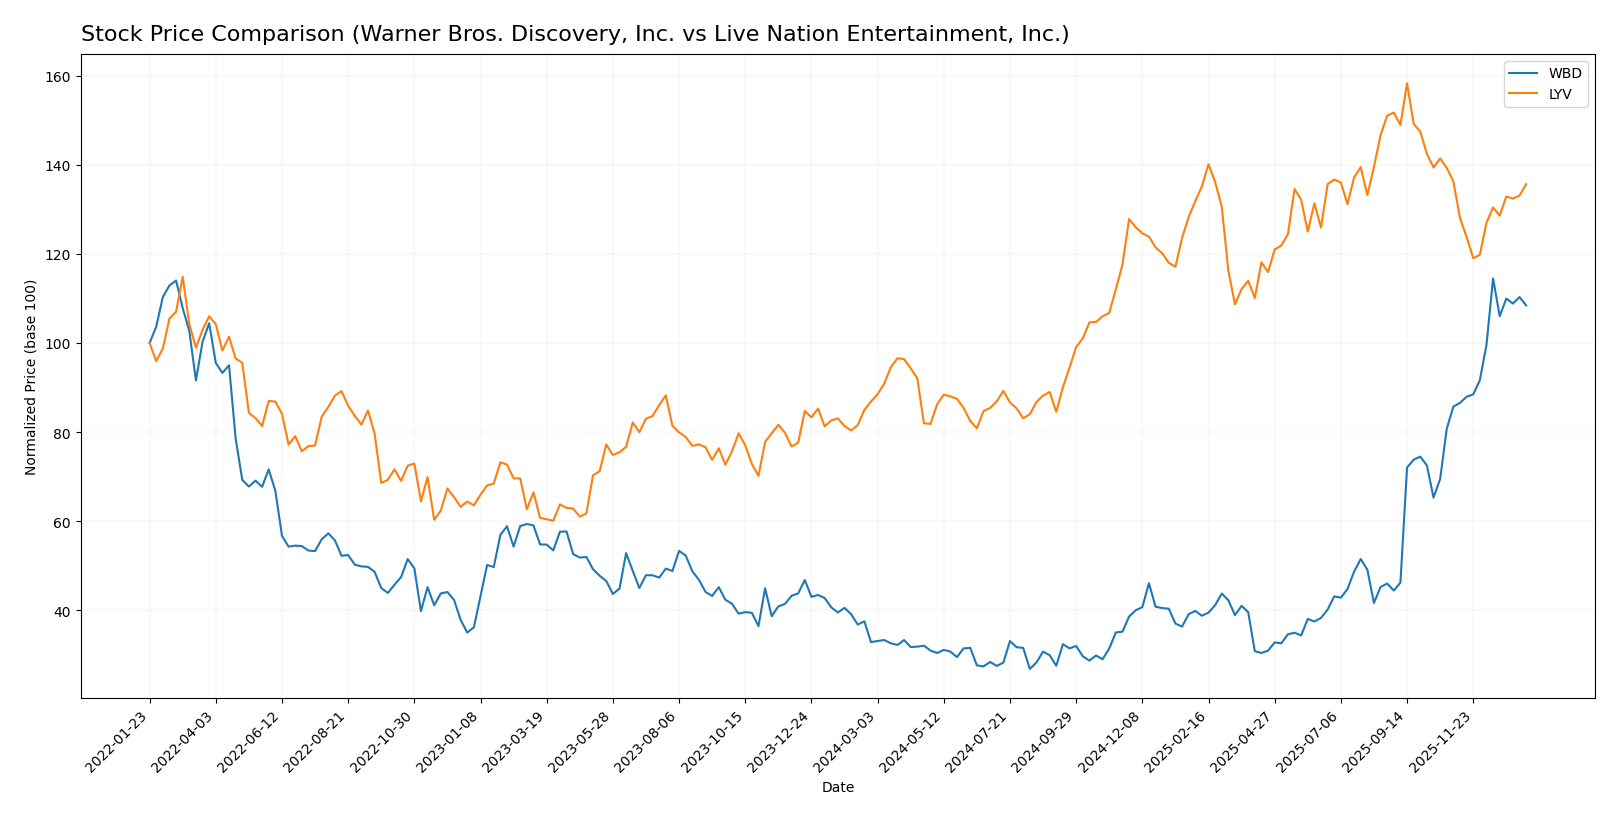
Trend Analysis
Warner Bros. Discovery, Inc. (WBD) showed a strong bullish trend with a 229.85% price increase over the past year, accompanied by accelerating gains and a moderate volatility level (std deviation 6.02). The stock’s price ranged from 7.03 to 29.98.
Live Nation Entertainment, Inc. (LYV) also exhibited a bullish trend with a 56.16% price increase over the same period, showing acceleration but with higher volatility (std deviation 23.63). Its price fluctuated between 88.75 and 173.73.
Comparatively, WBD delivered the highest market performance with a substantially larger price increase and stronger buyer dominance in recent trading, outperforming LYV’s gains.
Target Prices
The current analyst consensus presents a cautiously optimistic outlook for both Warner Bros. Discovery, Inc. and Live Nation Entertainment, Inc.
| Company | Target High | Target Low | Consensus |
|---|---|---|---|
| Warner Bros. Discovery, Inc. | 29.5 | 16 | 23.68 |
| Live Nation Entertainment, Inc. | 195 | 164 | 180.13 |
Analysts expect Warner Bros. Discovery to trade slightly below the consensus target, with the current price at $28.4, close to the high end. Live Nation’s consensus target of $180.13 significantly exceeds its current price of $148.85, indicating potential upside.
Analyst Opinions Comparison
This section compares analysts’ ratings and grades for Warner Bros. Discovery, Inc. (WBD) and Live Nation Entertainment, Inc. (LYV):
Rating Comparison
WBD Rating
- Rating: B- with a very favorable status.
- Discounted Cash Flow Score: Moderate at 3 out of 5.
- ROE Score: Moderate at 2 out of 5.
- ROA Score: Moderate at 2 out of 5.
- Debt To Equity Score: Favorable at 4 out of 5.
- Overall Score: Moderate at 3 out of 5.
LYV Rating
- Rating: C+ with a very favorable status.
- Discounted Cash Flow Score: Very unfavorable at 1 out of 5.
- ROE Score: Very favorable at 5 out of 5.
- ROA Score: Favorable at 4 out of 5.
- Debt To Equity Score: Very unfavorable at 1 out of 5.
- Overall Score: Moderate at 2 out of 5.
Which one is the best rated?
Based strictly on the data, WBD holds a higher overall rating (B-) and a better overall score than LYV (C+). WBD also shows a stronger debt-to-equity score, indicating lower financial risk compared to LYV.
Scores Comparison
Here is a comparison of the Altman Z-Score and Piotroski Score for Warner Bros. Discovery, Inc. and Live Nation Entertainment, Inc.:
WBD Scores
- Altman Z-Score: 0.88, in distress zone indicating high bankruptcy risk.
- Piotroski Score: 8, very strong financial health indication.
LYV Scores
- Altman Z-Score: 2.12, in grey zone indicating moderate bankruptcy risk.
- Piotroski Score: 5, average financial health indication.
Which company has the best scores?
Based on the provided data, WBD has a weaker Altman Z-Score but a much stronger Piotroski Score compared to LYV. LYV shows moderate bankruptcy risk but only average financial strength.
Grades Comparison
Here is the comparison of recent grades and ratings for Warner Bros. Discovery, Inc. and Live Nation Entertainment, Inc.:
Warner Bros. Discovery, Inc. Grades
This table summarizes recent grades assigned to Warner Bros. Discovery by reputable grading companies.
| Grading Company | Action | New Grade | Date |
|---|---|---|---|
| Seaport Global | Downgrade | Neutral | 2025-12-09 |
| Benchmark | Maintain | Buy | 2025-12-08 |
| Barrington Research | Downgrade | Market Perform | 2025-12-05 |
| Barrington Research | Maintain | Outperform | 2025-11-14 |
| Wells Fargo | Maintain | Equal Weight | 2025-11-07 |
| Rothschild & Co | Upgrade | Buy | 2025-10-30 |
| Argus Research | Upgrade | Buy | 2025-10-28 |
| Barrington Research | Maintain | Outperform | 2025-10-28 |
| Benchmark | Maintain | Buy | 2025-10-22 |
| Wells Fargo | Maintain | Equal Weight | 2025-10-16 |
Warner Bros. Discovery’s grades show a mixed trend with some downgrades balanced by several upgrades and maintained Buy or Outperform ratings.
Live Nation Entertainment, Inc. Grades
This table summarizes recent grades assigned to Live Nation Entertainment by reputable grading companies.
| Grading Company | Action | New Grade | Date |
|---|---|---|---|
| Evercore ISI Group | Maintain | Outperform | 2025-12-23 |
| Guggenheim | Maintain | Buy | 2025-11-18 |
| Evercore ISI Group | Maintain | Outperform | 2025-11-05 |
| Guggenheim | Maintain | Buy | 2025-11-05 |
| Roth Capital | Maintain | Buy | 2025-11-05 |
| JP Morgan | Maintain | Overweight | 2025-11-05 |
| Morgan Stanley | Maintain | Overweight | 2025-11-05 |
| Susquehanna | Maintain | Positive | 2025-11-03 |
| Deutsche Bank | Maintain | Buy | 2025-10-23 |
| Citigroup | Maintain | Buy | 2025-10-23 |
Live Nation Entertainment’s grades consistently reflect strong Buy and Outperform ratings, with no downgrades observed.
Which company has the best grades?
Live Nation Entertainment has received consistently stronger grades and more Buy and Outperform ratings compared to Warner Bros. Discovery’s mixed and more neutral or Hold consensus. This suggests investor sentiment is currently more favorable toward Live Nation, potentially indicating lower perceived risk or better growth prospects.
Strengths and Weaknesses
Below is a comparative overview of Warner Bros. Discovery, Inc. (WBD) and Live Nation Entertainment, Inc. (LYV) based on key business and financial criteria as of 2024.
| Criterion | Warner Bros. Discovery, Inc. (WBD) | Live Nation Entertainment, Inc. (LYV) |
|---|---|---|
| Diversification | High: Diverse revenue streams including advertising (8.1B), distribution (19.7B), content licensing (10.3B), and other services | Moderate: Focused on concerts (19.0B), ticketing (3.0B), and sponsorship/advertising (1.2B) |
| Profitability | Weak: Negative net margin (-28.8%), ROIC -11.0%, ROE -33.2%, value destroying with declining profitability | Improving: Positive net margin (3.9%), ROIC 7.7%, very high ROE (517.3%), but still slightly unfavorable overall |
| Innovation | Limited current data; media content focus may face disruption risks | Moderate: Live events and ticketing innovation, adapting to digital trends |
| Global presence | Strong: Extensive international networks and US networks revenue, large content distribution | Strong: Global concerts and event promotion footprint |
| Market Share | Significant in media and entertainment distribution | Leading in live events and ticketing services |
Key takeaways: WBD offers strong diversification but struggles with profitability and value creation, signaling caution for investors. LYV shows improving profitability and strong market positioning, though some financial ratios remain slightly unfavorable. Both companies have solid global presence but differ in business focus and financial health.
Risk Analysis
Below is a comparative risk table for Warner Bros. Discovery, Inc. (WBD) and Live Nation Entertainment, Inc. (LYV) based on the latest 2024 data:
| Metric | Warner Bros. Discovery, Inc. (WBD) | Live Nation Entertainment, Inc. (LYV) |
|---|---|---|
| Market Risk | High beta 1.57 indicates elevated volatility | Moderate beta 1.20 indicates moderate volatility |
| Debt Level | Debt-to-equity 1.26 (unfavorable); interest coverage negative (-4.65) | Debt-to-equity 47.74 (unfavorable); interest coverage moderate (3.27) |
| Regulatory Risk | Moderate risk due to global media regulation | Moderate risk from event and venue regulations |
| Operational Risk | Unfavorable current ratio 0.89 indicates liquidity stress | Unfavorable current ratio 0.99, near liquidity concern threshold |
| Environmental Risk | Moderate, typical for entertainment industry | Moderate, with venue operations subject to environmental policies |
| Geopolitical Risk | Exposure due to international content distribution | Exposure via international live events and venues |
In summary, WBD faces significant financial risks with high debt levels and weak liquidity, coupled with high market volatility. LYV presents moderate financial stress but benefits from stronger operational cash flow metrics. The most impactful risks are WBD’s liquidity and debt burden, while LYV’s exposure to event disruptions remains a concern. Caution is advised when considering these stocks.
Which Stock to Choose?
Warner Bros. Discovery, Inc. (WBD) shows a declining income trend with a negative net margin of -28.77% and unfavorable profitability ratios, including a -33.23% ROE and -11.0% ROIC. Its debt levels are moderate but interest coverage is poor, resulting in an overall very unfavorable financial ratio profile and a “Very Favorable” rating of B- despite challenges.
Live Nation Entertainment, Inc. (LYV) exhibits a more favorable income evolution with a positive net margin of 3.87% and strong profitability ratios, including a 517.3% ROE and 7.71% ROIC. Debt ratios are high and current ratios slightly unfavorable, yet the company maintains a slightly unfavorable global ratio status and a “Very Favorable” C+ rating.
From a rating and financial perspective, LYV might appear appealing for investors seeking growth due to its improving profitability and favorable income statement, while WBD could be seen as riskier given its declining returns and unfavorable ratios but may attract those focusing on value metrics. The choice could depend on an investor’s risk tolerance and strategy preference.
Disclaimer: Investment carries a risk of loss of initial capital. The past performance is not a reliable indicator of future results. Be sure to understand risks before making an investment decision.
Go Further
I encourage you to read the complete analyses of Warner Bros. Discovery, Inc. and Live Nation Entertainment, Inc. to enhance your investment decisions: