Live Nation Entertainment, Inc. (LYV) and TKO Group Holdings, Inc. (TKO) are two prominent players in the entertainment industry, each shaping live experiences and media content on a global scale. While Live Nation focuses heavily on concert promotion and ticketing, TKO combines live events with media production and consumer licensing. This comparison explores their market overlap and innovation strategies to help you identify the more compelling investment opportunity. Let’s dive in and find out which company stands out for your portfolio.
Table of contents
Companies Overview
I will begin the comparison between Live Nation Entertainment and TKO Group Holdings by providing an overview of these two companies and their main differences.
Live Nation Entertainment Overview
Live Nation Entertainment, Inc. is a leading live entertainment company operating through Concerts, Ticketing, and Sponsorship & Advertising segments. It promotes live music events, manages venues, produces festivals, and offers artist services globally. The Ticketing segment manages ticket sales and resale primarily via livenation.com and ticketmaster.com. The company owns or operates 259 venues worldwide and is headquartered in Beverly Hills, California.
TKO Group Holdings Overview
TKO Group Holdings, Inc. operates as a sports and entertainment company with four segments: Media and Content, Live Events, Sponsorships, and Consumer Products Licensing. It produces live events, TV programs, and video content distributed across multiple platforms globally. The company also merchandises video games, apparel, and memorabilia, and sells travel packages and tickets. TKO is based in New York City and is a subsidiary of Endeavor Group Holdings.
Key similarities and differences
Both companies operate within the entertainment industry and engage in live events and sponsorship advertising. Live Nation focuses heavily on music concerts, venue management, and ticketing services, while TKO has a broader scope including sports entertainment, media content production, and consumer product licensing. Live Nation has a larger workforce and venue ownership, whereas TKO emphasizes content creation and merchandising across diverse platforms.
Income Statement Comparison
The table below presents a side-by-side comparison of the most recent fiscal year income statement metrics for Live Nation Entertainment, Inc. and TKO Group Holdings, Inc.

| Metric | Live Nation Entertainment, Inc. (LYV) | TKO Group Holdings, Inc. (TKO) |
|---|---|---|
| Market Cap | 34.6B | 16.2B |
| Revenue | 23.2B | 2.8B |
| EBITDA | 1.62B | 676M |
| EBIT | 1.07B | 283M |
| Net Income | 896M | 9.4M |
| EPS | 2.77 | 0.12 |
| Fiscal Year | 2024 | 2024 |
Income Statement Interpretations
Live Nation Entertainment, Inc.
Live Nation’s revenue steadily increased from 6.3B in 2021 to 23.2B in 2024, with net income turning positive and reaching 647M in 2024. Gross margins are favorable at 25.17%, while EBIT and net margins remain neutral. In 2024, revenue growth slowed to 1.89%, EBIT declined by 15.68%, but net margin and EPS showed strong improvement, signaling margin recovery.
TKO Group Holdings, Inc.
TKO’s revenue rose sharply from 974M in 2020 to 2.8B in 2024, but net income showed volatility, dropping to a loss in 2023 before recovering modestly to 9.4M in 2024. Gross margin is favorable at 53.9%, with EBIT margin also favorable at 10.11%. The latest year saw strong revenue and gross profit growth, but EBIT declined 36.51%, with net margin remaining low at 0.34%.
Which one has the stronger fundamentals?
Live Nation demonstrates consistent long-term revenue and net income growth with improving margins and profitability, despite some recent EBIT contraction. TKO shows impressive top-line growth and strong gross and EBIT margins but struggles with net income volatility and low net margins. Live Nation’s overall margin stability and income growth suggest more robust fundamentals based on these income statement metrics.
Financial Ratios Comparison
Below is a comparison of key financial ratios for Live Nation Entertainment, Inc. (LYV) and TKO Group Holdings, Inc. (TKO) based on their most recent fiscal year data (2024).
| Ratios | Live Nation Entertainment, Inc. (LYV) | TKO Group Holdings, Inc. (TKO) |
|---|---|---|
| ROE | 5.17% | 0.23% |
| ROIC | 7.71% | 1.28% |
| P/E | 33.25 | 1,228.66 |
| P/B | 172.00 | 2.83 |
| Current Ratio | 0.99 | 1.30 |
| Quick Ratio | 0.99 | 1.30 |
| D/E (Debt to Equity) | 47.74 | 0.74 |
| Debt-to-Assets | 42.12% | 23.90% |
| Interest Coverage | 2.53 | 3.11 |
| Asset Turnover | 1.18 | 0.22 |
| Fixed Asset Turnover | 5.70 | 3.48 |
| Payout Ratio | 0% | 7.15% |
| Dividend Yield | 0% | 0.58% |
Interpretation of the Ratios
Live Nation Entertainment, Inc.
Live Nation’s ratios show a mixed picture with several unfavorable metrics such as net margin (3.87%), price-to-book (172.0), and current ratio (0.99), indicating liquidity concerns and valuation risks. However, return on equity stands out at 517.3%, suggesting strong shareholder value creation. The company does not pay dividends, likely reinvesting earnings to support growth and operations, as reflected in its free cash flow to equity being negative.
TKO Group Holdings, Inc.
TKO exhibits weak profitability ratios, with net margin at 0.34%, return on equity at 0.23%, and return on invested capital at 1.28%, all unfavorable. Its weighted average cost of capital is favorable at 4.81%, and liquidity ratios like quick ratio (1.3) are sound. TKO pays dividends, though with a low yield of 0.58%, and risks arise from a very high price-to-earnings ratio (1228.66) and modest interest coverage, signaling potential financial strain.
Which one has the best ratios?
Both companies have slightly unfavorable global ratio evaluations, but Live Nation shows stronger profitability and asset turnover ratios, albeit with liquidity and valuation concerns. TKO has better liquidity and debt metrics but suffers from weak profitability and high valuation multiples. The assessment depends on investor priorities between profitability and financial stability.
Strategic Positioning
This section compares the strategic positioning of Live Nation Entertainment, Inc. and TKO Group Holdings, Inc., focusing on Market position, Key segments, and Exposure to technological disruption:
Live Nation Entertainment, Inc.
- Leading live entertainment company with strong venue ownership; faces competition in concert promotion and ticketing.
- Key segments: Concerts (largest revenue driver), Ticketing, Sponsorship & Advertising.
- Limited explicit exposure to technological disruption mentioned; operates ticketing software and digital advertising platforms.
TKO Group Holdings, Inc.
- Sports and entertainment firm focused on media, live events, and consumer products licensing; operates globally in 170 countries.
- Key segments: Media and Content, Live Events, Sponsorships, Consumer Products Licensing.
- Utilizes digital and social media platforms extensively; involved in digital goods and content integration, indicating higher tech exposure.
Live Nation Entertainment, Inc. vs TKO Group Holdings, Inc. Positioning
Live Nation maintains a concentrated focus on live music events and ticketing with strong venue control, while TKO pursues a diversified portfolio across media, live events, and consumer licensing globally. Live Nation’s scale in concerts contrasts with TKO’s broader content and merchandise approach.
Which has the best competitive advantage?
Based on MOAT evaluation, Live Nation holds a slightly unfavorable position with growing profitability, while TKO’s very unfavorable rating and declining profitability indicate a weaker competitive advantage. Live Nation’s improving ROIC suggests a comparatively stronger moat.
Stock Comparison
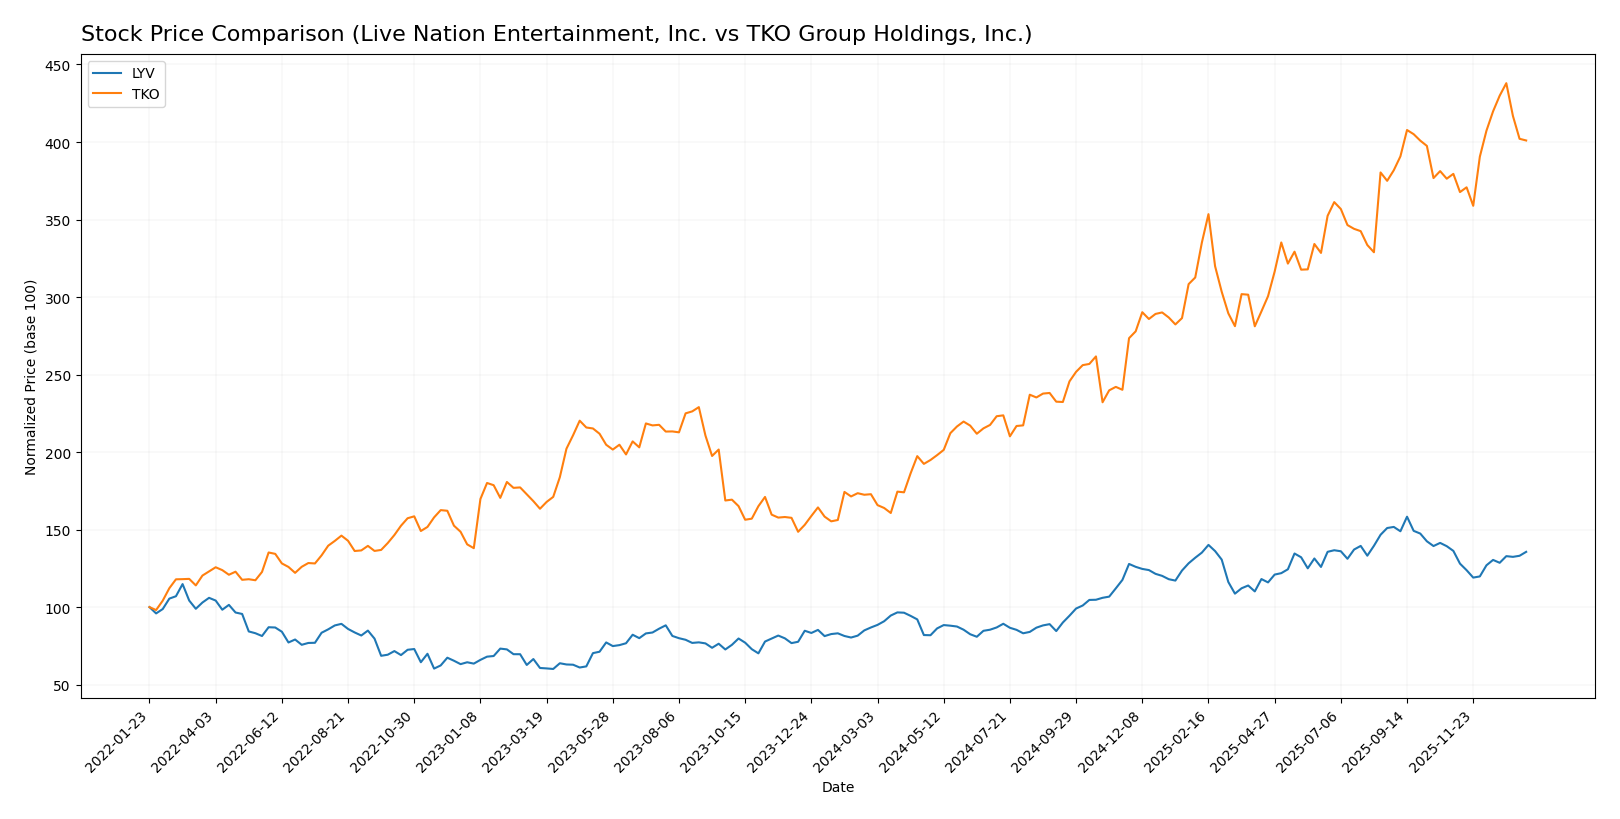
The stock price movements of Live Nation Entertainment, Inc. (LYV) and TKO Group Holdings, Inc. (TKO) over the past 12 months show significant bullish trends with notable price appreciations and distinct trading volume dynamics.
Trend Analysis
Live Nation Entertainment, Inc. (LYV) exhibited a strong bullish trend over the past 12 months with a 56.16% price increase and accelerating momentum. The stock ranged between 88.75 and 173.73, with overall volatility reflected by a 23.63 standard deviation.
TKO Group Holdings, Inc. (TKO) showed an even stronger bullish trend, gaining 132.01% over the same period with acceleration. The stock recorded a high of 217.44 and a low of 79.79, accompanied by higher volatility at 36.57 standard deviation.
Comparing both stocks, TKO delivered the highest market performance with a 132.01% gain, outperforming LYV’s 56.16% increase over the past year.
Target Prices
The current analyst consensus reflects positive outlooks for both Live Nation Entertainment, Inc. and TKO Group Holdings, Inc.
| Company | Target High | Target Low | Consensus |
|---|---|---|---|
| Live Nation Entertainment, Inc. | 195 | 164 | 180.13 |
| TKO Group Holdings, Inc. | 250 | 210 | 228.1 |
Analysts expect Live Nation’s stock to rise from its current price of $148.85 toward the consensus target of $180.13. TKO’s consensus target of $228.1 also suggests upside from its current price near $199.09.
Analyst Opinions Comparison
This section compares analysts’ ratings and grades for Live Nation Entertainment, Inc. (LYV) and TKO Group Holdings, Inc. (TKO):
Rating Comparison
LYV Rating
- Rating: C+ with a very favorable overall evaluation.
- Discounted Cash Flow Score: 1, assessed as very unfavorable.
- ROE Score: 5, rated very favorable for efficient profit generation.
- ROA Score: 4, favorable for asset utilization.
- Debt To Equity Score: 1, very unfavorable indicating higher financial risk.
- Overall Score: 2, considered moderate.
TKO Rating
- Rating: B- with a very favorable overall evaluation.
- Discounted Cash Flow Score: 4, assessed as favorable.
- ROE Score: 3, rated moderate for profit efficiency.
- ROA Score: 3, moderate in asset utilization.
- Debt To Equity Score: 2, moderate indicating lower risk.
- Overall Score: 2, considered moderate.
Which one is the best rated?
Based strictly on the provided data, TKO holds a better rating (B-) compared to LYV’s C+. TKO shows stronger discounted cash flow and lower financial risk, while LYV excels in ROE and ROA but faces challenges with debt and valuation scores.
Scores Comparison
Here is a comparison of the Altman Z-Score and Piotroski Score for Live Nation Entertainment, Inc. (LYV) and TKO Group Holdings, Inc. (TKO):
LYV Scores
- Altman Z-Score: 2.12, indicating moderate bankruptcy risk in the grey zone.
- Piotroski Score: 5, reflecting average financial strength.
TKO Scores
- Altman Z-Score: 2.17, indicating moderate bankruptcy risk in the grey zone.
- Piotroski Score: 6, reflecting average financial strength.
Which company has the best scores?
Based strictly on the provided data, TKO has slightly higher scores in both Altman Z-Score and Piotroski Score compared to LYV, suggesting marginally better financial health. Both remain in the grey zone and average categories, respectively.
Grades Comparison
Here is a comparison of the recent grades assigned to Live Nation Entertainment, Inc. and TKO Group Holdings, Inc.:
Live Nation Entertainment, Inc. Grades
The following table summarizes recent grades from reputable grading companies for Live Nation Entertainment, Inc.:
| Grading Company | Action | New Grade | Date |
|---|---|---|---|
| Evercore ISI Group | Maintain | Outperform | 2025-12-23 |
| Guggenheim | Maintain | Buy | 2025-11-18 |
| Evercore ISI Group | Maintain | Outperform | 2025-11-05 |
| Guggenheim | Maintain | Buy | 2025-11-05 |
| Roth Capital | Maintain | Buy | 2025-11-05 |
| JP Morgan | Maintain | Overweight | 2025-11-05 |
| Morgan Stanley | Maintain | Overweight | 2025-11-05 |
| Susquehanna | Maintain | Positive | 2025-11-03 |
| Deutsche Bank | Maintain | Buy | 2025-10-23 |
| Citigroup | Maintain | Buy | 2025-10-23 |
Overall, Live Nation Entertainment, Inc. has consistently received positive grades, predominantly “Buy” and “Outperform,” reflecting a stable favorable outlook from major grading firms.
TKO Group Holdings, Inc. Grades
The following table shows recent grades from recognized grading companies for TKO Group Holdings, Inc.:
| Grading Company | Action | New Grade | Date |
|---|---|---|---|
| BTIG | Maintain | Buy | 2025-12-31 |
| Susquehanna | Maintain | Positive | 2025-12-10 |
| TD Cowen | Maintain | Buy | 2025-12-08 |
| JP Morgan | Maintain | Overweight | 2025-12-02 |
| BTIG | Maintain | Buy | 2025-11-18 |
| Seaport Global | Upgrade | Buy | 2025-10-15 |
| BTIG | Maintain | Buy | 2025-10-10 |
| Bernstein | Maintain | Outperform | 2025-10-06 |
| Guggenheim | Maintain | Buy | 2025-10-03 |
| Morgan Stanley | Maintain | Equal Weight | 2025-09-25 |
TKO Group Holdings, Inc. likewise maintains a generally positive rating trend, with multiple “Buy” and “Outperform” grades, though with some variation including an “Equal Weight” rating.
Which company has the best grades?
Both Live Nation Entertainment, Inc. and TKO Group Holdings, Inc. have predominantly received “Buy” and equivalent positive grades, reflecting favorable analyst sentiment. Live Nation shows slightly more consistency with repeated “Outperform” and “Overweight” assessments, potentially signaling steadier investor confidence compared to TKO’s occasional neutral rating. This variation may influence investor perception of relative risk and growth expectations.
Strengths and Weaknesses
Below is a comparison of key strengths and weaknesses for Live Nation Entertainment, Inc. (LYV) and TKO Group Holdings, Inc. (TKO) based on the most recent data available.
| Criterion | Live Nation Entertainment, Inc. (LYV) | TKO Group Holdings, Inc. (TKO) |
|---|---|---|
| Diversification | Highly diversified revenue streams: Concerts (19B), Sponsorship & Advertising (1.2B), Ticketing (3B) | Limited product segmentation and revenue diversity; primarily focused on a narrower niche |
| Profitability | ROIC 7.71% (neutral), ROE 517.3% (favorable), net margin 3.87% (unfavorable) | ROIC 1.28% (unfavorable), ROE 0.23% (unfavorable), net margin 0.34% (unfavorable) |
| Innovation | Moderate innovation with growing ROIC trend (+133%) despite current value destruction | Declining ROIC trend (-91%), indicating weakening profitability and innovation challenges |
| Global presence | Extensive global footprint in live entertainment and ticketing markets | More regional/niche presence with less global scale |
| Market Share | Leading market share in live concerts and ticketing industries | Smaller market share and less competitive positioning |
Key takeaways: Live Nation demonstrates strong diversification and a leading market position with improving profitability trends despite current value destruction. In contrast, TKO struggles with low profitability, declining returns, and limited diversification, posing higher risks for investors.
Risk Analysis
Below is a comparative overview of key risks for Live Nation Entertainment, Inc. (LYV) and TKO Group Holdings, Inc. (TKO) based on the most recent data from 2024.
| Metric | Live Nation Entertainment, Inc. (LYV) | TKO Group Holdings, Inc. (TKO) |
|---|---|---|
| Market Risk | High beta (1.20) indicates above-market volatility. | Low beta (0.23) suggests lower market sensitivity. |
| Debt level | High debt-to-equity ratio (47.74) and 42.1% debt to assets. | Low debt-to-equity (0.74) and 23.9% debt to assets. |
| Regulatory Risk | Moderate, due to global venue operations and ticketing regulations. | Moderate, with international live events and content distribution. |
| Operational Risk | High, managing 259 venues worldwide and large employee base (16,200). | Moderate, smaller scale with 890 employees and diversified segments. |
| Environmental Risk | Potential exposure related to large-scale events and venue operations. | Lower, but risks tied to live events and media production footprint. |
| Geopolitical Risk | Exposure through international venues and tours. | Exposure via global media and event markets across 170 countries. |
The most impactful risks are Live Nation’s elevated market risk due to high beta and significant debt load, increasing financial vulnerability. TKO’s biggest concerns lie in operational scale and international market exposure, although it maintains lower leverage. Investors should weigh these factors carefully, considering recent moderate financial health scores and industry volatility.
Which Stock to Choose?
Live Nation Entertainment, Inc. (LYV) shows a favorable income statement with strong revenue and net income growth over 2020-2024, though recent revenue growth slowed. Its financial ratios present a slightly unfavorable picture with high debt levels and some weak valuation metrics, while profitability metrics like ROE are favorable. The company’s MOAT evaluation indicates value destruction but improving profitability, and its rating is very favorable with a moderate overall score.
TKO Group Holdings, Inc. (TKO) displays strong recent revenue growth and a favorable income statement overall, despite negative net income trends over the longer term. Financial ratios are slightly unfavorable, marked by moderate debt and weak profitability ratios. Its MOAT evaluation reveals significant value destruction with declining profitability. The company holds a very favorable rating with a moderate overall score and shows bullish price momentum with notable recent acceleration.
For investors prioritizing growth and recent strong revenue momentum, TKO might appear more attractive given its acceleration and favorable income trends in 2024. Conversely, investors focused on profitability and improving returns on equity may find LYV’s earnings growth and stronger profitability ratios more aligned with their profile. Both companies carry risks related to value creation and financial leverage, suggesting cautious evaluation depending on risk tolerance and investment strategy.
Disclaimer: Investment carries a risk of loss of initial capital. The past performance is not a reliable indicator of future results. Be sure to understand risks before making an investment decision.
Go Further
I encourage you to read the complete analyses of Live Nation Entertainment, Inc. and TKO Group Holdings, Inc. to enhance your investment decisions: