Home > Comparison > Communication Services > NFLX vs LYV
The strategic rivalry between Netflix, Inc. and Live Nation Entertainment, Inc. shapes the entertainment sector’s evolution. Netflix operates as a digital streaming powerhouse with a global subscriber base, while Live Nation excels as a live-event promoter and venue operator. This analysis pits Netflix’s scalable digital model against Live Nation’s asset-heavy event business, aiming to identify which corporate strategy delivers superior risk-adjusted returns for a diversified portfolio in today’s dynamic market environment.
Table of contents
Companies Overview
Netflix and Live Nation stand as titans in the entertainment world, shaping how audiences consume content and experiences.
Netflix, Inc.: Streaming Pioneer and Content Powerhouse
Netflix dominates the streaming entertainment market, generating revenue through subscriptions to its vast library of TV series, films, and mobile games. With around 222M paid members worldwide, its core growth engine is digital streaming across multiple devices. In 2026, Netflix remains focused on global content expansion and technological innovation to enhance user engagement.
Live Nation Entertainment, Inc.: Live Event Leader and Ticketing Giant
Live Nation commands the live entertainment ecosystem, earning from concerts, ticketing services, and sponsorships. It operates 259 venues globally and controls ticket sales through Ticketmaster. The company’s 2026 strategy emphasizes expanding live events, growing sponsorship deals, and leveraging digital ticketing platforms to boost fan access and artist partnerships.
Strategic Collision: Similarities & Divergences
Both firms excel in entertainment delivery, yet Netflix prioritizes digital streaming while Live Nation thrives on in-person experiences and ticketing infrastructure. Their main battleground is capturing audience attention—either on-screen or live. Netflix offers a scalable subscription model; Live Nation depends on event-driven revenues. This contrast defines their unique risk-return profiles in the evolving entertainment sector.
Income Statement Comparison
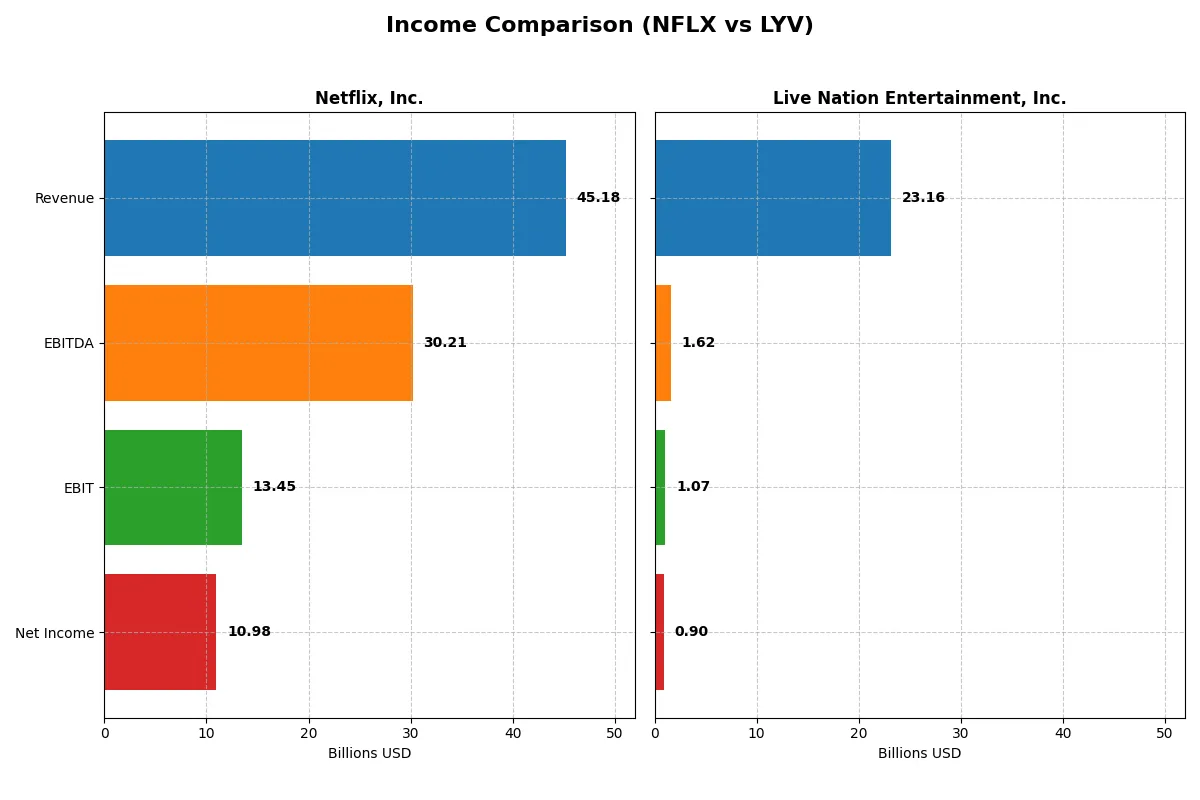
The following data dissects the core profitability and scalability of both corporate engines to reveal who dominates the bottom line:
| Metric | Netflix, Inc. (NFLX) | Live Nation Entertainment, Inc. (LYV) |
|---|---|---|
| Revenue | 45.2B | 23.2B |
| Cost of Revenue | 23.3B | 17.3B |
| Operating Expenses | 8.6B | 5.0B |
| Gross Profit | 21.9B | 5.8B |
| EBITDA | 30.2B | 1.6B |
| EBIT | 13.5B | 1.1B |
| Interest Expense | 777M | 326M |
| Net Income | 11.0B | 647M |
| EPS | 2.58 | 2.77 |
| Fiscal Year | 2025 | 2024 |
Income Statement Analysis: The Bottom-Line Duel
This income statement comparison exposes the true operational efficiency and profitability trends of two corporate engines.
Netflix, Inc. Analysis
Netflix’s revenue climbed from 29.7B in 2021 to 45.2B in 2025, with net income more than doubling to 11B. Gross margin strengthened to 48.5%, and net margin rose to 24.3%, signaling robust profitability. The 2025 surge highlights efficient cost control and growing scale, boosting EBIT margin to nearly 30%.
Live Nation Entertainment, Inc. Analysis
Live Nation’s revenue surged from 6.3B in 2021 to 23.2B in 2024, reflecting rapid growth. However, net margin remains slim at 3.9%, held back by heavy operating expenses. EBIT margin is modest at 4.6%, and 2024 showed a slight revenue slowdown with a 15.7% EBIT decline, suggesting margin pressure despite top-line gains.
Margin Power vs. Revenue Scale
Netflix delivers superior margin expansion and stable profit growth, while Live Nation impresses with explosive revenue gains but struggles on profitability. Netflix’s efficient cost structure and high net margins make it the fundamental winner. For investors prioritizing durable profits, Netflix presents a stronger, more attractive profile.
Financial Ratios Comparison
These vital ratios act as a diagnostic tool to expose the underlying fiscal health, valuation premiums, and capital efficiency of each company:
| Ratios | Netflix, Inc. (NFLX) | Live Nation Entertainment, Inc. (LYV) |
|---|---|---|
| ROE | 41.3% | 517.3% |
| ROIC | 25.2% | 7.7% |
| P/E | 36.1 | 33.2 |
| P/B | 14.9 | 172.0 |
| Current Ratio | 1.19 | 0.99 |
| Quick Ratio | 1.19 | 0.99 |
| D/E | 0.54 | 47.7 |
| Debt-to-Assets | 26.0% | 42.1% |
| Interest Coverage | 17.2 | 2.53 |
| Asset Turnover | 0.81 | 1.18 |
| Fixed Asset Turnover | 22.5 | 5.70 |
| Payout ratio | 0 | 0 |
| Dividend yield | 0 | 0 |
| Fiscal Year | 2025 | 2024 |
Efficiency & Valuation Duel: The Vital Signs
Financial ratios act as a company’s DNA, uncovering hidden risks and revealing operational excellence behind the surface.
Netflix, Inc.
Netflix demonstrates robust profitability with a 41.3% ROE and a strong 24.3% net margin, signaling efficient capital use. However, its valuation appears stretched, with a high 36.1 P/E and 14.9 P/B ratios. Netflix reinvests heavily in R&D and growth instead of paying dividends, fueling future expansion.
Live Nation Entertainment, Inc.
Live Nation posts an extraordinary 517.3% ROE but suffers from a slim 3.9% net margin, reflecting thin profitability. Its valuation is also stretched, marked by a 33.3 P/E and an extreme 172 P/B ratio. The company does not pay dividends, focusing on operational improvements and managing elevated debt levels.
Premium Valuation vs. Operational Safety
Netflix offers a better balance of profitability and operational efficiency, while Live Nation’s valuation and debt pose risks despite a high ROE. Investors prioritizing steady returns and reinvestment may lean toward Netflix; those seeking aggressive growth might consider Live Nation’s volatile profile.
Which one offers the Superior Shareholder Reward?
Netflix and Live Nation both pay no dividends, focusing shareholder rewards on share buybacks and reinvestment. Netflix’s buyback program is modest but supported by strong free cash flow of 2.2B per share, ensuring sustainability. Live Nation generates solid free cash flow (4.6B per share) but carries extreme financial leverage and a volatile solvency ratio, raising risk. Netflix’s disciplined capital allocation and healthier margins promise steadier returns. I conclude Netflix offers a superior total shareholder return profile in 2026 due to sustainable cash flow and prudent buyback execution.
Comparative Score Analysis: The Strategic Profile
The radar chart reveals the fundamental DNA and trade-offs of Netflix, Inc. and Live Nation Entertainment, Inc., highlighting their core financial strengths and weaknesses:
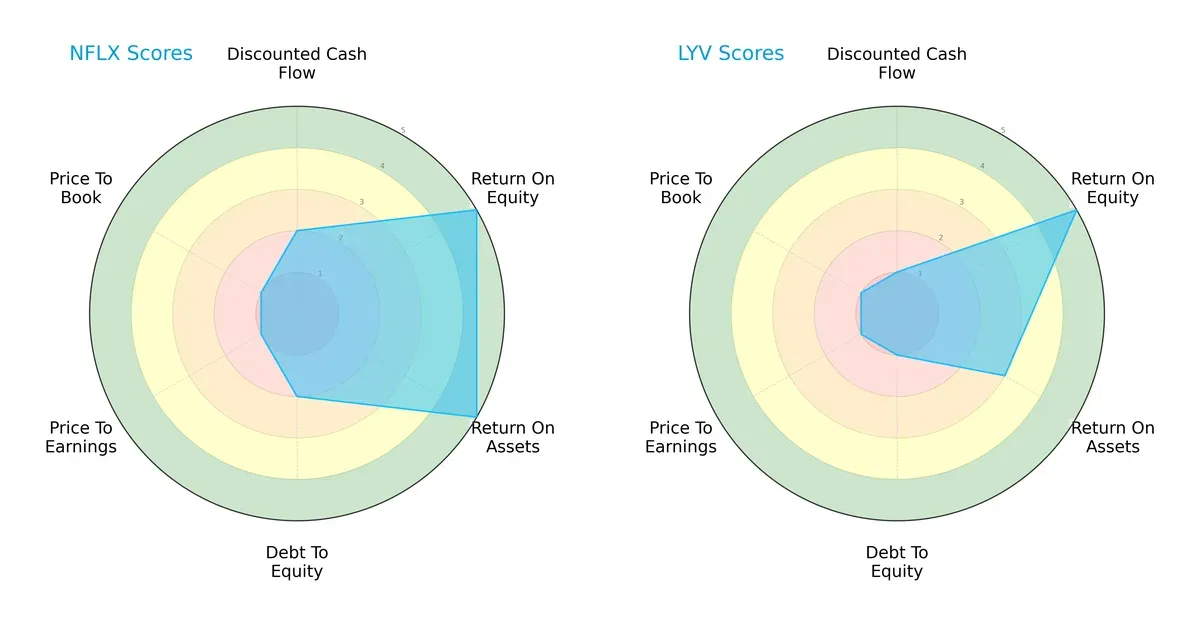
Netflix demonstrates a more balanced financial profile with strong ROE and ROA scores (5 each) and moderate DCF and debt-to-equity scores. In contrast, Live Nation leans heavily on robust ROE but shows weaker asset utilization and financial stability, reflected in its lower ROA (3) and debt-to-equity (1) scores. Both firms suffer in valuation metrics (PE/PB scores at 1), indicating market skepticism or overvaluation risks. Overall, Netflix’s profile appears more diversified, while Live Nation depends on a specific operational edge.
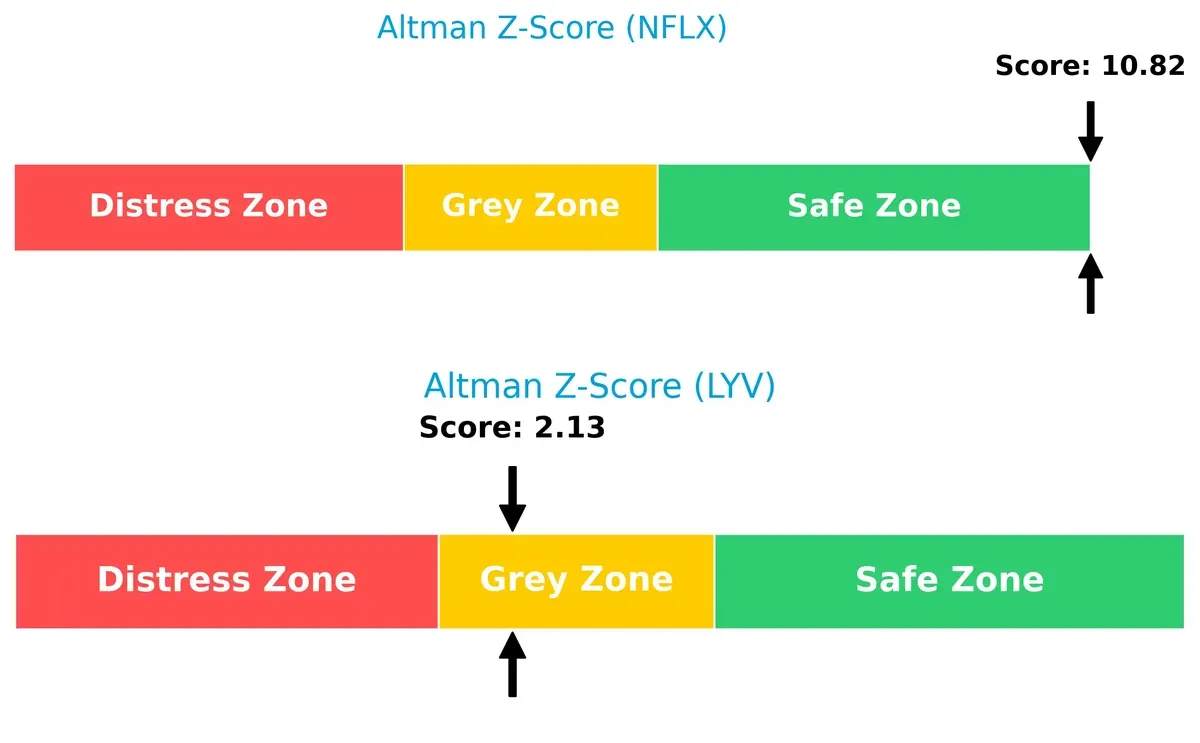
Bankruptcy Risk: Solvency Showdown
Netflix’s Altman Z-Score (10.82) significantly outpaces Live Nation’s 2.13, signaling vastly stronger solvency and lower bankruptcy risk in today’s market cycle:
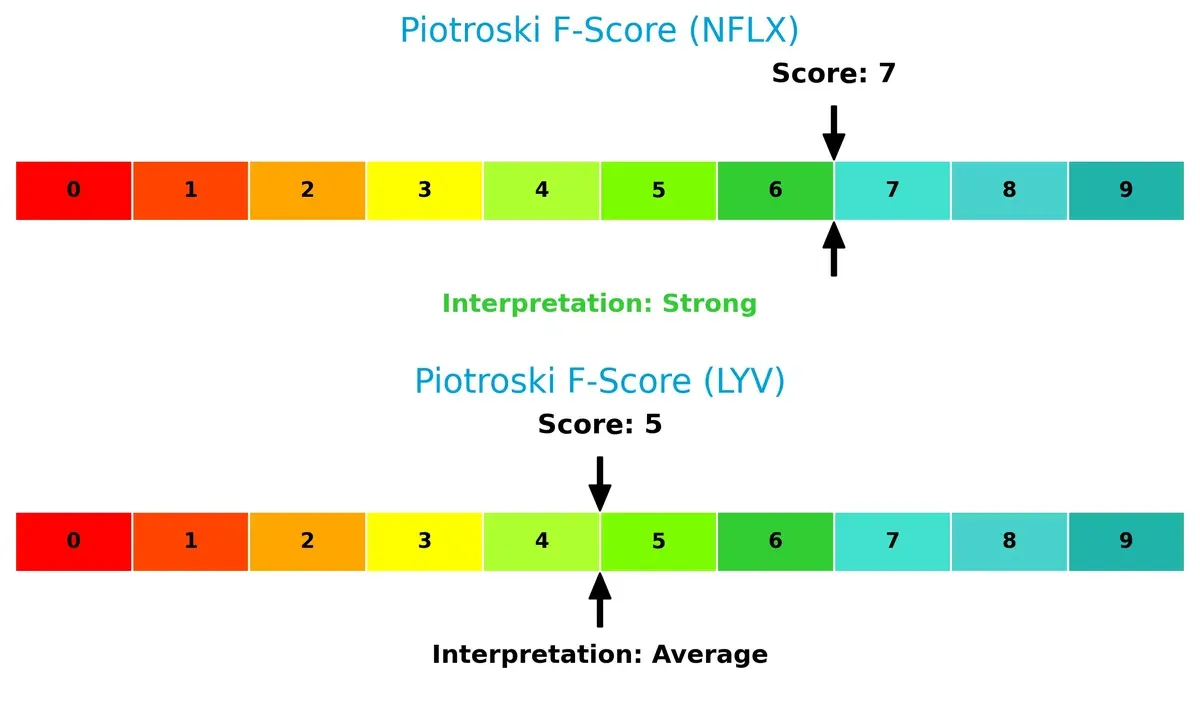
Financial Health: Quality of Operations
Netflix’s Piotroski F-Score of 7 indicates strong financial health, outperforming Live Nation’s average score of 5, which raises mild red flags about internal operational efficiency:
How are the two companies positioned?
This section dissects Netflix and Live Nation’s operational DNA by comparing revenue distribution and internal dynamics. The goal is to confront their economic moats to reveal which model sustains a stronger competitive advantage today.
Revenue Segmentation: The Strategic Mix
The following visual comparison dissects how Netflix and Live Nation diversify their income streams and where their primary sector bets lie:
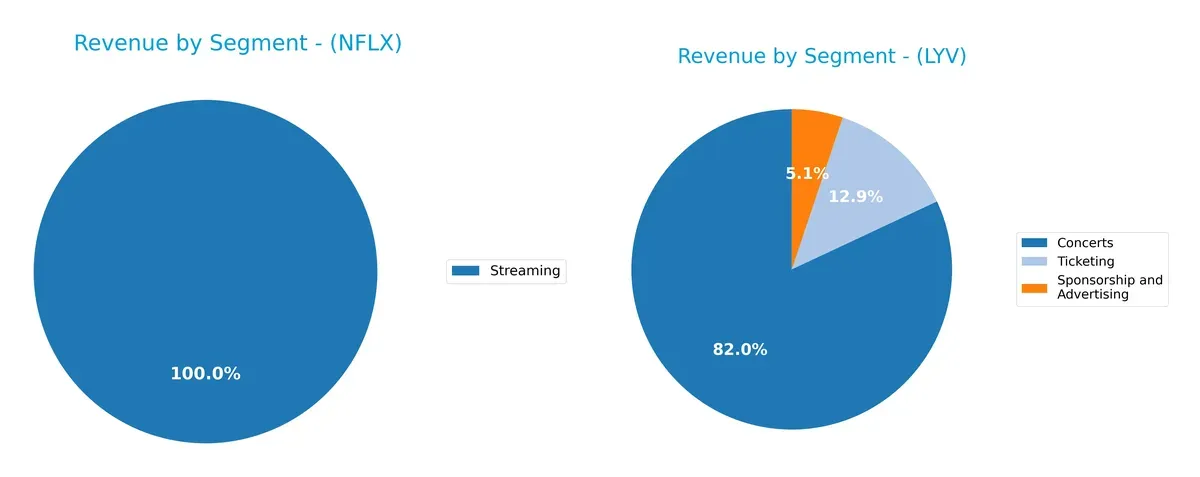
Netflix anchors nearly all revenue in Streaming, generating $39B in 2024, with negligible DVD sales. This singular focus drives global dominance but entails concentration risk. Live Nation boasts a more diversified mix: Concerts lead with $19B, followed by Ticketing at $3B and Sponsorship near $1.2B. This blend reduces risk and leverages ecosystem lock-in across live events and advertising. Live Nation pivots on infrastructure and audience engagement, while Netflix relies on content streaming supremacy.
Strengths and Weaknesses Comparison
This table compares the Strengths and Weaknesses of Netflix and Live Nation:
Netflix Strengths
- High streaming revenue of $39B in 2024
- Favorable margins with 24.3% net margin
- Strong ROE at 41.26%
- Low debt-to-assets at 26%
- Solid international presence across multiple regions
- Efficient asset turnover and high fixed asset turnover
Live Nation Strengths
- Diversified revenue from concerts, ticketing, sponsorships
- ROE exceptionally high at 517%
- Favorable asset turnover ratios
- Large domestic revenue base of $14.4B
- Growing foreign operations at $8.8B
- Multiple revenue streams including advertising and ticketing
Netflix Weaknesses
- High PE at 36.11 and PB at 14.9, indicating expensive valuation
- WACC higher than ROIC, posing capital cost concerns
- No dividend yield
- Moderate current ratio at 1.19, slightly cautious liquidity
- Heavy reliance on streaming segment
Live Nation Weaknesses
- Low net margin of 3.87% despite high ROE
- Unfavorable debt to equity ratio at 47.74
- Current ratio below 1, indicating liquidity risk
- Very high PB at 172, suggesting overvaluation
- No dividend yield
Netflix boasts strong profitability and global reach driven by streaming but faces valuation and capital efficiency risks. Live Nation’s strengths lie in revenue diversification and exceptional ROE, yet liquidity and margin pressures present notable challenges. Both companies show distinctive profiles impacting their strategic priorities.
The Moat Duel: Analyzing Competitive Defensibility
A structural moat is the critical barrier protecting long-term profits from relentless competitive pressure. Here’s how Netflix and Live Nation stack up:
Netflix, Inc.: Content Scale & Global Reach Moat
Netflix’s primary moat stems from its vast content library and worldwide subscriber base. This creates strong switching costs and brand loyalty. Its ROIC exceeds WACC by 13.6%, showing durable value creation. Expansion into mobile games and international markets in 2026 could deepen this moat further.
Live Nation Entertainment, Inc.: Venue Control & Network Moat
Live Nation’s moat relies on exclusive control over venues and ticketing networks, contrasting Netflix’s digital scale. Despite a slightly unfavorable ROIC compared to WACC, its improving profitability signals strengthening economic returns. Growth in live event sponsorships and digital ticketing platforms offers expansion opportunities.
Streaming Scale vs. Live Event Network: Netflix’s Sustainable Advantage
Netflix holds the wider and deeper moat, driven by consistently high ROIC and diversified global revenue streams. Live Nation’s moat is narrower, relying on physical assets vulnerable to market disruptions. Netflix is better positioned to defend and grow its market share through scalable content and technology investments.
Which stock offers better returns?
The past year shows strong bullish trends for both stocks, with Netflix decelerating after a high peak and Live Nation accelerating steadily.
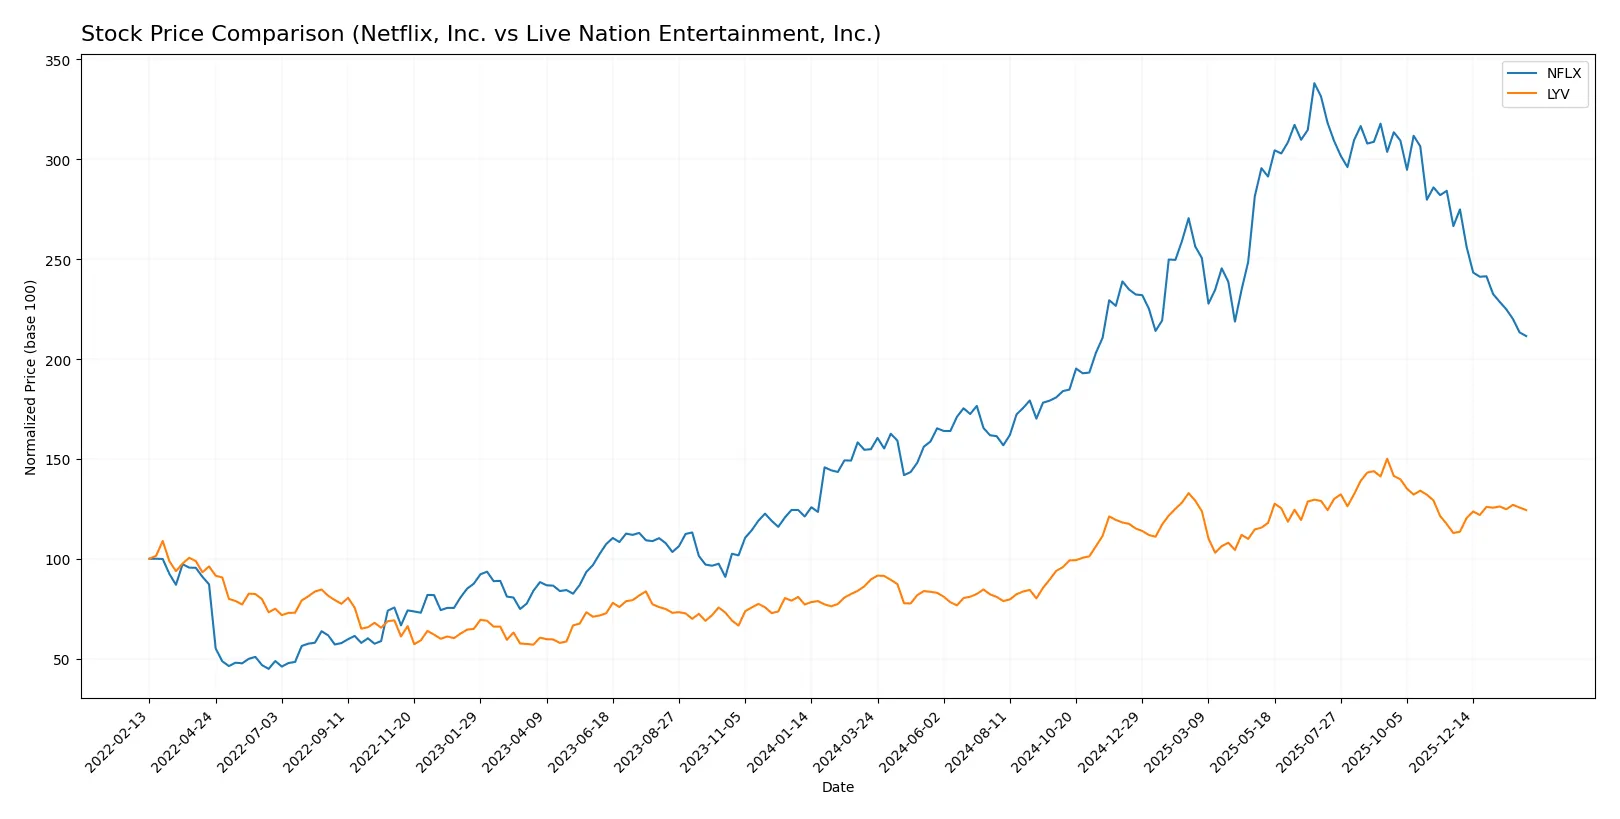
Trend Comparison
Netflix’s stock rose 36.59% over the past year, showing a bullish trend but with decelerating momentum and a high volatility of 22.17%. It peaked at 132.31 and hit a low of 55.5.
Live Nation’s stock gained 38.71% over the same period, maintaining a bullish trend with accelerating momentum and slightly higher volatility at 23.23%. Its price ranged between 88.75 and 173.73.
Live Nation outperformed Netflix slightly, driven by accelerating gains and steadier recent growth, delivering the highest market performance over the last 12 months.
Target Prices
Analysts present a bullish consensus for both Netflix, Inc. and Live Nation Entertainment, Inc.
| Company | Target Low | Target High | Consensus |
|---|---|---|---|
| Netflix, Inc. | 95 | 152 | 117.25 |
| Live Nation Entertainment, Inc. | 155 | 195 | 177 |
Netflix’s consensus target of 117.25 exceeds its current 82.76 price, signaling substantial upside. Live Nation’s 177 consensus also suggests a strong potential rebound from 143.94.

Don’t Let Luck Decide Your Entry Point
Optimize your entry points with our advanced ProRealTime indicators. You’ll get efficient buy signals with precise price targets for maximum performance. Start outperforming now!
How do institutions grade them?
Netflix, Inc. Grades
The following table shows recent institutional grades for Netflix, Inc.:
| Grading Company | Action | New Grade | Date |
|---|---|---|---|
| Freedom Capital Markets | Buy | Buy | 2026-01-27 |
| Argus Research | Maintain | Buy | 2026-01-22 |
| Canaccord Genuity | Maintain | Buy | 2026-01-21 |
| Morgan Stanley | Maintain | Overweight | 2026-01-21 |
| UBS | Maintain | Buy | 2026-01-21 |
| Wedbush | Maintain | Outperform | 2026-01-21 |
| Wolfe Research | Maintain | Outperform | 2026-01-21 |
| Guggenheim | Maintain | Buy | 2026-01-21 |
| BMO Capital | Maintain | Outperform | 2026-01-21 |
| TD Cowen | Maintain | Buy | 2026-01-21 |
Live Nation Entertainment, Inc. Grades
The table below summarizes recent institutional grades for Live Nation Entertainment, Inc.:
| Grading Company | Action | New Grade | Date |
|---|---|---|---|
| Jefferies | Downgrade | Hold | 2026-01-13 |
| Evercore ISI Group | Maintain | Outperform | 2025-12-23 |
| Guggenheim | Maintain | Buy | 2025-11-18 |
| Roth Capital | Maintain | Buy | 2025-11-05 |
| Evercore ISI Group | Maintain | Outperform | 2025-11-05 |
| Guggenheim | Maintain | Buy | 2025-11-05 |
| JP Morgan | Maintain | Overweight | 2025-11-05 |
| Morgan Stanley | Maintain | Overweight | 2025-11-05 |
| Susquehanna | Maintain | Positive | 2025-11-03 |
| Citigroup | Maintain | Buy | 2025-10-23 |
Which company has the best grades?
Netflix has consistently received strong buy and outperform ratings from multiple firms, indicating broad institutional confidence. Live Nation shows a mix of buy and outperform grades but also a recent downgrade to hold, suggesting more cautious sentiment. Investors may perceive Netflix’s grades as reflecting stronger near-term momentum.
Risks specific to each company
The following categories identify the critical pressure points and systemic threats facing both firms in the 2026 market environment:
1. Market & Competition
Netflix, Inc.
- Faces intense streaming competition from tech giants and niche players in a saturated market.
Live Nation Entertainment, Inc.
- Competes fiercely in live events, with risks from shifting consumer preferences and digital alternatives.
2. Capital Structure & Debt
Netflix, Inc.
- Maintains moderate leverage (D/E 0.54) with strong interest coverage (17.33x), signaling financial resilience.
Live Nation Entertainment, Inc.
- Carries higher leverage (D/E 0.48) with weaker interest coverage (3.27x), raising refinancing and liquidity risks.
3. Stock Volatility
Netflix, Inc.
- Beta of 1.71 indicates above-market volatility, reflecting sensitivity to market swings and sector cyclicality.
Live Nation Entertainment, Inc.
- Beta of 1.14 shows moderate volatility, less reactive to market shifts compared to Netflix.
4. Regulatory & Legal
Netflix, Inc.
- Subject to content regulations and data privacy laws across 190 countries, increasing compliance complexity.
Live Nation Entertainment, Inc.
- Faces event safety, ticketing regulations, and antitrust scrutiny impacting operational flexibility.
5. Supply Chain & Operations
Netflix, Inc.
- Dependent on global internet infrastructure and content production pipelines vulnerable to disruption.
Live Nation Entertainment, Inc.
- Relies on venue operations and artist availability, exposed to event cancellations and labor issues.
6. ESG & Climate Transition
Netflix, Inc.
- Under pressure to reduce data center emissions and ensure sustainable content production.
Live Nation Entertainment, Inc.
- Faces challenges in reducing event carbon footprints and adapting venues for climate resilience.
7. Geopolitical Exposure
Netflix, Inc.
- Operates globally with exposure to geopolitical tensions affecting content licensing and market access.
Live Nation Entertainment, Inc.
- Primarily North America and Europe focused, but vulnerable to travel restrictions and geopolitical instability.
Which company shows a better risk-adjusted profile?
Netflix’s dominant position in streaming and stronger financial health mitigate its risks better than Live Nation’s elevated leverage and operational dependencies. However, Netflix’s high stock volatility and regulatory complexity remain notable concerns. Live Nation’s event-driven model faces acute operational and liquidity risks amid tightening debt costs. Netflix’s Altman Z-score of 10.8 confirms robust financial stability, while Live Nation’s 2.1 signals moderate distress risk. I see Netflix as the safer risk-adjusted choice given its stronger capital structure and diversified revenue base.
Final Verdict: Which stock to choose?
Netflix’s superpower lies in its durable competitive advantage and unmatched ability to generate value, demonstrated by a strong and growing ROIC well above its cost of capital. Its point of vigilance is a relatively high valuation, which could pressure returns if growth slows. Netflix fits an Aggressive Growth portfolio seeking leadership in streaming innovation.
Live Nation’s strategic moat centers on its unique position in the live entertainment market, supported by solid recurring revenues and improving profitability. While it carries more financial risk than Netflix, it offers a safety profile that might appeal to investors valuing steady cash flow and operational leverage. Live Nation suits a GARP (Growth at a Reasonable Price) portfolio focused on recovery and expansion.
If you prioritize durable economic moats and superior capital efficiency, Netflix outshines due to its consistent value creation and robust income growth. However, if you seek exposure to a niche sector with improving fundamentals and potential for operational turnaround, Live Nation offers better stability and a compelling growth narrative despite higher leverage. Both present distinct analytical scenarios depending on your risk tolerance and investment horizon.
Disclaimer: Investment carries a risk of loss of initial capital. The past performance is not a reliable indicator of future results. Be sure to understand risks before making an investment decision.
Go Further
I encourage you to read the complete analyses of Netflix, Inc. and Live Nation Entertainment, Inc. to enhance your investment decisions: