Home > Comparison > Basic Materials > LIN vs SHW
The strategic rivalry between Linde plc and The Sherwin-Williams Company shapes the specialty chemicals sector’s future. Linde operates as a capital-intensive industrial gas and engineering leader, while Sherwin-Williams excels as a market-dominant paint and coatings manufacturer. This head-to-head contrasts industrial scale with brand-driven margins. This analysis aims to identify which trajectory offers superior risk-adjusted returns for a diversified portfolio in the evolving basic materials landscape.

Table of contents
Companies Overview
Linde plc and The Sherwin-Williams Company both hold influential positions in the specialty chemicals sector, shaping their respective markets with distinct approaches.
Linde plc: Global Industrial Gas Leader
Linde plc dominates as a global industrial gas and engineering company. Its core revenue stems from supplying atmospheric and process gases to diverse industries worldwide. In 2026, Linde prioritizes expanding turnkey process plant construction and enhancing its gas portfolio for sectors like healthcare and energy, reinforcing its competitive edge in industrial gas solutions.
The Sherwin-Williams Company: Specialty Coatings Powerhouse
Sherwin-Williams excels in manufacturing and distributing paints, coatings, and related products. Its revenue engine relies on three segments targeting professional, industrial, and retail customers. In 2026, Sherwin-Williams focuses on broadening its architectural and performance coatings reach, leveraging a vast store network and innovation to solidify its market dominance in protective and decorative coatings.
Strategic Collision: Similarities & Divergences
Both companies compete in specialty chemicals but follow distinct philosophies. Linde emphasizes an engineering-led, capital-intensive model, while Sherwin-Williams relies on broad product distribution and brand strength. Their primary battleground lies in industrial applications versus consumer and commercial coatings. This creates different investment profiles—Linde appeals through industrial innovation and scale, Sherwin-Williams through brand loyalty and retail penetration.
Income Statement Comparison
This comparison dissects the core profitability and scalability of both corporate engines to reveal who dominates the bottom line:
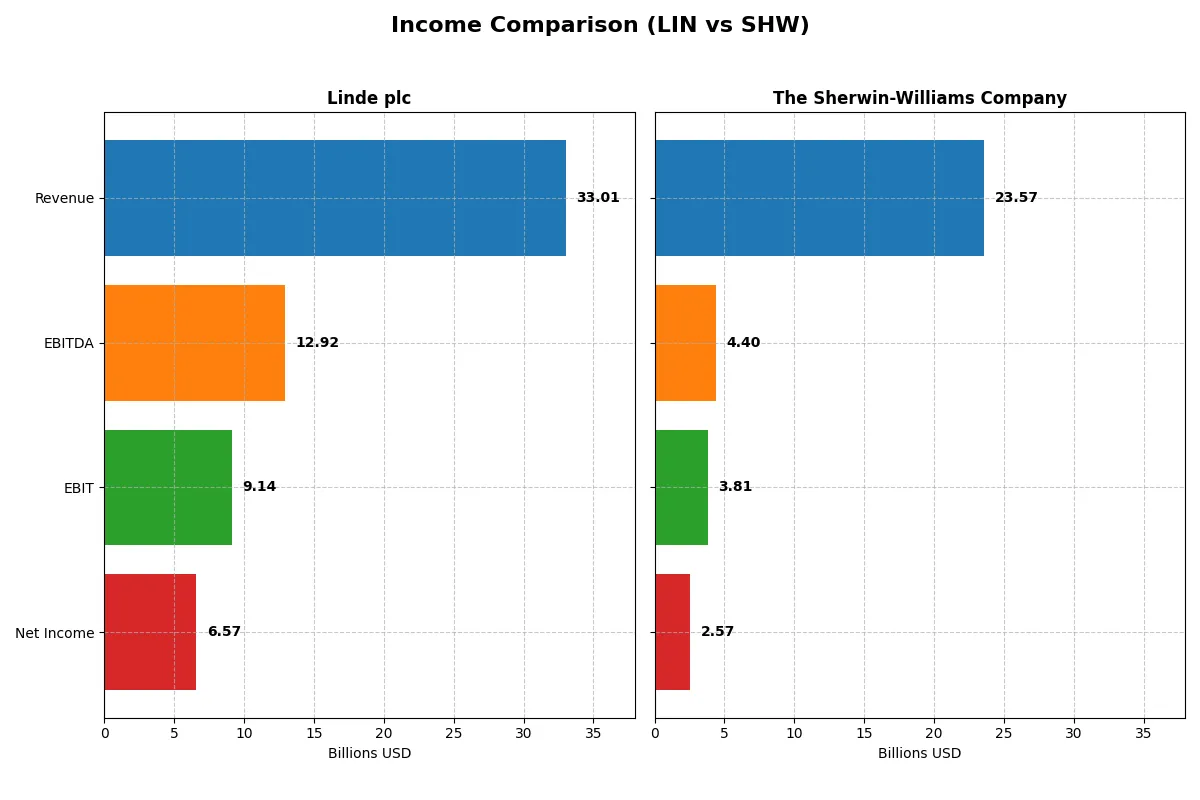
| Metric | Linde plc (LIN) | The Sherwin-Williams Company (SHW) |
|---|---|---|
| Revenue | 33B | 23.1B |
| Cost of Revenue | 20.9B | 11.9B |
| Operating Expenses | 3.49B | 7.43B |
| Gross Profit | 12.1B | 11.2B |
| EBITDA | 12.9B | 4.49B |
| EBIT | 9.14B | 3.87B |
| Interest Expense | 572M | 431M |
| Net Income | 6.57B | 2.68B |
| EPS | 13.71 | 10.68 |
| Fiscal Year | 2024 | 2024 |
Income Statement Analysis: The Bottom-Line Duel
This income statement comparison reveals which company runs a more efficient and profitable business engine amid recent market dynamics.
Linde plc Analysis
Linde’s revenue steadily grows from $27.2B in 2020 to $33B in 2024, while net income surges from $2.5B to $6.6B. Its gross margin holds firm around 36.6%, and net margin improves to nearly 20%. The 2024 figures show strong operational leverage and margin expansion, underscoring efficient cost management and solid earnings momentum.
The Sherwin-Williams Company Analysis
Sherwin-Williams posts revenue growth from $19.9B in 2021 to $23.6B in 2025, with net income rising from $1.86B to $2.57B. Its gross margin is notably higher at nearly 49%, yet net margin lags at 10.9%. The 2025 results reflect margin pressure and a modest decline in EBIT and net margin, indicating challenges in controlling operating expenses despite revenue gains.
Margin Efficiency vs. Revenue Growth
Linde delivers superior net income growth and margin expansion, doubling net earnings over five years with strong operational efficiency. Sherwin-Williams excels in gross margin but struggles to convert it into comparable net profit growth. For investors prioritizing bottom-line strength and margin resilience, Linde’s profile offers a more compelling fundamental advantage.
Financial Ratios Comparison
These vital ratios act as a diagnostic tool to expose the underlying fiscal health, valuation premiums, and capital efficiency of the companies compared below:
| Ratios | Linde plc (LIN) | The Sherwin-Williams Company (SHW) |
|---|---|---|
| ROE | 17.23% | 55.86% |
| ROIC | 9.19% | 15.21% |
| P/E | 30.53 | 31.08 |
| P/B | 5.26 | 17.36 |
| Current Ratio | 0.89 | 0.87 |
| Quick Ratio | 0.76 | 0.53 |
| D/E | 0.59 | 2.81 |
| Debt-to-Assets | 28.21% | 49.97% |
| Interest Coverage | 15.03 | 8.11 |
| Asset Turnover | 0.41 | 0.91 |
| Fixed Asset Turnover | 1.28 | 3.84 |
| Payout Ratio | 40.44% | 30.31% |
| Dividend Yield | 1.32% | 0.98% |
| Fiscal Year | 2024 | 2025 |
Efficiency & Valuation Duel: The Vital Signs
Ratios act as a company’s DNA, revealing hidden risks and operational excellence behind headline figures.
Linde plc
Linde delivers a strong ROE of 17.23% and a solid net margin near 20%, signaling core profitability. The P/E at 30.53 suggests the stock trades at a premium, potentially stretched versus sector norms. Linde supports shareholders with a 1.32% dividend yield, balancing returns with disciplined reinvestment in growth and R&D.
The Sherwin-Williams Company
Sherwin-Williams impresses with an exceptional 55.86% ROE, reflecting operational efficiency and capital allocation prowess. Its net margin is healthier than many peers at 10.9%, but the P/E of 31.08 marks a similarly high valuation. The company’s 0.98% dividend yield is modest, with growth fueled by reinvestment rather than generous payouts.
Premium Valuation vs. Operational Safety
Sherwin-Williams commands higher profitability but carries more leverage and a stretched valuation. Linde offers steadier returns with a more balanced risk profile despite a similar premium multiple. Investors prioritizing operational safety may lean toward Linde; growth seekers might prefer Sherwin’s aggressive capital efficiency.
Which one offers the Superior Shareholder Reward?
I find Linde plc (LIN) delivers a more attractive total shareholder return than The Sherwin-Williams Company (SHW) in 2026. LIN offers a 1.32% dividend yield with a sustainable 40% payout ratio, backed by strong free cash flow coverage (52%). Its steady buyback program enhances returns. SHW’s dividend yield is lower at 0.98%, with a more conservative 27% payout ratio and weaker free cash flow coverage. SHW’s elevated debt levels and volatile buyback activity raise sustainability concerns. Historically, LIN’s balanced distribution and robust capital allocation better support long-term value creation. Therefore, I favor Linde for superior shareholder reward in 2026.
Comparative Score Analysis: The Strategic Profile
The radar chart reveals the fundamental DNA and trade-offs of both Linde plc and The Sherwin-Williams Company, highlighting their strategic strengths and vulnerabilities:
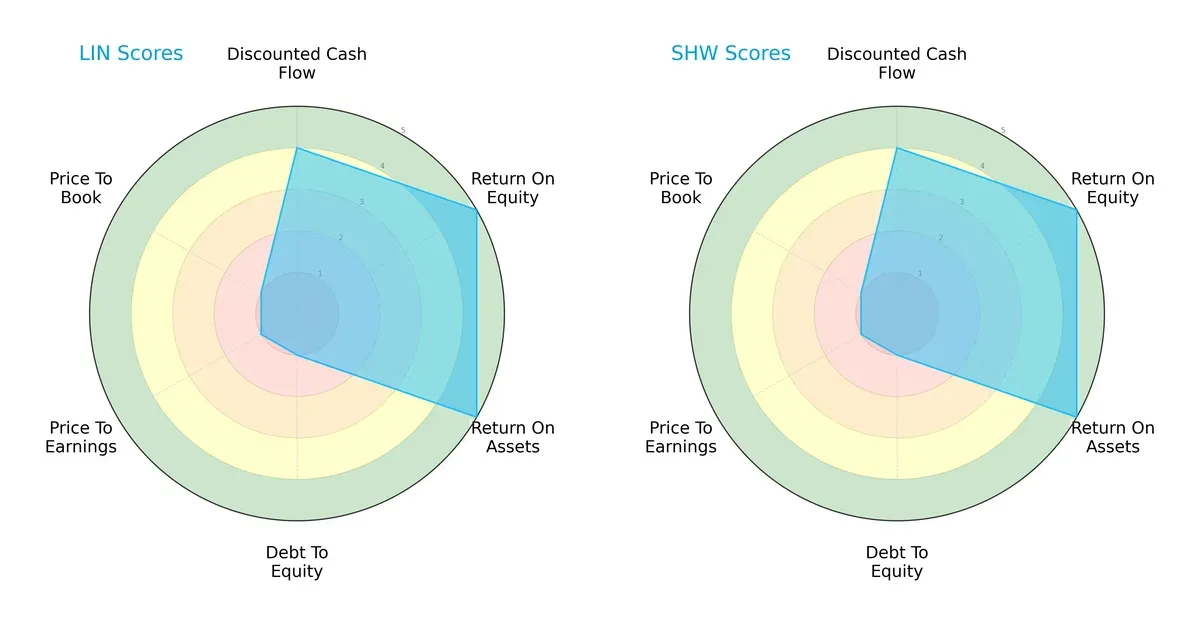
Both firms share identical ratings across DCF, ROE, and ROA, reflecting strong operational efficiency and favorable cash flow prospects. However, both exhibit very weak debt-to-equity and valuation scores, signaling elevated financial leverage and expensive market pricing. Neither stands out as more balanced; both rely heavily on operational excellence while facing valuation and leverage challenges.
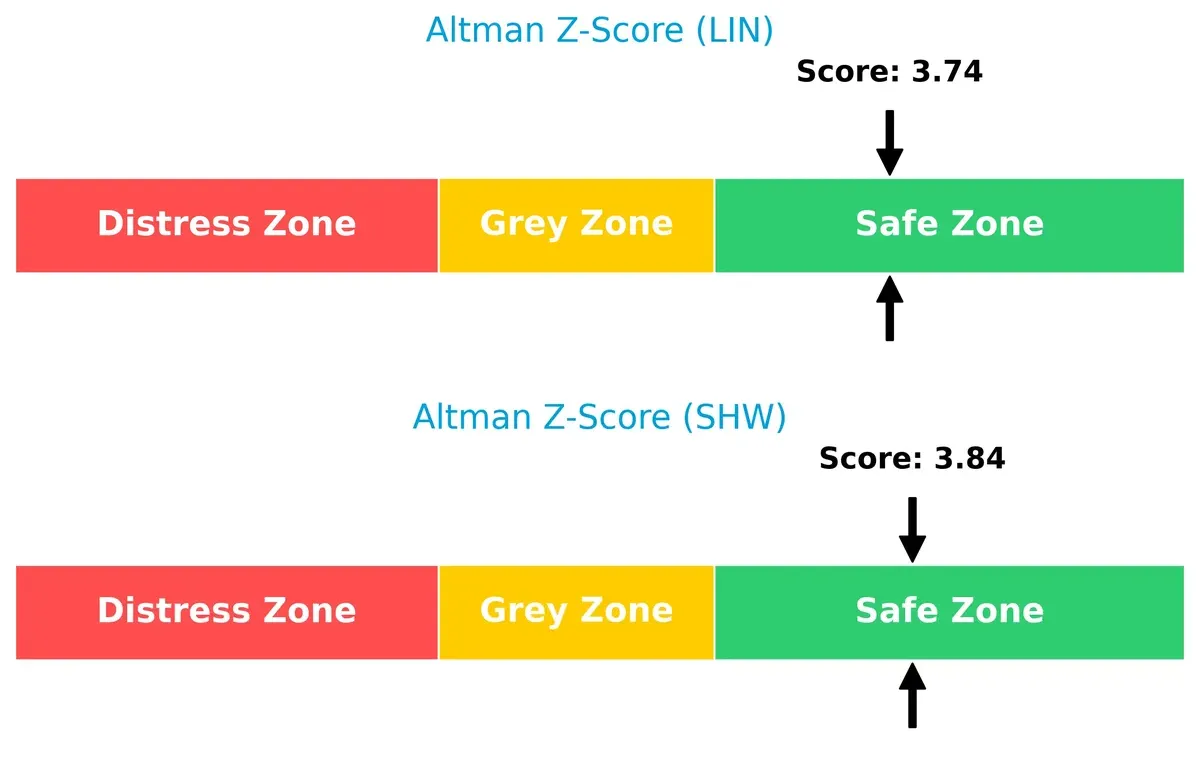
Bankruptcy Risk: Solvency Showdown
Linde plc and Sherwin-Williams both score safely above 3 on the Altman Z-Score, indicating solid solvency and low bankruptcy risk in this economic cycle:
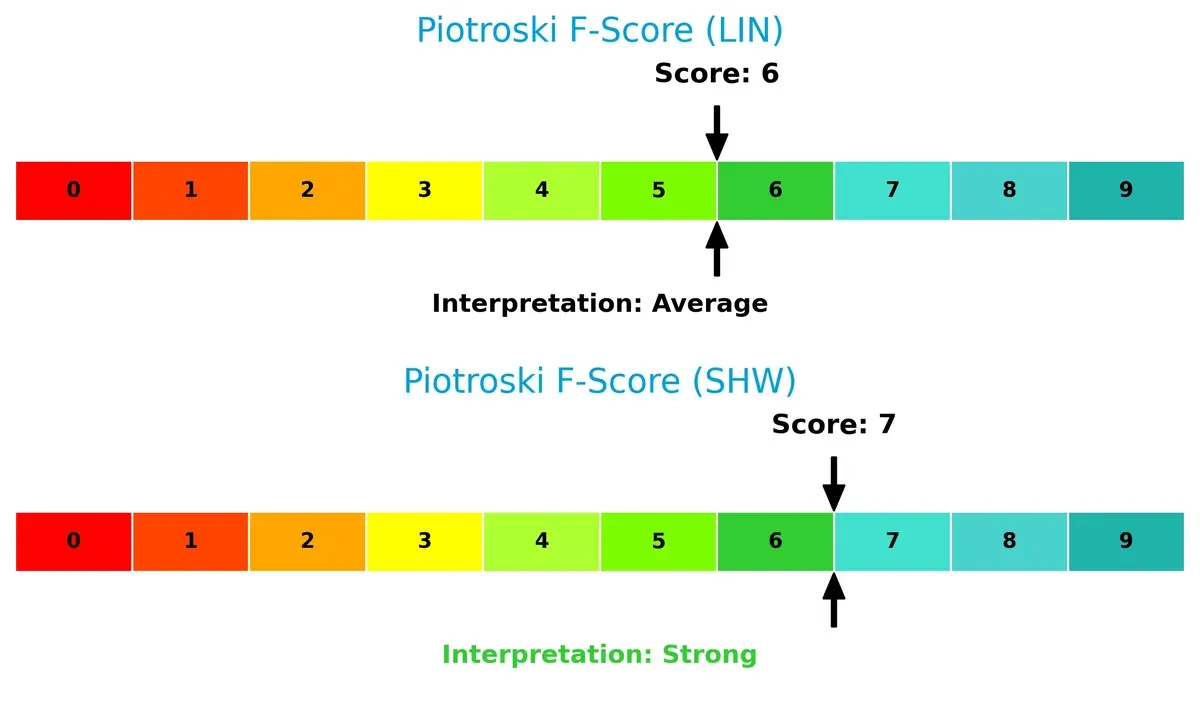
Financial Health: Quality of Operations
Sherwin-Williams edges ahead with a Piotroski F-Score of 7, indicating stronger internal financial health compared to Linde’s average score of 6. This suggests Sherwin-Williams manages profitability and efficiency metrics with slightly better discipline:
How are the two companies positioned?
This section dissects the operational DNA of Linde and Sherwin-Williams by comparing their revenue distribution and internal strengths and weaknesses. The goal is to confront their economic moats and reveal which business model delivers the most resilient, sustainable competitive advantage in today’s market.
Revenue Segmentation: The Strategic Mix
This visual comparison dissects how Linde plc and The Sherwin-Williams Company diversify their income streams and reveals their primary sector concentrations:
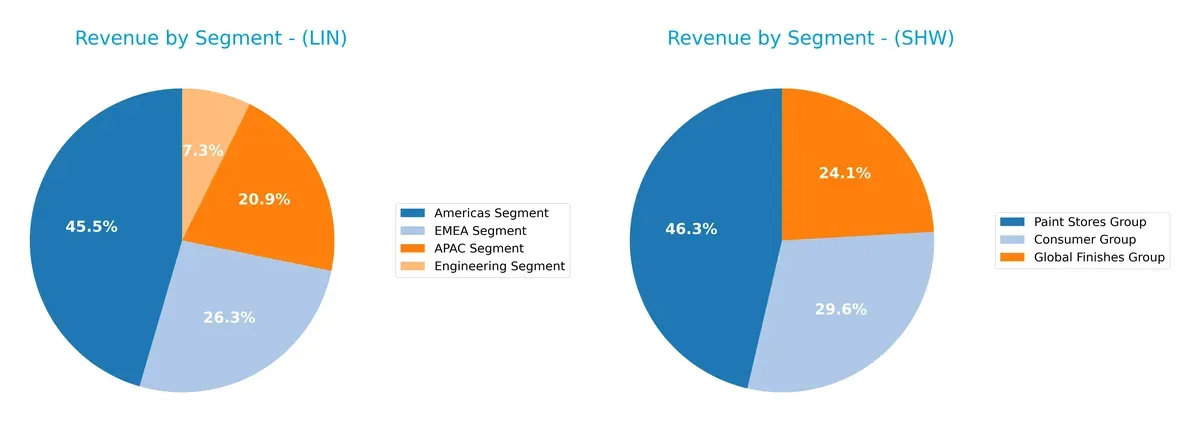
Linde plc pivots on its Americas Segment with $14.4B, but maintains strong revenue from APAC ($6.6B) and EMEA ($8.4B), showing broad geographic diversification. Sherwin-Williams anchors $13.2B in Paint Stores yet relies heavily on this single segment. Its Consumer ($8.4B) and Global Finishes ($6.9B) groups add depth but less balance. Linde’s spread reduces concentration risk; Sherwin-Williams leverages ecosystem lock-in within retail paint distribution.
Strengths and Weaknesses Comparison
This table compares the strengths and weaknesses of Linde plc and The Sherwin-Williams Company:
Linde plc Strengths
- Diverse revenue streams across Americas, EMEA, APAC, and Engineering segments
- Favorable net margin at 19.89% and ROE at 17.23%
- Low debt-to-assets ratio at 28.21% supports financial stability
- Strong interest coverage ratio at 15.98 indicates solid debt servicing ability
The Sherwin-Williams Company Strengths
- High ROE of 55.86% and favorable ROIC at 15.21% show strong profitability
- Robust fixed asset turnover at 3.84 signals efficient asset use
- Favorable interest coverage at 8.12 supports debt management
- Large Paint Stores Group segment with $13.2B revenue indicates market presence
Linde plc Weaknesses
- Current and quick ratios below 1 (0.89 and 0.76) signal liquidity concerns
- Unfavorable valuation multiples: P/E 30.53 and P/B 5.26
- Low asset turnover at 0.41 implies less efficient asset use
- Neutral ROIC near WACC at 9.19% limits value creation
The Sherwin-Williams Company Weaknesses
- High debt-to-equity ratio at 2.81 increases financial risk
- Current and quick ratios weak at 0.87 and 0.53, raising liquidity flags
- Unfavorable P/B ratio at 17.36 and dividend yield under 1%
- Slightly unfavorable global ratio opinion reflects broader financial challenges
Linde shows solid diversification with balanced global revenue and conservative leverage but faces liquidity and valuation pressures. Sherwin-Williams excels in profitability and asset efficiency but carries higher leverage and liquidity risks. Both companies display mixed financial health that impacts strategic priorities.
The Moat Duel: Analyzing Competitive Defensibility
A structural moat is the only shield protecting long-term profits from relentless competition and market disruption. Here’s how these two industry leaders defend their turf:
Linde plc: Engineering Scale and Asset Intensity
Linde’s moat stems from its capital-intensive engineering and global industrial gas network. Its slightly favorable ROIC trend signals improving profitability amid heavy asset use. Expansion in hydrogen and specialty gases could deepen this moat in 2026.
The Sherwin-Williams Company: Brand Strength and Margin Power
Sherwin-Williams relies on brand loyalty and distribution scale, delivering a very favorable ROIC well above WACC. Despite recent margin pressure, its broad product range and store footprint support durable competitive positioning and potential market expansion.
Capital-Intensive Network vs. Brand-Driven Ecosystem
Sherwin-Williams holds the deeper moat with consistently higher ROIC and value creation. Linde’s growing profitability shows promise but remains below the threshold for a wide economic moat. Sherwin-Williams is better equipped to defend market share in a competitive specialty chemicals landscape.
Which stock offers better returns?
The past year shows diverging price dynamics for Linde plc and The Sherwin-Williams Company, with Linde experiencing recent acceleration despite an overall mild decline, while Sherwin-Williams maintains steady growth.
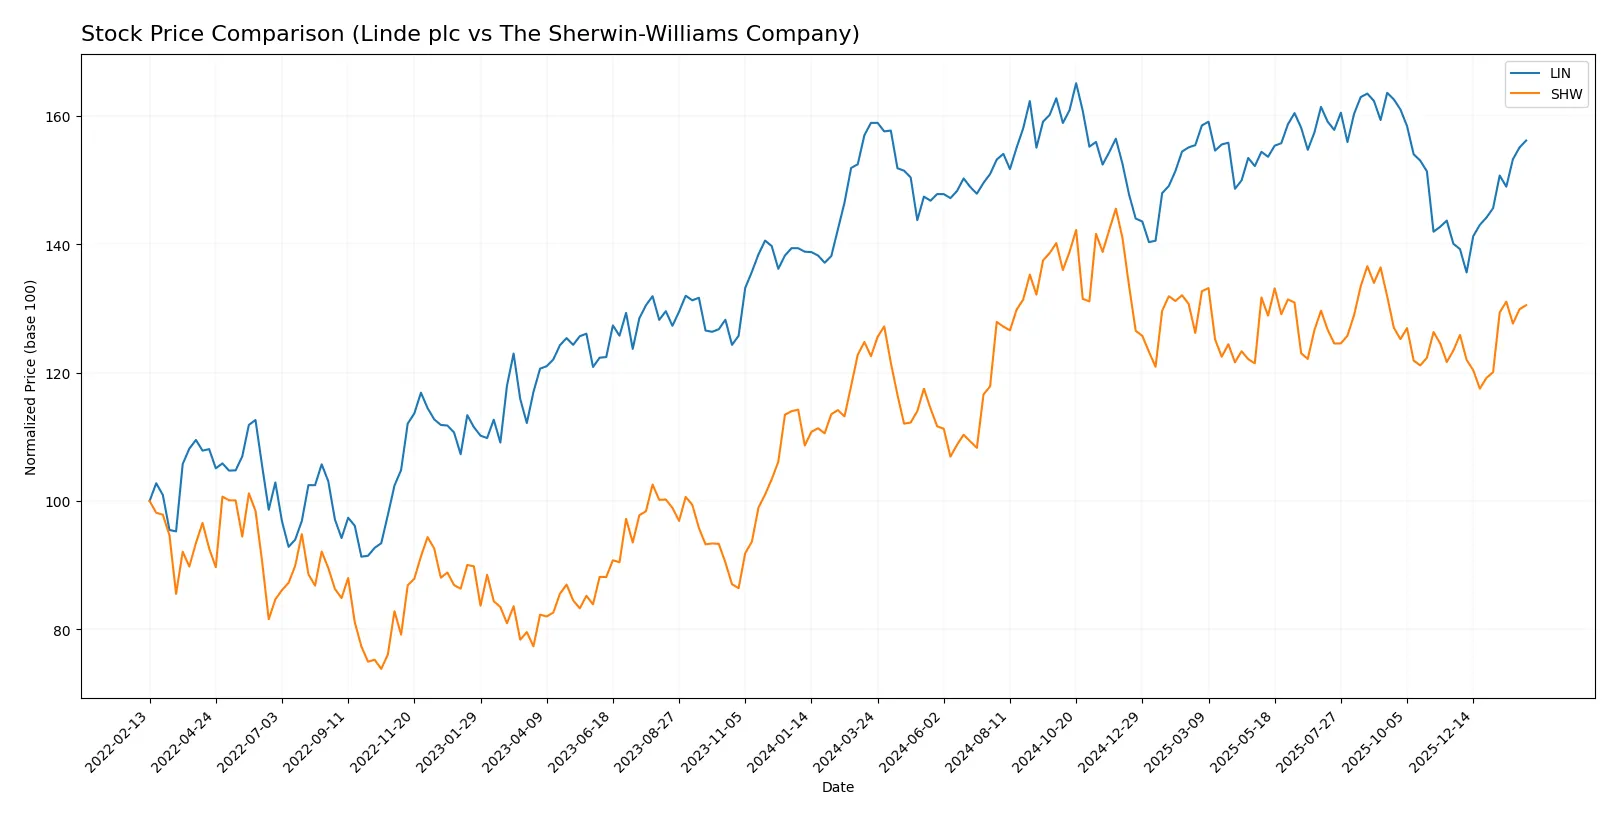
Trend Comparison
Linde plc’s stock fell 1.72% over the last 12 months, marking a bearish trend with accelerating price movements and a high volatility level at 19.06. The stock hit a low of 399.57 and peaked at 486.45.
The Sherwin-Williams Company gained 6.48% in the same period, signaling a bullish and accelerating trend. It showed higher volatility (22.48), with prices ranging from 291.95 to 397.4.
Sherwin-Williams outperformed Linde over the past year, delivering superior market returns despite both experiencing acceleration in their stock trends recently.
Target Prices
Analysts present a bullish consensus for Linde plc and The Sherwin-Williams Company, with targets well above current prices.
| Company | Target Low | Target High | Consensus |
|---|---|---|---|
| Linde plc | 490 | 516 | 500.33 |
| The Sherwin-Williams Company | 371 | 420 | 393.5 |
Linde’s consensus target exceeds its $460 price by 8.7%, signaling moderate upside. Sherwin-Williams shows a 10.4% premium to its $356 price, reflecting strong analyst confidence.

Don’t Let Luck Decide Your Entry Point
Optimize your entry points with our advanced ProRealTime indicators. You’ll get efficient buy signals with precise price targets for maximum performance. Start outperforming now!
How do institutions grade them?
Here is a summary of recent institutional grades for Linde plc and The Sherwin-Williams Company:
Linde plc Grades
Below are the latest official grades assigned to Linde plc by well-known financial institutions.
| Grading Company | Action | New Grade | Date |
|---|---|---|---|
| Citigroup | Maintain | Buy | 2026-01-21 |
| RBC Capital | Maintain | Outperform | 2025-12-12 |
| UBS | Upgrade | Buy | 2025-11-11 |
| RBC Capital | Maintain | Outperform | 2025-11-06 |
| Citigroup | Maintain | Buy | 2025-11-03 |
| Seaport Global | Upgrade | Buy | 2025-11-03 |
| B of A Securities | Maintain | Buy | 2025-11-03 |
| JP Morgan | Maintain | Overweight | 2025-11-03 |
| UBS | Maintain | Neutral | 2025-10-06 |
| Citigroup | Maintain | Buy | 2025-10-06 |
The Sherwin-Williams Company Grades
Presented here are the most recent grades for The Sherwin-Williams Company from reputable grading firms.
| Grading Company | Action | New Grade | Date |
|---|---|---|---|
| RBC Capital | Maintain | Outperform | 2026-01-30 |
| UBS | Maintain | Buy | 2026-01-12 |
| Citigroup | Upgrade | Buy | 2025-12-18 |
| Mizuho | Maintain | Outperform | 2025-12-18 |
| Citigroup | Maintain | Neutral | 2025-10-30 |
| Wells Fargo | Maintain | Overweight | 2025-10-29 |
| RBC Capital | Maintain | Outperform | 2025-10-29 |
| JP Morgan | Maintain | Overweight | 2025-10-29 |
| UBS | Maintain | Buy | 2025-10-29 |
| B of A Securities | Maintain | Neutral | 2025-10-14 |
Which company has the best grades?
Both companies receive mostly positive grades, with frequent Buy and Outperform ratings. Linde shows several upgrades and consistent Buy ratings. Sherwin-Williams has a strong presence of Outperform and Buy grades from multiple firms. Investors may interpret Sherwin-Williams’ broader consensus of high ratings as a slightly stronger institutional confidence signal.
Risks specific to each company
The following categories identify critical pressure points and systemic threats facing Linde plc and The Sherwin-Williams Company in the 2026 market environment:
1. Market & Competition
Linde plc
- Global industrial gases market faces moderate competition; strong engineering niche supports moat.
The Sherwin-Williams Company
- Specialty paints and coatings market is highly competitive; innovation and brand strength are crucial.
2. Capital Structure & Debt
Linde plc
- Moderate debt-to-equity ratio (0.59) signals balanced leverage; interest coverage strong (15.98x).
The Sherwin-Williams Company
- High debt-to-equity (2.81) raises leverage risk; interest coverage weaker but still adequate (8.12x).
3. Stock Volatility
Linde plc
- Beta at 0.855 indicates lower volatility than market average; price range relatively stable.
The Sherwin-Williams Company
- Beta at 1.259 suggests higher volatility; price range wider, reflecting sensitivity to market swings.
4. Regulatory & Legal
Linde plc
- Exposure to environmental regulations in multiple jurisdictions; compliance costs manageable.
The Sherwin-Williams Company
- Faces stringent chemical and environmental regulations; litigation risk from product liabilities remains.
5. Supply Chain & Operations
Linde plc
- Complex global supply chain with exposure to geopolitical risks; engineering projects require precision.
The Sherwin-Williams Company
- Extensive retail and distribution network; supply chain disruptions could affect inventory and sales.
6. ESG & Climate Transition
Linde plc
- Active in hydrogen and clean gas technologies, aligning with climate transition goals.
The Sherwin-Williams Company
- Pressure to reduce carbon footprint in chemical coatings; ongoing investments in sustainable products.
7. Geopolitical Exposure
Linde plc
- Operates globally with notable exposure to Europe, Asia, and Americas; geopolitical tensions could disrupt operations.
The Sherwin-Williams Company
- Primarily North American focus but increasing global presence; trade policies and tariffs are potential risks.
Which company shows a better risk-adjusted profile?
Linde’s most impactful risk is its unfavorable liquidity ratios, which could constrain short-term flexibility despite strong interest coverage. Sherwin-Williams faces significant leverage risk with a very high debt-to-equity ratio, heightening financial vulnerability. Both companies carry very unfavorable valuation multiples, signaling market skepticism. However, Linde’s lower stock volatility and stronger balance sheet provide a better risk-adjusted profile. Recent data shows Sherwin-Williams’ debt ratio nearly doubles Linde’s, justifying heightened concern over financial risk.
Final Verdict: Which stock to choose?
Linde plc’s superpower lies in its steadily growing profitability and solid income quality, signaling improving operational efficiency. However, its current liquidity position demands vigilance as a tighter current ratio could pressure short-term flexibility. It suits portfolios aiming for steady, industrial growth with a moderate risk appetite.
The Sherwin-Williams Company boasts a durable competitive moat driven by robust return on invested capital well above its cost of capital. Its strong profitability and asset efficiency provide a safety cushion compared to Linde, despite higher leverage. It fits well with investors seeking growth at a reasonable price and enhanced stability.
If you prioritize resilience and incremental value creation, Sherwin-Williams outshines as the compelling choice due to its durable moat and superior profitability trends. However, if you seek exposure to industrial growth with improving operational metrics, Linde offers a promising scenario despite liquidity concerns. Both demand cautious monitoring of their financial health.
Disclaimer: Investment carries a risk of loss of initial capital. The past performance is not a reliable indicator of future results. Be sure to understand risks before making an investment decision.
Go Further
I encourage you to read the complete analyses of Linde plc and The Sherwin-Williams Company to enhance your investment decisions: