Home > Comparison > Basic Materials > LIN vs PPG
The strategic rivalry between Linde plc and PPG Industries defines the current trajectory of the specialty chemicals sector. Linde operates as a capital-intensive industrial gas and engineering leader, while PPG focuses on high-margin paints, coatings, and specialty materials. This analysis pits Linde’s industrial scale against PPG’s innovation-driven niche. I will determine which company offers a superior risk-adjusted return for a diversified portfolio in 2026.
Table of contents
Companies Overview
Linde plc and PPG Industries, Inc. are pivotal players in the specialty chemicals sector with significant global footprints.
Linde plc: Industrial Gas & Engineering Powerhouse
Linde plc dominates the industrial gases market with a robust portfolio including oxygen, nitrogen, and specialty gases. Its core revenue stems from gas production and turnkey plant engineering. In 2026, the company prioritizes expanding its hydrogen and sustainable gas offerings, reinforcing its competitive advantage in green energy solutions.
PPG Industries, Inc.: Global Coatings & Specialty Materials Leader
PPG Industries leads in paints, coatings, and specialty materials, generating revenue through diverse industrial and consumer applications. Its focus in 2026 lies in advanced coatings technologies and expanding aerospace and automotive segments. This strategic push enhances its market position within protective and performance coatings worldwide.
Strategic Collision: Similarities & Divergences
Both companies rely on specialty chemicals, yet Linde emphasizes industrial gases and engineering, while PPG concentrates on coatings and materials innovation. Their primary battleground is the industrial sector, competing for contracts in manufacturing and infrastructure. Linde offers a stable, engineering-driven profile; PPG presents growth through innovation in diverse coatings markets.
Income Statement Comparison
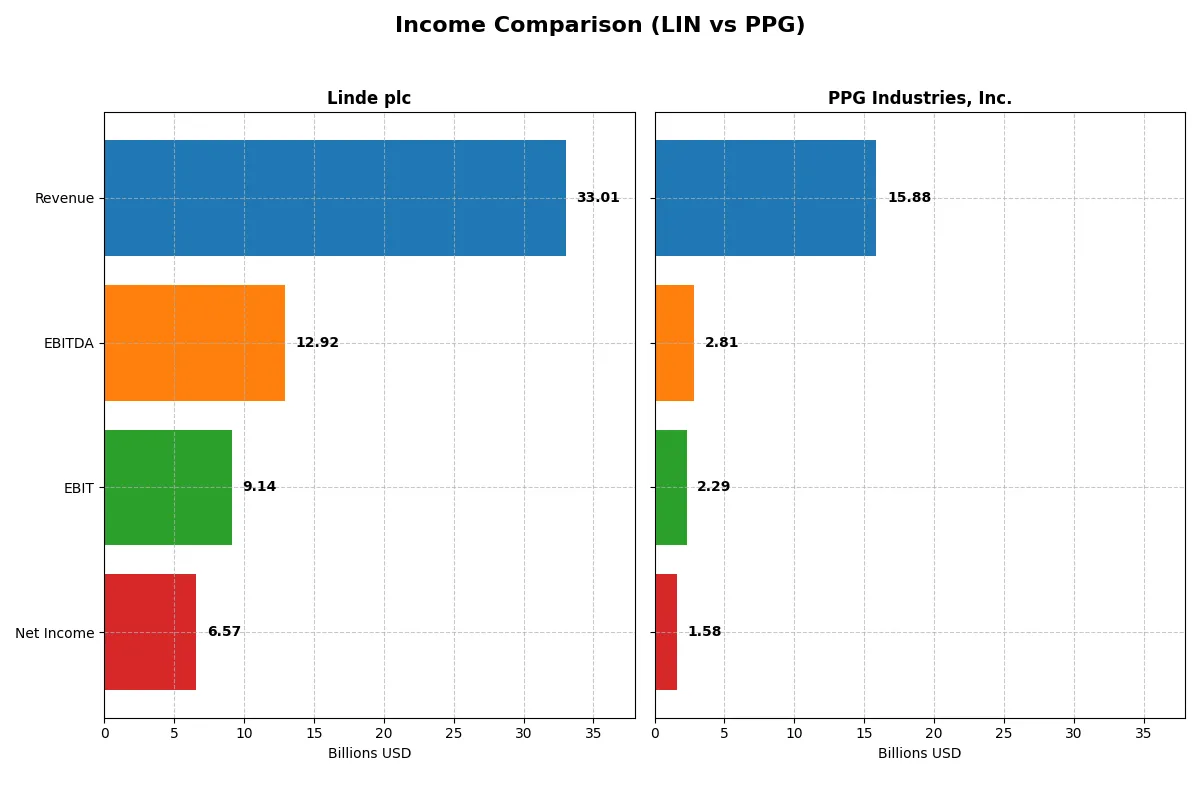
This data dissects the core profitability and scalability of both corporate engines to reveal who dominates the bottom line:
| Metric | Linde plc (LIN) | PPG Industries, Inc. (PPG) |
|---|---|---|
| Revenue | 33B | 15.9B |
| Cost of Revenue | 20.9B | 9.8B |
| Operating Expenses | 3.49B | 3.86B |
| Gross Profit | 12.1B | 6.6B |
| EBITDA | 12.9B | 2.58B |
| EBIT | 9.14B | 2.09B |
| Interest Expense | 572M | 241M |
| Net Income | 6.57B | 1.12B |
| EPS | 13.71 | 4.77 |
| Fiscal Year | 2024 | 2024 |
Income Statement Analysis: The Bottom-Line Duel
This income statement comparison reveals how efficiently each company converts revenue into profit and sustains its operational engine.
Linde plc Analysis
Linde’s revenue grew steadily from $27.2B in 2020 to $33B in 2024, with net income surging from $2.5B to $6.6B. Gross and net margins remain robust at 36.6% and 19.9%, respectively, reflecting strong cost control and pricing power. In 2024, Linde’s EBIT margin rose to 27.7%, signaling improved operational efficiency and earnings momentum.
PPG Industries, Inc. Analysis
PPG’s revenue hovered around $15.6B to $16.8B between 2021 and 2025, with a slight dip overall. Net income increased modestly from $1.4B to $1.6B, while gross margin held steady near 38%. However, its net margin at 9.9% trails Linde’s by a wide margin. PPG improved EPS by 45.7% in 2025, indicating favorable bottom-line momentum despite sluggish revenue growth.
Margin Muscle vs. Revenue Resilience
Linde clearly leads in scale and profitability, with superior margins and stronger net income growth over five years. PPG shows resilience in EPS growth but lacks Linde’s margin breadth and revenue expansion. For investors prioritizing margin strength and consistent top-line gains, Linde’s profile stands out as the more compelling operational powerhouse.
Financial Ratios Comparison
These vital ratios act as a diagnostic tool to expose the underlying fiscal health, valuation premiums, and capital efficiency of the companies analyzed:
| Ratios | Linde plc (LIN) 2024 | PPG Industries (PPG) 2024 |
|---|---|---|
| ROE | 17.2% | 16.4% |
| ROIC | 9.2% | 11.0% |
| P/E | 30.5 | 25.0 |
| P/B | 5.26 | 4.12 |
| Current Ratio | 0.89 | 1.31 |
| Quick Ratio | 0.76 | 0.94 |
| D/E (Debt-to-Equity) | 0.59 | 0.94 |
| Debt-to-Assets | 28.2% | 32.9% |
| Interest Coverage | 15.0 | 9.5 |
| Asset Turnover | 0.41 | 0.82 |
| Fixed Asset Turnover | 1.28 | 3.90 |
| Payout Ratio | 40.4% | 55.7% |
| Dividend Yield | 1.32% | 2.23% |
| Fiscal Year | 2024 | 2024 |
Efficiency & Valuation Duel: The Vital Signs
Financial ratios act as a company’s DNA, revealing hidden risks and operational excellence that raw numbers alone cannot expose.
Linde plc
Linde shows strong profitability with a 17.23% ROE and a healthy 19.89% net margin, signaling operational efficiency. However, its valuation appears stretched, with a high P/E of 30.53 and a P/B of 5.26. The company returns value via a modest 1.32% dividend yield, balancing payout with ongoing investments in growth.
PPG Industries, Inc.
PPG delivers mixed signals: a solid 43.13% ROIC and favorable valuation metrics including a 14.71 P/E and positive P/B. Yet, it suffers from a deeply negative ROE at -44.48%, reflecting underlying profitability challenges. PPG offers a higher 2.71% dividend yield, prioritizing shareholder returns amid reinvestment in R&D.
Valuation Stretch vs. Operational Strength
Linde’s premium valuation contrasts with PPG’s operational robustness but weak equity returns. PPG provides better valuation and dividend yield, while Linde boasts superior profitability metrics. Investors seeking growth with operational discipline may prefer Linde; those favoring income and value might lean toward PPG.
Which one offers the Superior Shareholder Reward?
I see Linde plc offers a modest 1.32% dividend yield with a 40% payout ratio, well-covered by free cash flow at 52%. Linde also executes steady buybacks, enhancing total returns sustainably. PPG Industries, by contrast, yields 2.7%, paying out 40% dividends, but struggles with negative free cash flow and high debt. Its buyback activity is limited and riskier given financial leverage. Historically, Linde’s balanced dividend and buyback strategy with strong cash flow coverage promises more durable shareholder rewards in 2026. I favor Linde for superior total return potential and lower financial risk.
Comparative Score Analysis: The Strategic Profile
The radar chart reveals the fundamental DNA and strategic trade-offs of Linde plc and PPG Industries, Inc.:
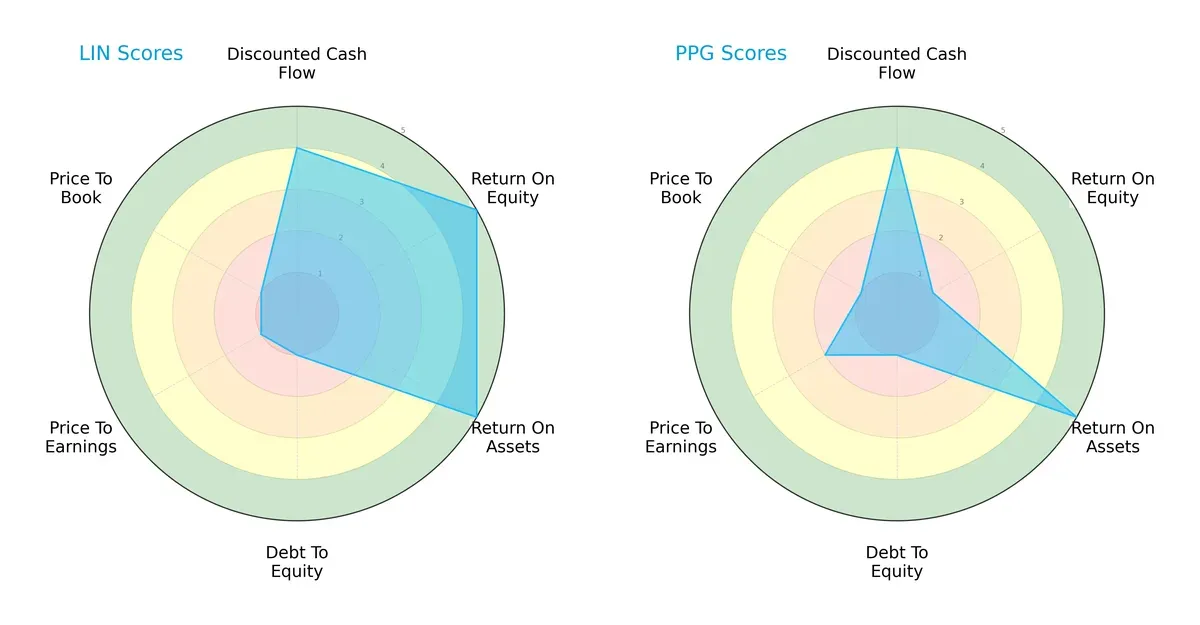
Linde excels in return on equity (ROE) and return on assets (ROA), both scoring very favorable at 5, while PPG matches Linde only on ROA. Both firms share weak debt-to-equity and price-to-book scores at 1, indicating financial leverage concerns and valuation challenges. PPG’s overall score (2) lags behind Linde’s (3), reflecting a less balanced profile. Linde leverages operational efficiency; PPG depends heavily on asset utilization but suffers from low profitability metrics.
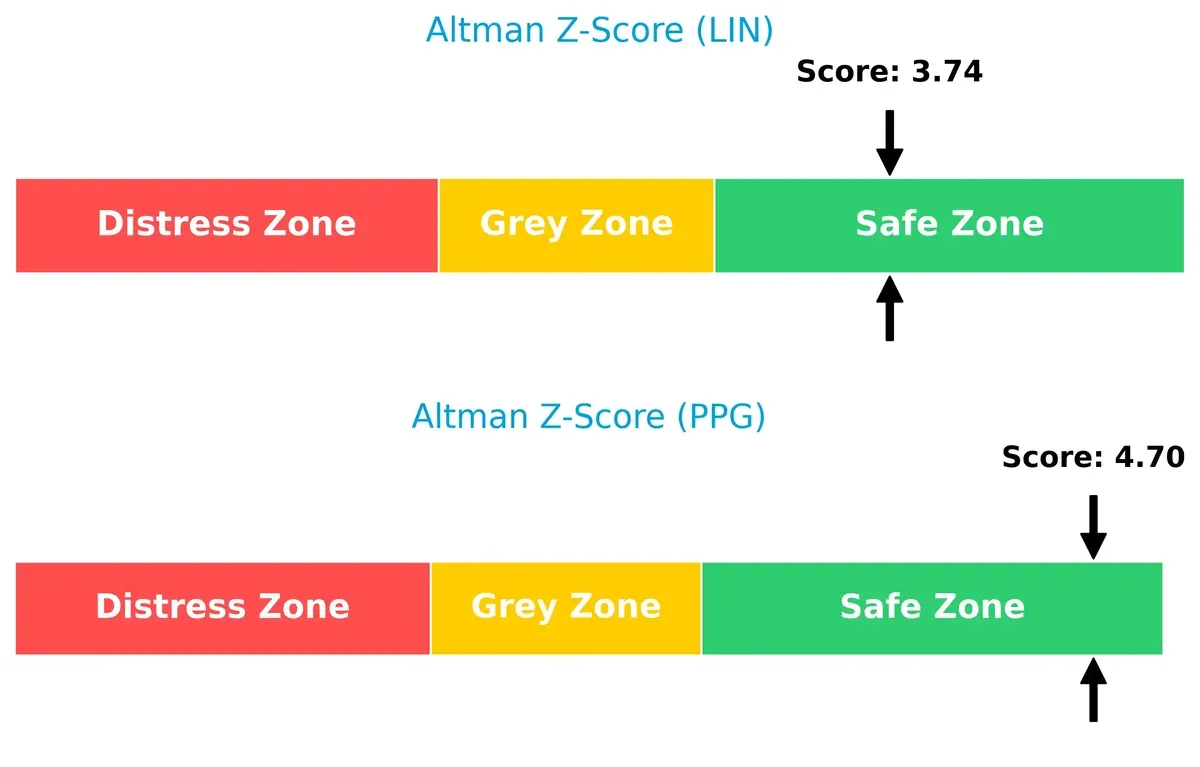
Bankruptcy Risk: Solvency Showdown
Linde’s Altman Z-Score of 3.74 and PPG’s 4.70 place both well into the safe zone, signaling strong solvency and low bankruptcy risk in this economic cycle:
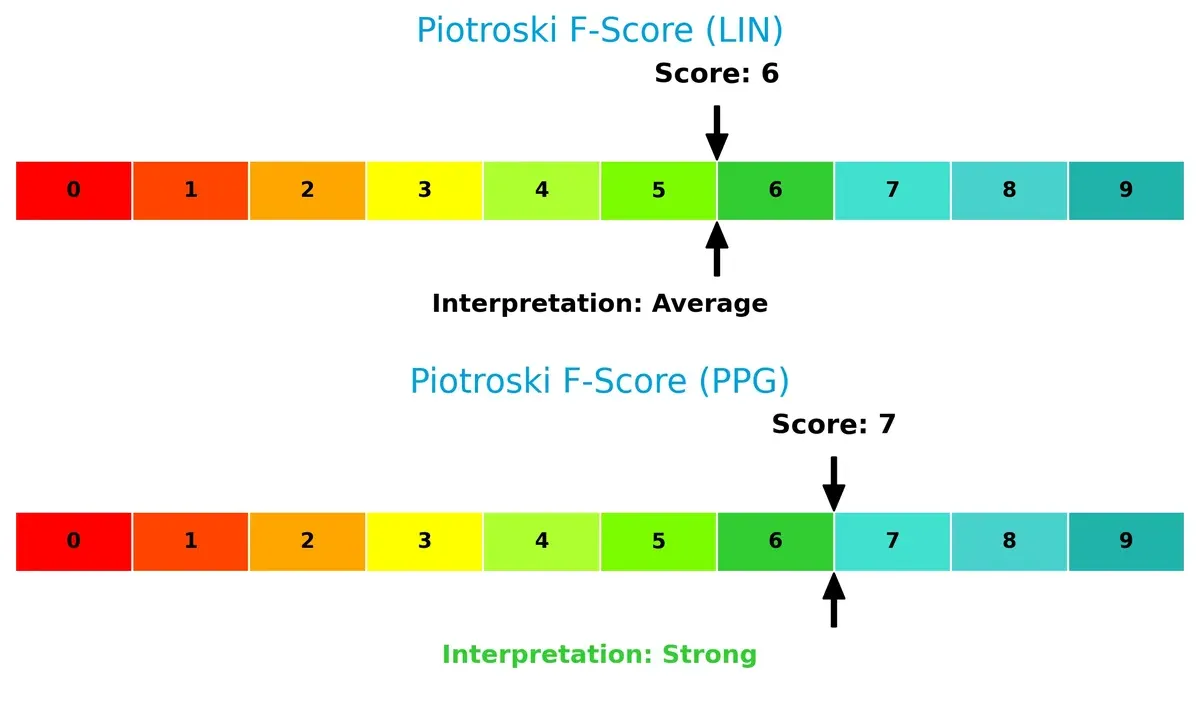
Financial Health: Quality of Operations
PPG’s Piotroski F-Score of 7 surpasses Linde’s 6, indicating stronger internal financial health and operational quality. While both firms show solid fundamentals, Linde’s slightly lower score suggests potential red flags in profitability or efficiency metrics:
How are the two companies positioned?
This section dissects the operational DNA of Linde and PPG by comparing their revenue distribution and internal strengths and weaknesses. The goal is to confront their economic moats and identify which model offers the most resilient, sustainable advantage today.
Revenue Segmentation: The Strategic Mix
This comparison dissects how Linde plc and PPG Industries diversify their income streams and reveals where their primary sector bets lie:
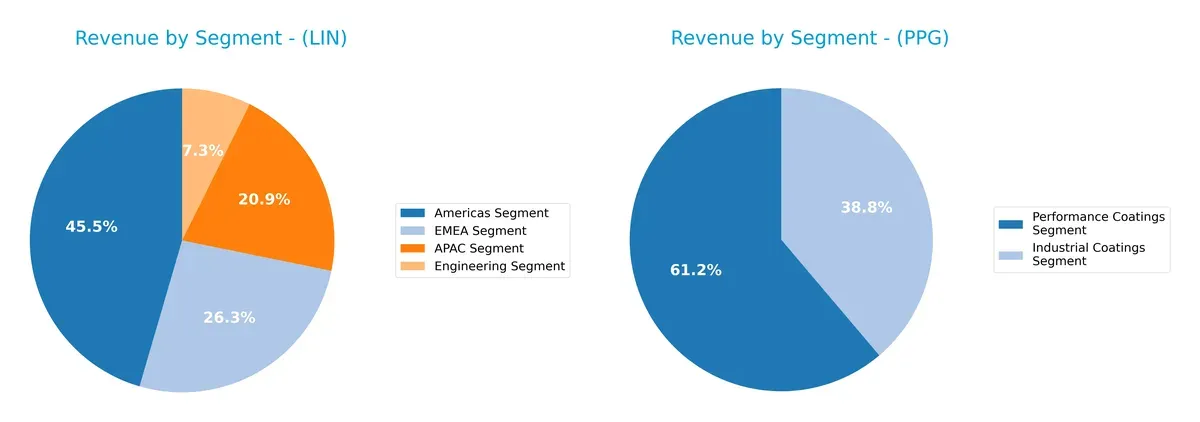
Linde’s revenue spreads across four robust segments, with Americas anchoring at $14.4B, followed by EMEA at $8.4B, APAC at $6.6B, and Engineering at $2.3B. This diversified footprint signals global infrastructure dominance and reduced concentration risk. PPG relies heavily on two segments: Performance Coatings at $11.2B and Industrial Coatings at $7.1B. This concentration pivots on coatings expertise but exposes PPG to sector-specific cyclicality.
Strengths and Weaknesses Comparison
This table compares the strengths and weaknesses of Linde plc and PPG Industries, Inc.:
Linde plc Strengths
- Diversified global revenue streams across Americas, EMEA, APAC, and Engineering segments
- Favorable net margin and ROE indicating strong profitability
- Favorable debt-to-assets and interest coverage ratios support financial stability
PPG Industries Strengths
- Favorable ROIC well above WACC shows excellent capital efficiency
- Strong liquidity ratios and low PE and PB ratios indicate undervaluation
- High asset turnover and dividend yield suggest operational efficiency and shareholder returns
Linde plc Weaknesses
- Unfavorable valuation metrics with high PE and PB ratios
- Low current and quick ratios indicate weaker short-term liquidity
- Unfavorable asset turnover may limit growth potential
PPG Industries Weaknesses
- Negative ROE reflects weak profitability
- Very high debt-to-assets ratio signals financial risk
- Fixed asset turnover at zero highlights potential asset underutilization
Overall, Linde exhibits strong profitability and diversified global presence but faces valuation and liquidity challenges. PPG shows superior capital efficiency and liquidity but struggles with profitability and high leverage, influencing its strategic financial management.
The Moat Duel: Analyzing Competitive Defensibility
A structural moat is the only shield protecting long-term profits from relentless competition erosion. Let’s break down the moats of two specialty chemical giants:
Linde plc: Engineering Scale & Operational Efficiency
Linde’s moat stems from its cost advantage and integrated engineering capabilities. Its slightly favorable ROIC growth shows rising profitability, though returns remain close to capital costs. Expansion in hydrogen and gas plant construction may deepen this moat in 2026.
PPG Industries, Inc.: Innovation & Brand Strength
PPG’s moat is rooted in intangible assets—strong brands and innovative coatings technology. It delivers very favorable ROIC exceeding WACC by a wide margin, signaling durable value creation. New product launches and aerospace coatings expansion strengthen its competitive edge.
Cost Leadership vs. Brand Innovation: Moat Showdown
PPG possesses the deeper, more durable moat with robust ROIC growth far above WACC. Linde’s operational scale is promising but less defensible. PPG is better positioned to defend and grow its market share amid industry pressures.
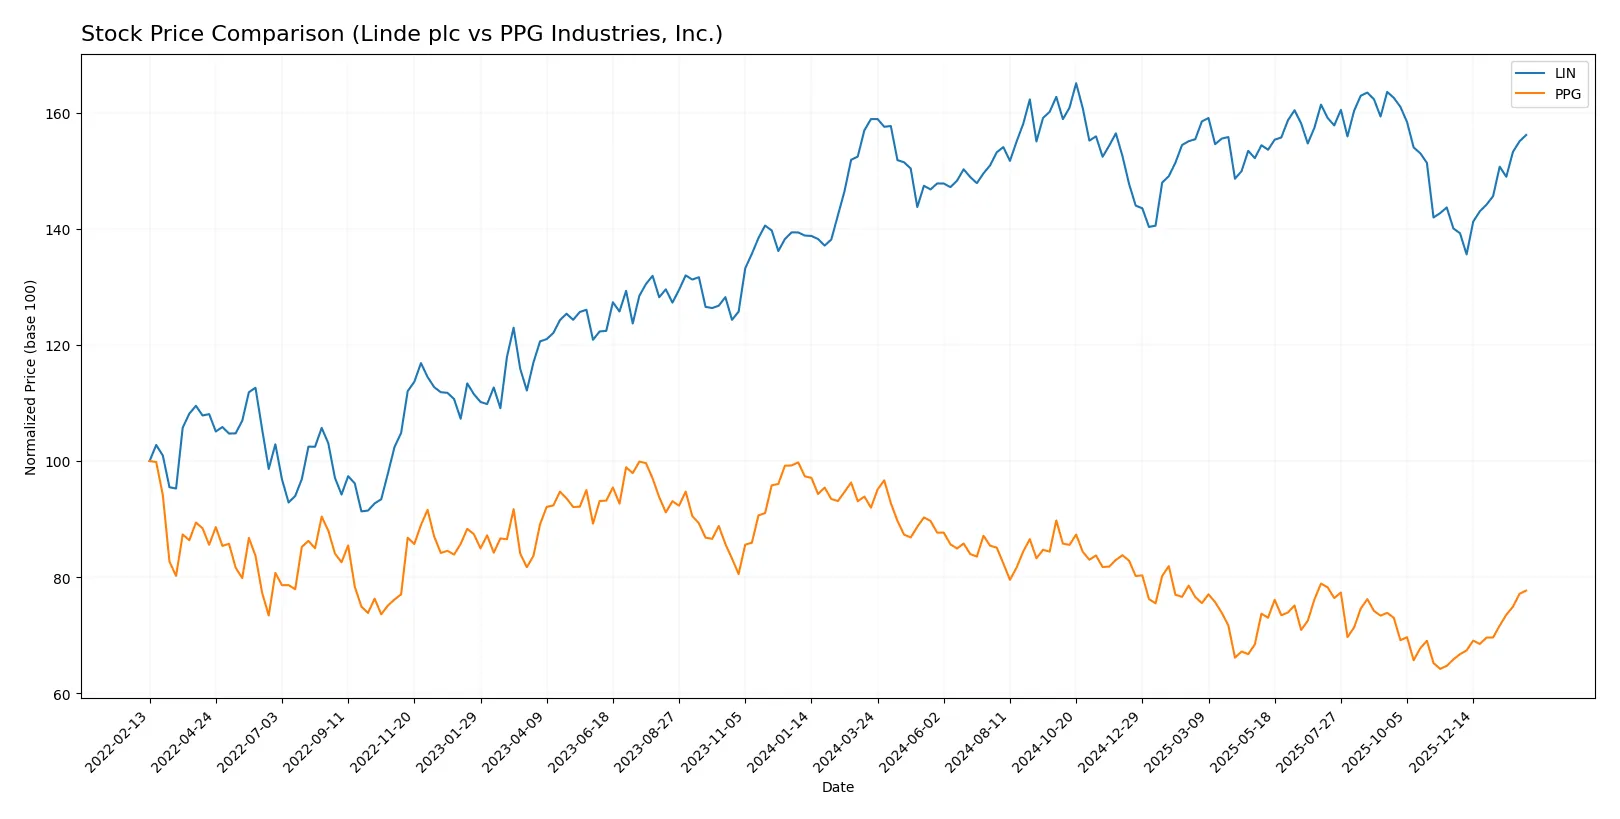
Which stock offers better returns?
The past year shows contrasting price movements: Linde plc experienced a mild overall decline with recent acceleration, while PPG Industries, Inc. faced a sharper drop but also a strong recent rebound.
Trend Comparison
Linde plc’s stock fell 1.72% over the past 12 months, indicating a bearish trend with accelerating momentum and notable volatility, peaking at 486.45 and bottoming at 399.57.
PPG Industries declined 15.52% in the same period, also bearish with accelerating loss, but showing a strong recent price gain of 17.99% amid lower volatility and a high of 144.9.
Comparing their trajectories, PPG’s larger overall loss contrasts with its stronger recent recovery, but Linde’s smaller decline and higher volatility reflect different risk-return profiles.
Target Prices
Analysts maintain a cautiously optimistic outlook for Linde plc and PPG Industries, with target consensus prices above current trading levels.
| Company | Target Low | Target High | Consensus |
|---|---|---|---|
| Linde plc | 490 | 516 | 500.33 |
| PPG Industries, Inc. | 115 | 135 | 126 |
Linde’s consensus target sits roughly 9% above its $460 price, suggesting moderate upside. PPG also offers about 8% potential gain versus its $116 current price, reflecting measured confidence.

Don’t Let Luck Decide Your Entry Point
Optimize your entry points with our advanced ProRealTime indicators. You’ll get efficient buy signals with precise price targets for maximum performance. Start outperforming now!
How do institutions grade them?
This section compares the latest institutional grades for Linde plc and PPG Industries, Inc.:
Linde plc Grades
Here are the most recent grades from reputable financial institutions for Linde plc:
| Grading Company | Action | New Grade | Date |
|---|---|---|---|
| Citigroup | Maintain | Buy | 2026-01-21 |
| RBC Capital | Maintain | Outperform | 2025-12-12 |
| UBS | Upgrade | Buy | 2025-11-11 |
| RBC Capital | Maintain | Outperform | 2025-11-06 |
| Citigroup | Maintain | Buy | 2025-11-03 |
| Seaport Global | Upgrade | Buy | 2025-11-03 |
| B of A Securities | Maintain | Buy | 2025-11-03 |
| JP Morgan | Maintain | Overweight | 2025-11-03 |
| UBS | Maintain | Neutral | 2025-10-06 |
| Citigroup | Maintain | Buy | 2025-10-06 |
PPG Industries, Inc. Grades
Below are PPG Industries, Inc.’s recent grades from established grading companies:
| Grading Company | Action | New Grade | Date |
|---|---|---|---|
| Wells Fargo | Maintain | Overweight | 2026-01-29 |
| Jefferies | Maintain | Hold | 2026-01-29 |
| UBS | Maintain | Neutral | 2026-01-29 |
| Citigroup | Maintain | Buy | 2026-01-29 |
| Goldman Sachs | Maintain | Buy | 2026-01-29 |
| JP Morgan | Maintain | Overweight | 2026-01-29 |
| RBC Capital | Maintain | Sector Perform | 2026-01-29 |
| Mizuho | Maintain | Outperform | 2026-01-28 |
| Citigroup | Maintain | Buy | 2025-12-18 |
| JP Morgan | Maintain | Overweight | 2025-11-21 |
Which company has the best grades?
Linde plc consistently receives stronger grades such as Buy and Outperform, with multiple upgrades. PPG has a mix of Buy, Overweight, and Hold grades, suggesting more moderate enthusiasm. Investors may interpret Linde’s superior consensus as a sign of higher confidence from analysts.
Risks specific to each company
The following categories identify the critical pressure points and systemic threats facing both firms in the 2026 market environment:
1. Market & Competition
Linde plc
- Dominates industrial gases with strong global footprint but faces pressure from energy transition and new tech entrants.
PPG Industries, Inc.
- Operates in specialty coatings with diverse segments but contends with intense competition and cyclicality in construction and automotive markets.
2. Capital Structure & Debt
Linde plc
- Maintains moderate debt levels with favorable debt-to-assets (28%) and strong interest coverage (16x).
PPG Industries, Inc.
- Exhibits high leverage with unfavorable debt-to-assets (94%) but decent interest coverage (9.5x), raising financial risk concerns.
3. Stock Volatility
Linde plc
- Beta at 0.86 implies lower volatility than the market, suggesting relative stability.
PPG Industries, Inc.
- Beta at 1.16 indicates higher volatility and sensitivity to market swings, increasing investment risk.
4. Regulatory & Legal
Linde plc
- Exposure to global environmental regulations on gases and energy usage; compliance costs may rise.
PPG Industries, Inc.
- Faces strict regulations on chemical coatings and emissions; risk of costly litigation and compliance expenditures.
5. Supply Chain & Operations
Linde plc
- Complex global supply chain with risks related to raw material costs and geopolitical disruptions.
PPG Industries, Inc.
- Supply chain exposed to raw material price volatility and operational interruptions in industrial coatings production.
6. ESG & Climate Transition
Linde plc
- Actively invests in hydrogen and clean energy solutions, positioning well for climate transition.
PPG Industries, Inc.
- ESG efforts ongoing but faces challenges in reducing carbon footprint due to chemical manufacturing processes.
7. Geopolitical Exposure
Linde plc
- Global operations across Americas, Europe, MEA, and Asia expose it to geopolitical risks but diversify regional dependencies.
PPG Industries, Inc.
- Primarily US-based with international exposure; geopolitical tensions could impact export markets and supply chains.
Which company shows a better risk-adjusted profile?
Linde’s most impactful risk is its exposure to evolving energy regulations and the need to innovate in clean technologies. PPG’s principal concern lies in its high leverage and operational cyclicality amid volatile raw material costs. Despite these challenges, PPG’s favorable liquidity ratios and strong Altman Z-Score contrast with Linde’s weaker current and quick ratios. Overall, Linde presents a more balanced risk profile due to its global diversification and strategic climate investments, while PPG’s financial leverage elevates its risk despite operational strengths. The recent surge in PPG’s debt-to-assets ratio to 94% sharply highlights its capital structure vulnerability.
Final Verdict: Which stock to choose?
Linde plc’s superpower lies in its efficient capital deployment and steady profitability growth. It consistently expands margins and earnings, signaling a disciplined management team. However, its weak liquidity ratios suggest a point of vigilance for short-term financial flexibility. This stock fits well in aggressive growth portfolios seeking durable operational efficiency.
PPG Industries, Inc. boasts a strategic moat through its robust return on invested capital, far exceeding its cost of capital, indicating a durable competitive advantage. It offers better liquidity and balance sheet strength relative to Linde, appealing to investors favoring resilience. PPG suits GARP portfolios that value solid growth with reasonable financial safety.
If you prioritize disciplined capital use and margin expansion, Linde plc is the compelling choice due to its improving profitability despite liquidity concerns. However, if you seek durable competitive advantage combined with stronger balance sheet stability, PPG Industries offers better stability and a more attractive risk profile. Both present valid analytical scenarios depending on your portfolio’s risk tolerance and growth ambitions.
Disclaimer: Investment carries a risk of loss of initial capital. The past performance is not a reliable indicator of future results. Be sure to understand risks before making an investment decision.
Go Further
I encourage you to read the complete analyses of Linde plc and PPG Industries, Inc. to enhance your investment decisions: