Home > Comparison > Basic Materials > LIN vs LYB
The strategic rivalry between Linde plc and LyondellBasell Industries defines the modern landscape of the specialty chemicals sector. Linde is a capital-intensive industrial gas and engineering powerhouse, while LyondellBasell operates as an integrated chemical manufacturer with refining capabilities. This head-to-head contrasts asset-heavy industrial engineering with diversified chemical production. This analysis aims to identify which model delivers a superior risk-adjusted return for a balanced portfolio in 2026.
Table of contents
Companies Overview
Linde plc and LyondellBasell Industries N.V. hold pivotal roles in the global specialty chemicals market.
Linde plc: Global Industrial Gas Leader
Linde plc dominates the industrial gas sector, generating revenue through atmospheric and process gases like oxygen and hydrogen. Its strategic focus in 2026 centers on expanding turnkey process plant engineering, serving diverse industries including healthcare and aerospace. This broad industrial footprint underpins its competitive advantage and resilient market position.
LyondellBasell Industries N.V.: Polyolefin and Chemical Powerhouse
LyondellBasell Industries commands the polyolefins and intermediates market, producing polyethylene, polypropylene, and refining crude oil into fuels. Its 2026 strategy emphasizes technology development and advanced polymer solutions, blending chemical production with refining. This integrated approach fuels its stronghold in multiple global regions and product segments.
Strategic Collision: Similarities & Divergences
Both companies operate in specialty chemicals but differ in focus: Linde pursues a gas and engineering ecosystem, while LyondellBasell adopts an integrated chemical and refining model. Their main battle lies in supplying industrial and chemical inputs globally. Investors face contrasting profiles—Linde offers industrial stability, whereas LyondellBasell provides diversified chemical innovation with refining exposure.
Income Statement Comparison
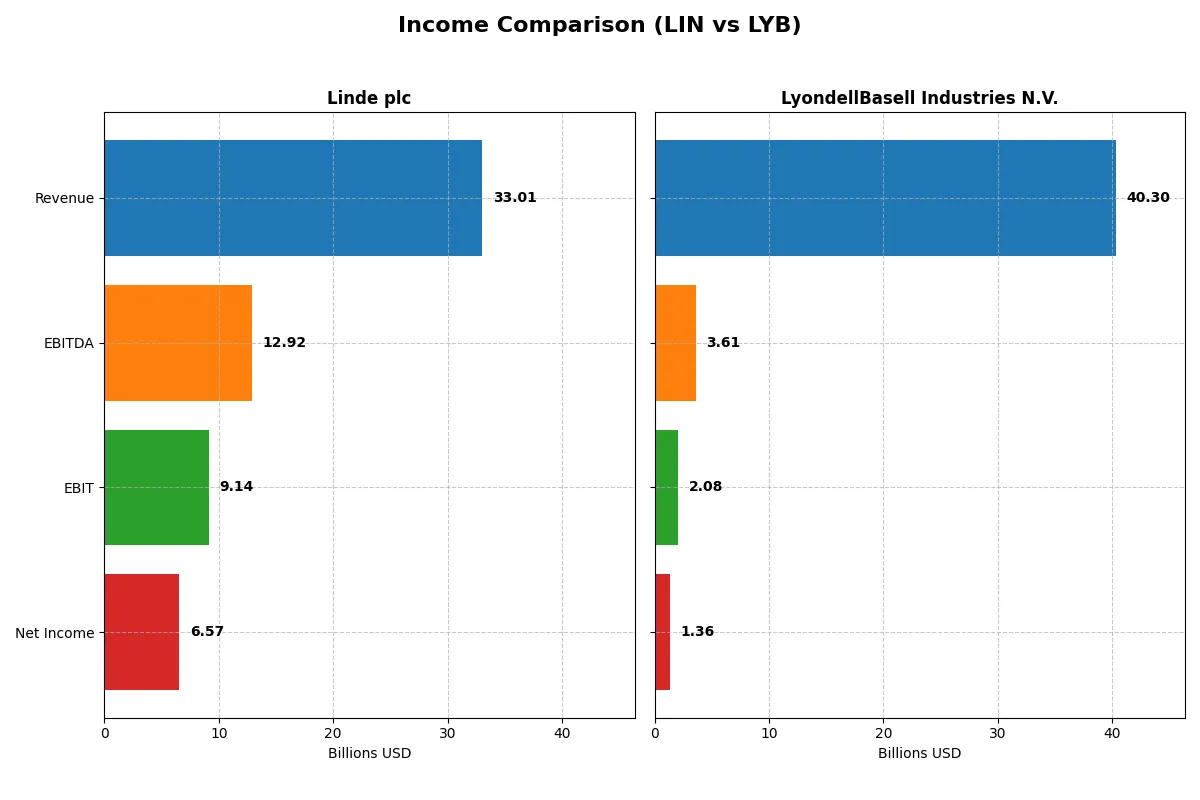
This data dissects the core profitability and scalability of both corporate engines to reveal who dominates the bottom line:
| Metric | Linde plc (LIN) | LyondellBasell (LYB) |
|---|---|---|
| Revenue | 33B | 40.3B |
| Cost of Revenue | 20.9B | 35.7B |
| Operating Expenses | 3.49B | 2.75B |
| Gross Profit | 12.1B | 4.56B |
| EBITDA | 12.9B | 3.61B |
| EBIT | 9.14B | 2.08B |
| Interest Expense | 572M | 481M |
| Net Income | 6.57B | 1.35B |
| EPS | 13.71 | 4.16 |
| Fiscal Year | 2024 | 2024 |
Income Statement Analysis: The Bottom-Line Duel
This income statement comparison reveals the true operational efficiency and profitability trends shaping each company’s financial engine.
Linde plc Analysis
Linde’s revenue steadily climbs, reaching $33B in 2024 with net income surging to $6.57B, reflecting strong growth momentum. Gross and net margins remain robust at 36.6% and 19.9%, respectively, demonstrating disciplined cost control and operational leverage. The latest year shows expanding EBIT and EPS, signaling improving efficiency and shareholder value creation.
LyondellBasell Industries N.V. Analysis
LyondellBasell’s revenue peaked in 2022 at $50B but declined to $40.3B by 2024, dragging net income down to $1.35B. Margins contracted sharply, with a gross margin of 11.3% and net margin just 3.4%, highlighting margin pressure and weaker profitability. The recent year shows pronounced declines in EBIT and EPS, indicating operational challenges and deteriorating bottom-line health.
Margin Strength vs. Revenue Volatility
Linde clearly outperforms with superior margin expansion and consistent net income growth, while LyondellBasell struggles with margin erosion despite higher absolute revenue. Linde’s profile offers a more stable and efficient growth trajectory, appealing to investors prioritizing profitability over sheer scale.
Financial Ratios Comparison
These vital ratios act as a diagnostic tool to expose underlying fiscal health, valuation premiums, and capital efficiency for clear investor insight:
| Ratios | Linde plc (LIN) | LyondellBasell Industries N.V. (LYB) |
|---|---|---|
| ROE | 17.23% | 10.91% |
| ROIC | 9.19% | 5.15% |
| P/E | 30.53 | 17.75 |
| P/B | 5.26 | 1.94 |
| Current Ratio | 0.89 | 1.83 |
| Quick Ratio | 0.76 | 1.13 |
| D/E (Debt-to-Equity) | 0.59 | 1.04 |
| Debt-to-Assets | 28.21% | 36.15% |
| Interest Coverage | 15.03 | 3.78 |
| Asset Turnover | 0.41 | 1.13 |
| Fixed Asset Turnover | 1.28 | 2.44 |
| Payout ratio | 40.44% | 126.47% |
| Dividend yield | 1.32% | 7.13% |
| Fiscal Year | 2024 | 2024 |
Efficiency & Valuation Duel: The Vital Signs
Financial ratios act as a company’s DNA, uncovering hidden risks and operational strengths crucial for investor insight.
Linde plc
Linde shows robust profitability with a 17.23% ROE and a strong 19.89% net margin, signaling operational excellence. Its valuation appears stretched at a 30.53 P/E and 5.26 P/B, reflecting premium market pricing. Shareholders receive a modest 1.32% dividend yield, balancing income with stable reinvestment.
LyondellBasell Industries N.V.
LyondellBasell’s key profitability metrics are unavailable or unfavorable, indicating operational challenges. Valuation metrics like P/E and P/B stand at zero, suggesting data gaps or market neglect. Liquidity ratios are weak, and the absence of dividends signals limited shareholder returns or reinvestment clarity.
Premium Valuation vs. Operational Transparency
Linde offers a clearer picture of profitability despite a high valuation, while LyondellBasell’s missing data and weak metrics raise caution. Investors prioritizing stable returns and transparency may find Linde’s profile more reassuring, whereas LyondellBasell fits those accepting greater uncertainty.
Which one offers the Superior Shareholder Reward?
I observe Linde plc (LIN) delivers a balanced distribution strategy with a 1.32% dividend yield and a prudent 40% payout ratio, supported by steady free cash flow coverage above 50%. Linde’s moderate buybacks complement dividends, enhancing total shareholder returns sustainably. In contrast, LyondellBasell Industries (LYB) pays a high 7.13% dividend yield but with a payout ratio exceeding 126%, risking dividend sustainability. LYB’s buybacks are less significant, reflecting a more aggressive, less conservative distribution approach. Given the long-term value creation, I favor Linde’s disciplined model over LYB’s high-yield but riskier payout in 2026.
Comparative Score Analysis: The Strategic Profile
The radar chart reveals the core DNA and trade-offs of Linde plc and LyondellBasell Industries N.V., highlighting their strategic strengths and vulnerabilities:
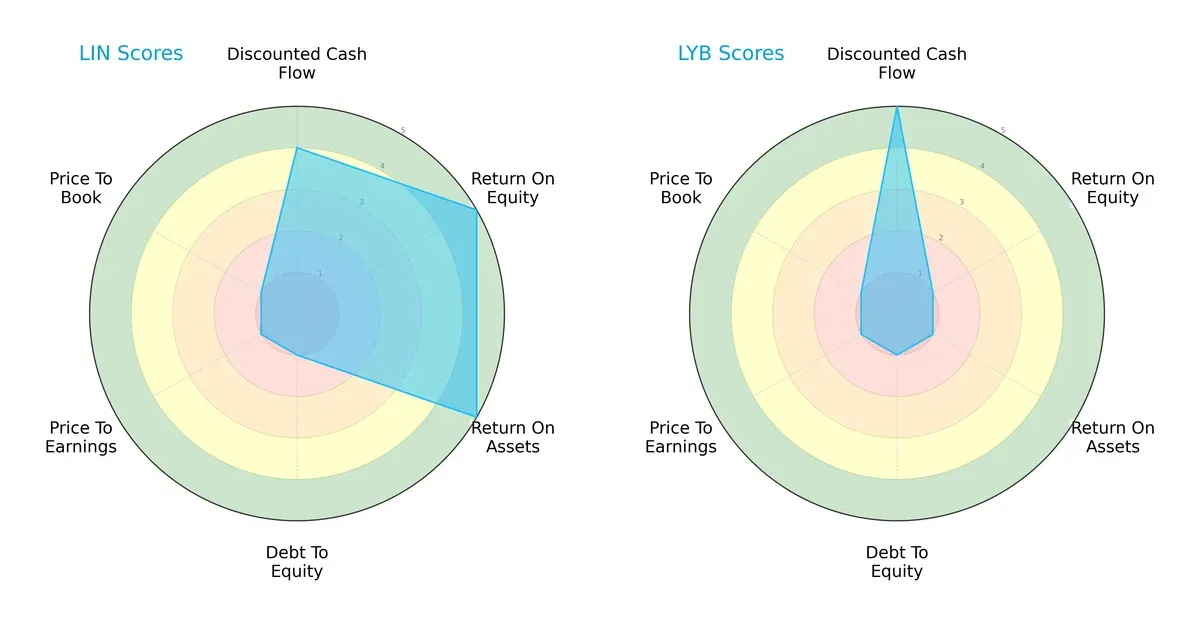
Linde shows a balanced profile with strong ROE (5) and ROA (5), signaling efficient capital and asset use. However, its heavy debt load weakens its financial risk score (1). LyondellBasell leans on a top-tier DCF score (5) but falters on profitability (ROE and ROA at 1) and shares Linde’s poor debt and valuation scores. Linde’s diversified strengths make it more stable, while LyondellBasell depends largely on cash flow projections.
Bankruptcy Risk: Solvency Showdown
Linde’s Altman Z-Score of 3.74 places it securely in the safe zone, far outperforming LyondellBasell, whose score is unavailable. This suggests Linde’s superior long-term survival odds in volatile cycles:

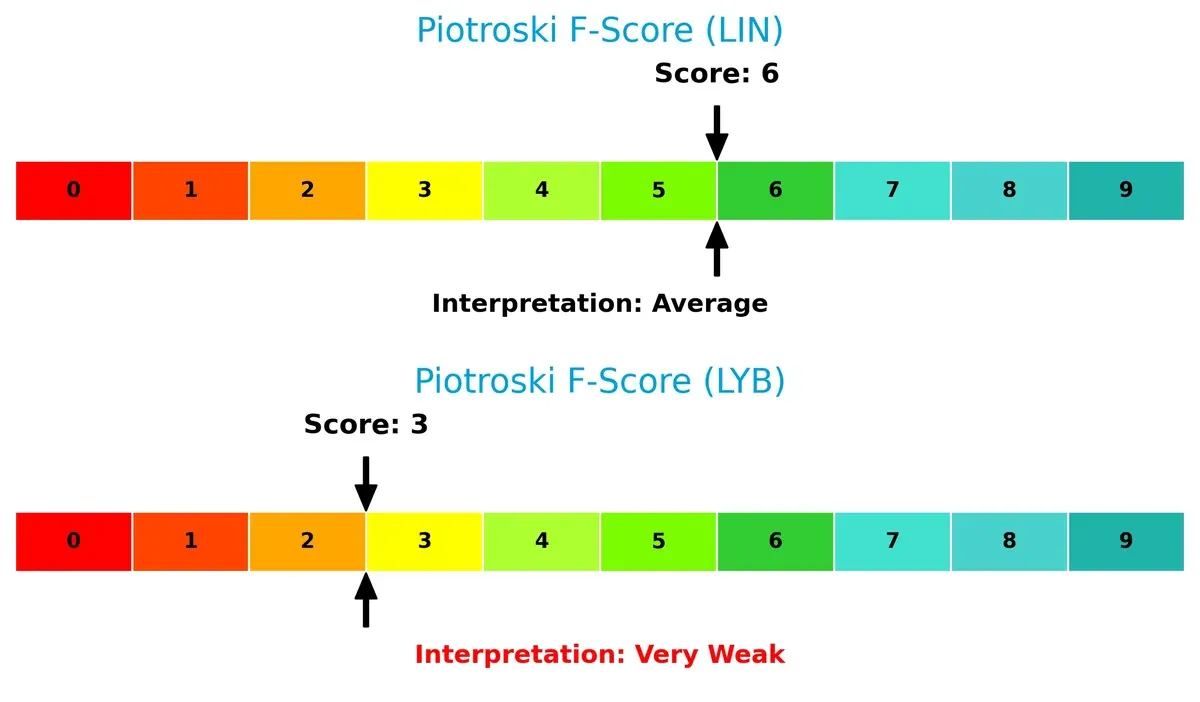
Financial Health: Quality of Operations
Linde’s Piotroski F-Score of 6 reflects solid financial health and operational quality. In contrast, LyondellBasell’s lower score of 3 signals red flags in internal metrics and weaker fundamentals:
How are the two companies positioned?
This section dissects LIN and LYB’s operational DNA by comparing their revenue distribution and internal dynamics—strengths and weaknesses. The goal is to confront their economic moats and identify which model offers the most resilient competitive advantage today.
Revenue Segmentation: The Strategic Mix
This visual comparison dissects how Linde plc and LyondellBasell Industries N.V. diversify their income streams and where their primary sector bets lie:
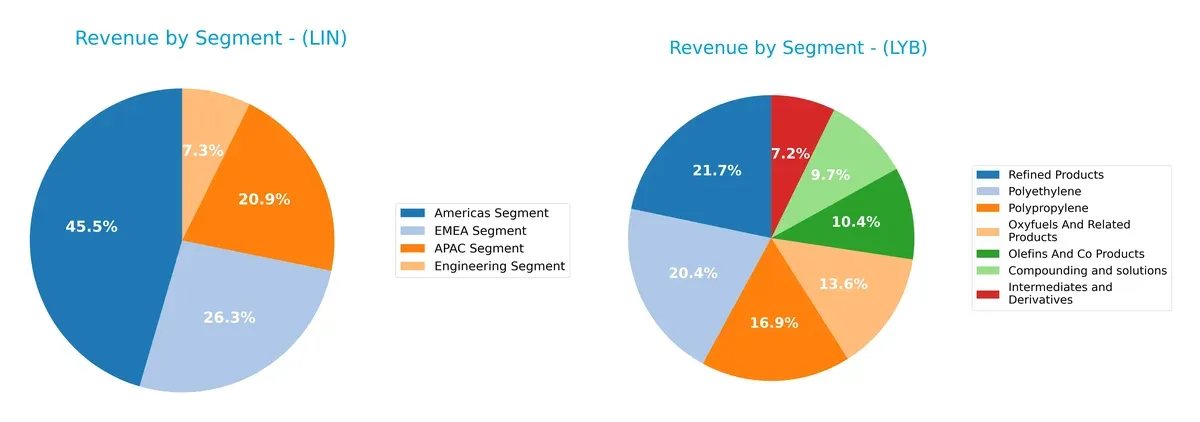
Linde anchors revenue across four balanced segments, with Americas leading at $14.4B, followed by EMEA ($8.35B), APAC ($6.63B), and Engineering ($2.32B). This diversification mitigates regional risks. LyondellBasell, however, pivots heavily on Refined Products ($8.08B) and Polyethylene ($7.58B), creating concentration risk but benefiting from infrastructure dominance in petrochemicals. Linde’s broader mix suggests stronger resilience versus LyondellBasell’s sector-specific exposure.
Strengths and Weaknesses Comparison
This table compares the Strengths and Weaknesses of Linde plc and LyondellBasell Industries N.V.:
Linde plc Strengths
- Diversified revenue across Americas, EMEA, APAC, and engineering segments
- Strong net margin of 19.89%
- Favorable debt to assets at 28.21%
- High interest coverage ratio of 15.98
- Global presence including US, China, Germany, UK
LyondellBasell Strengths
- Broad product segmentation across polyethylene, polypropylene, refined products
- Favorable debt/equity ratio
- Strong US revenue concentration at $19.5B in 2024
- Favorable P/E and P/B ratios
- Diverse geographic exposure including Europe, North America, and Asia
Linde plc Weaknesses
- Low current ratio at 0.89 and quick ratio at 0.76 indicate liquidity concerns
- Unfavorable P/E of 30.53 and P/B of 5.26
- Neutral ROIC of 9.19% only slightly above WACC
- Low asset turnover of 0.41
- High valuation multiples relative to profitability
LyondellBasell Weaknesses
- Zero reported profitability metrics (net margin, ROE, ROIC)
- Unavailable WACC limits cost of capital assessment
- Poor liquidity ratios with zero current and quick ratios reported
- Low interest coverage ratio at 4.33
- Unfavorable asset turnover and fixed asset turnover at zero
Linde demonstrates robust profitability and global diversification but faces liquidity and valuation challenges. LyondellBasell’s strengths lie in product and geographic diversity and a solid capital structure, yet it struggles with profitability and liquidity metrics, posing strategic risks.
The Moat Duel: Analyzing Competitive Defensibility
A structural moat is the sole protector of long-term profits against relentless competition erosion. Let’s dissect how each company’s moat shapes its future:
Linde plc: Engineering a Cost Advantage Moat
Linde leverages scale and engineering expertise to maintain superior operational efficiency. Its stable 27.7% EBIT margin confirms disciplined capital use. Expansion in hydrogen and rare gases could deepen its moat in 2026.
LyondellBasell Industries N.V.: Innovation in Advanced Polymers
LyondellBasell’s moat stems from specialized polymer technologies and refining integration, contrasting with Linde’s broad industrial gas focus. However, its declining ROIC trend signals weakening capital returns. New polymer solutions offer potential upside but carry execution risk.
Verdict: Cost Leadership vs. Technological Specialization
Linde holds a wider moat, demonstrated by growing ROIC and margin stability. LyondellBasell’s shrinking profitability and uncertain ROIC trend reveal a vulnerable moat. Linde is better positioned to defend market share in 2026.
Which stock offers better returns?
The past year showed contrasting dynamics between Linde plc and LyondellBasell Industries N.V., with both stocks experiencing bearish trends overall but recent rebounds signaling potential momentum shifts.
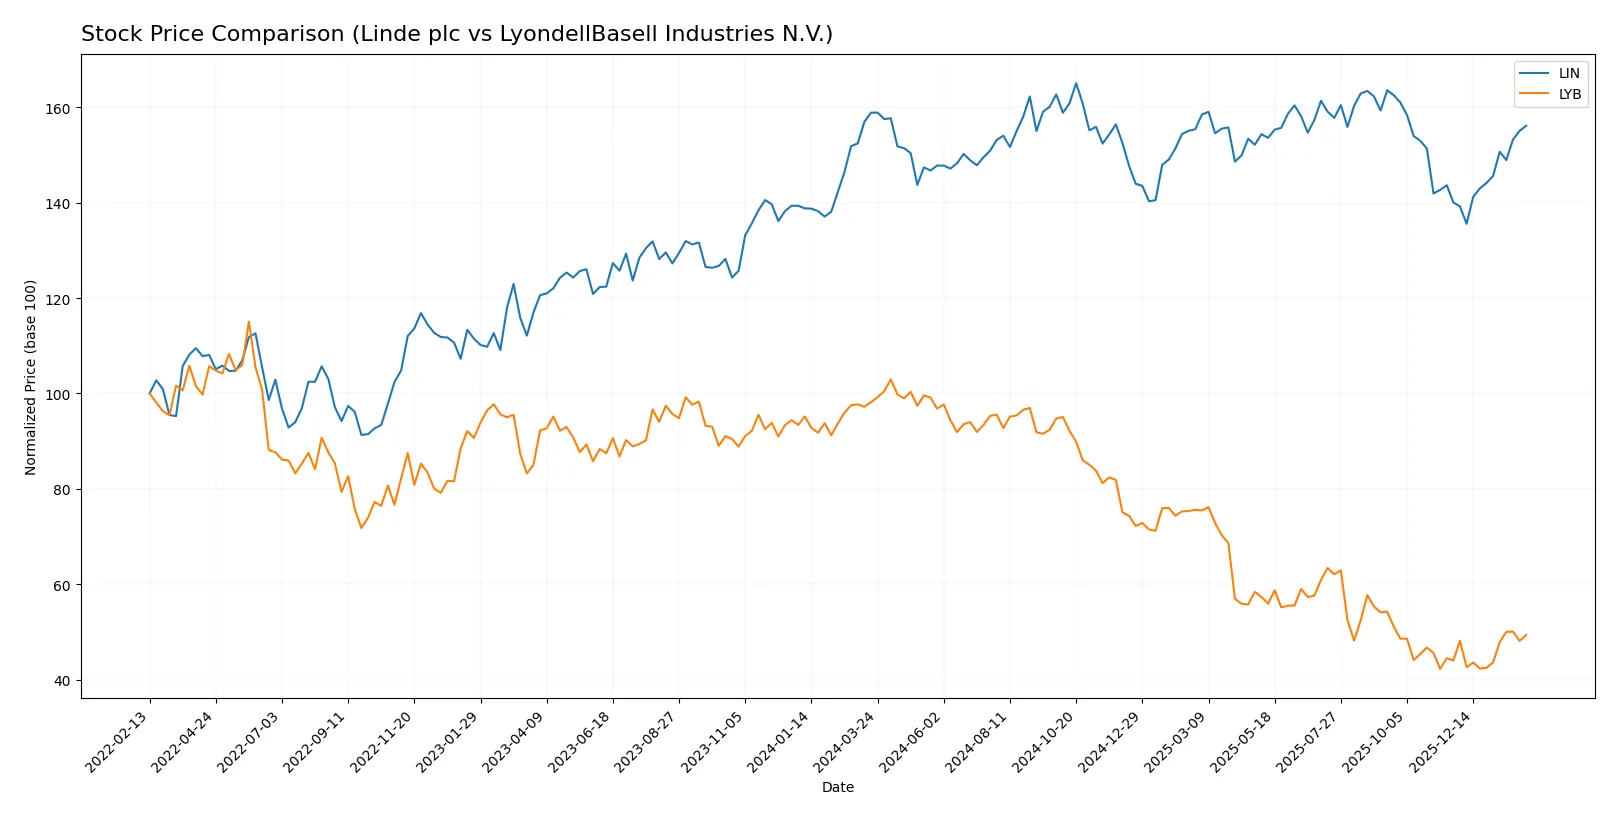
Trend Comparison
Linde plc’s stock declined 1.72% over the past year, marking a bearish trend with accelerating price movements. It ranged between 399.57 and 486.45, showing increased volatility. Recent months saw an 11.49% price gain with a strong upward slope.
LyondellBasell Industries N.V. faced a steep 49.7% drop over the same period, also bearish with accelerating decline and high volatility. Its price fluctuated between 43.02 and 104.78. Recently, it gained 12.17%, but with a gentler upward slope and lower volatility.
Comparing both, Linde plc delivered a less severe loss overall and showed a solid recent rebound, while LyondellBasell’s performance was weaker despite a slightly higher recent gain.
Target Prices
Analysts present a cautiously optimistic target consensus for Linde plc and LyondellBasell Industries N.V.
| Company | Target Low | Target High | Consensus |
|---|---|---|---|
| Linde plc | 490 | 516 | 500.33 |
| LyondellBasell Industries N.V. | 36 | 53 | 46.63 |
The consensus target for Linde at $500.33 exceeds its current $460.16 price, signaling moderate upside. LyondellBasell’s $46.63 consensus is slightly below its $50.27 market price, indicating cautious analyst expectations.

Don’t Let Luck Decide Your Entry Point
Optimize your entry points with our advanced ProRealTime indicators. You’ll get efficient buy signals with precise price targets for maximum performance. Start outperforming now!
How do institutions grade them?
Linde plc Grades
The following table summarizes recent grades assigned to Linde plc by key financial institutions.
| Grading Company | Action | New Grade | Date |
|---|---|---|---|
| Citigroup | Maintain | Buy | 2026-01-21 |
| RBC Capital | Maintain | Outperform | 2025-12-12 |
| UBS | Upgrade | Buy | 2025-11-11 |
| RBC Capital | Maintain | Outperform | 2025-11-06 |
| Citigroup | Maintain | Buy | 2025-11-03 |
| Seaport Global | Upgrade | Buy | 2025-11-03 |
| B of A Securities | Maintain | Buy | 2025-11-03 |
| JP Morgan | Maintain | Overweight | 2025-11-03 |
| UBS | Maintain | Neutral | 2025-10-06 |
| Citigroup | Maintain | Buy | 2025-10-06 |
LyondellBasell Industries N.V. Grades
The following table lists recent grades assigned to LyondellBasell Industries N.V. by major grading firms.
| Grading Company | Action | New Grade | Date |
|---|---|---|---|
| RBC Capital | Maintain | Sector Perform | 2026-01-16 |
| Citigroup | Maintain | Neutral | 2026-01-15 |
| UBS | Maintain | Sell | 2025-12-23 |
| Wells Fargo | Downgrade | Equal Weight | 2025-12-19 |
| Citigroup | Maintain | Neutral | 2025-12-18 |
| BMO Capital | Downgrade | Underperform | 2025-12-15 |
| Mizuho | Maintain | Neutral | 2025-12-11 |
| Citigroup | Maintain | Neutral | 2025-11-19 |
| Evercore ISI Group | Maintain | In Line | 2025-11-11 |
| Wells Fargo | Maintain | Overweight | 2025-11-03 |
Which company has the best grades?
Linde plc consistently receives Buy and Outperform grades, indicating stronger institutional confidence. LyondellBasell’s grades range from Sell to Neutral, reflecting more cautious sentiment. This divergence may influence investor perception of growth potential and risk.
Risks specific to each company
The following categories identify critical pressure points and systemic threats facing Linde plc and LyondellBasell Industries in the 2026 market environment:
1. Market & Competition
Linde plc
- Operates globally in industrial gases with strong market presence and diversified industries.
LyondellBasell Industries N.V.
- Competes in chemicals and refining with exposure to volatile commodity prices and cyclical demand.
2. Capital Structure & Debt
Linde plc
- Moderate debt-to-equity ratio (0.59), favorable debt-to-assets (28%), and strong interest coverage (16x).
LyondellBasell Industries N.V.
- Debt metrics unavailable but interest coverage moderate at 4.3x; debt-to-equity reportedly favorable but less transparent.
3. Stock Volatility
Linde plc
- Beta of 0.855 indicates lower volatility than market average, supporting stability.
LyondellBasell Industries N.V.
- Beta of 0.739 shows even lower volatility, but higher trading volume suggests more speculative moves.
4. Regulatory & Legal
Linde plc
- Exposure to environmental regulations for industrial gases and plant construction projects globally.
LyondellBasell Industries N.V.
- Faces complex chemical and refining regulations in multiple jurisdictions, increasing compliance costs.
5. Supply Chain & Operations
Linde plc
- Global operations with integrated engineering services; asset turnover below industry average signals efficiency challenges.
LyondellBasell Industries N.V.
- Diverse production footprint with refining and chemical segments; asset turnover data unavailable, suggesting opacity.
6. ESG & Climate Transition
Linde plc
- Engaged in hydrogen and sustainable gas solutions; ESG risks tied to emissions and energy use.
LyondellBasell Industries N.V.
- Chemical refining operations pose higher carbon footprint; transition risks more acute amid tightening regulations.
7. Geopolitical Exposure
Linde plc
- Operates in multiple regions including Europe and Asia, subject to geopolitical tensions and trade policies.
LyondellBasell Industries N.V.
- US-based with significant European and Asian operations; geopolitical risks include tariffs and supply disruptions.
Which company shows a better risk-adjusted profile?
Linde’s strongest risk is its suboptimal liquidity ratios, which may strain short-term obligations. LyondellBasell grapples with zero profitability metrics, signaling severe operational and financial distress. Between the two, Linde presents a better risk-adjusted profile, benefiting from stable earnings and stronger credit metrics. Notably, LyondellBasell’s zero net margin and ROE in 2025 raise red flags about sustainable profitability and capital efficiency.
Final Verdict: Which stock to choose?
Linde plc’s superpower lies in its steadily growing profitability and disciplined capital allocation that edges toward building a durable moat. Its slight vulnerability is a less-than-ideal liquidity position, which calls for vigilance amid economic shifts. This makes it a fit for portfolios targeting steady, long-term growth with moderate risk tolerance.
LyondellBasell’s strategic moat centers on its raw material integration and cash flow generation, offering a value proposition backed by tangible assets. Relative to Linde, it presents a more conservative profile but currently struggles with declining returns and profitability, fitting portfolios that prioritize value and income with a higher tolerance for operational volatility.
If you prioritize resilient growth and improving returns on invested capital, Linde outshines due to its consistent profitability and improving operational metrics. However, if you seek value-oriented exposure with a focus on asset backing and potential recovery, LyondellBasell offers better stability despite its current challenges. Both carry risks that demand careful monitoring, especially liquidity and earnings consistency.
Disclaimer: Investment carries a risk of loss of initial capital. The past performance is not a reliable indicator of future results. Be sure to understand risks before making an investment decision.
Go Further
I encourage you to read the complete analyses of Linde plc and LyondellBasell Industries N.V. to enhance your investment decisions: