Home > Comparison > Industrials > LECO vs SWK
The strategic rivalry between Lincoln Electric Holdings, Inc. and Stanley Black & Decker, Inc. shapes the tools and accessories manufacturing industry. Lincoln Electric operates as a specialized welding products manufacturer with a global reach. Stanley Black & Decker combines professional tools and industrial equipment, serving diverse end markets. This analysis pits Lincoln’s focused expertise against Stanley’s broad industrial footprint to identify which offers superior risk-adjusted returns for a diversified portfolio in 2026.
Table of contents
Companies Overview
Lincoln Electric Holdings, Inc. and Stanley Black & Decker, Inc. stand as pillars in the global tools and accessories manufacturing market.
Lincoln Electric Holdings, Inc.: Welding and Cutting Innovator
Lincoln Electric commands a strong market position in welding and cutting products worldwide. Its core revenue derives from selling arc welding power sources, robotic welding packages, and consumables. In 2026, Lincoln focuses strategically on expanding its integrated automation systems and enhancing its international welding segments to capture industrial fabrication and heavy manufacturing demand.
Stanley Black & Decker, Inc.: Diverse Tools & Industrial Leader
Stanley Black & Decker leads with a broad product portfolio spanning professional power tools, fastening systems, and heavy equipment. It generates revenue through tools and storage sales plus industrial engineered fastening systems. The company’s 2026 strategy centers on innovation in cordless tools and pipeline equipment, targeting both consumer and industrial markets globally.
Strategic Collision: Similarities & Divergences
Both firms emphasize industrial tools but differ sharply in focus. Lincoln Electric pursues a specialized welding ecosystem, while Stanley Black & Decker operates a diversified product mix across consumer and industrial sectors. Their primary battleground is professional-grade tools where market share hinges on innovation and distribution scale. These contrasts define distinct investment profiles: Lincoln offers niche industrial exposure, Stanley delivers broad-market industrial resilience.
Income Statement Comparison
This data dissects the core profitability and scalability of both corporate engines to reveal who dominates the bottom line:
| Metric | Lincoln Electric Holdings, Inc. (LECO) | Stanley Black & Decker, Inc. (SWK) |
|---|---|---|
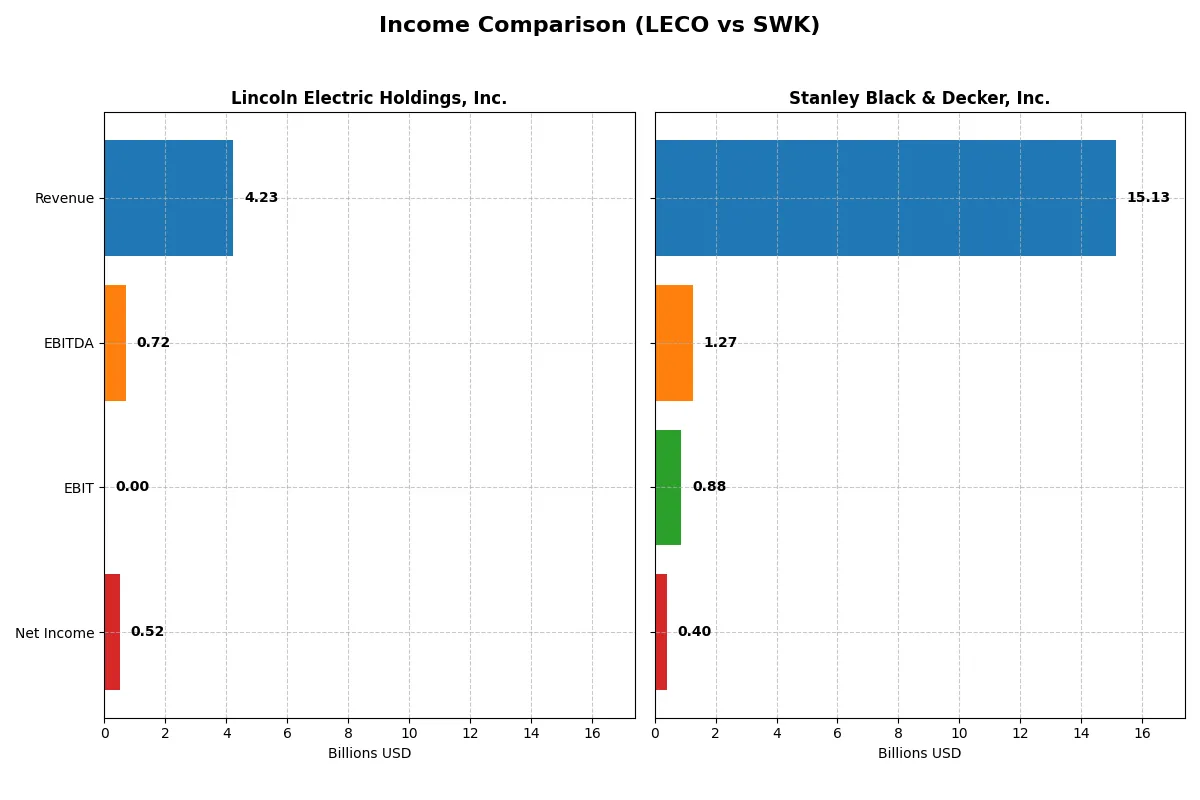
| Revenue | 4.23B | 15.13B |
| Cost of Revenue | 2.70B | 10.61B |
| Operating Expenses | 798M | 3.36B |
| Gross Profit | 1.53B | 4.52B |
| EBITDA | 718M | 1.27B |
| EBIT | – | 880M |
| Interest Expense | 52M | 465M |
| Net Income | 521M | 402M |
| EPS | 9.39 | 2.65 |
| Fiscal Year | 2025 | 2025 |
Income Statement Analysis: The Bottom-Line Duel
Comparing these income statements reveals which company operates with greater efficiency and delivers stronger shareholder returns.
Lincoln Electric Holdings, Inc. (LECO) Analysis
LECO’s revenue climbed steadily to 4.23B in 2025, boosting net income to 520M, reflecting robust margin expansion. Gross margin holds firm at 36.25%, while net margin improved to 12.3%, signaling solid profitability momentum. Despite a flat EBIT margin, LECO’s disciplined cost control and rising EPS underscore operational strength.
Stanley Black & Decker, Inc. (SWK) Analysis
SWK posted 15.13B in revenue for 2025, slightly down from prior years, with net income at 402M and a slim net margin of 2.66%. Gross margin stands at a respectable 29.86%, but declining revenue and a challenging interest expense profile weigh on overall efficiency. EBIT margin at 5.82% shows moderate improvement, supported by recent EPS growth.
Margin Efficiency vs. Revenue Scale
LECO outshines SWK with superior margin profiles and consistent net income growth, despite operating at a smaller scale. SWK’s larger revenue base is undermined by weaker profitability and persistent margin compression. For investors prioritizing operational efficiency and margin resilience, LECO presents a more compelling earnings trajectory.
Financial Ratios Comparison
These vital ratios act as a diagnostic tool to expose the underlying fiscal health, valuation premiums, and capital efficiency of the companies analyzed:
| Ratios | Lincoln Electric Holdings, Inc. (LECO) | Stanley Black & Decker, Inc. (SWK) |
|---|---|---|
| ROE | 35.1% (2024) | 4.4% (2025) |
| ROIC | 18.1% (2024) | 7.2% (2025) |
| P/E | 22.8 (2024) | 28.0 (2025) |
| P/B | 8.0 (2024) | 1.2 (2025) |
| Current Ratio | 1.87 (2024) | 1.14 (2025) |
| Quick Ratio | 1.25 (2024) | 0.35 (2025) |
| D/E | 0.99 (2024) | 0.65 (2025) |
| Debt-to-Assets | 37.4% (2024) | 27.6% (2025) |
| Interest Coverage | 14.9 (2024) | 2.5 (2025) |
| Asset Turnover | 1.14 (2024) | 0.71 (2025) |
| Fixed Asset Turnover | 6.47 (2024) | 8.26 (2025) |
| Payout ratio | 34.8% (2024) | 124.6% (2025) |
| Dividend yield | 1.53% (2024) | 4.45% (2025) |
| Fiscal Year | 2024 | 2025 |
Efficiency & Valuation Duel: The Vital Signs
Financial ratios act as a company’s DNA, revealing hidden risks and operational strengths beyond surface-level numbers.
Lincoln Electric Holdings, Inc.
Lincoln Electric shows strong net margins at 12.3%, signaling operational efficiency. However, its zero reported ROE and ROIC raise concerns about capital returns. The P/E of 25.51 suggests the stock trades at a premium. A modest 1.25% dividend yield offers steady shareholder returns amidst mixed ratio signals.
Stanley Black & Decker, Inc.
Stanley Black & Decker posts a lower net margin of 2.66%, indicating tighter profitability. Its ROE at 4.44% remains lackluster, and the P/E of 27.99 flags stretched valuation. The 4.45% dividend yield stands out, providing income despite less efficient asset use and weaker interest coverage.
Premium Valuation vs. Operational Safety
Lincoln Electric’s efficiency contrasts with Stanley’s higher dividend but weaker profitability. Lincoln offers better margin quality but uncertain returns, while Stanley balances moderate risk with income. Investors prioritizing operational strength may lean to Lincoln; income-focused profiles may prefer Stanley’s yield despite valuation concerns.
Which one offers the Superior Shareholder Reward?
I see Lincoln Electric Holdings (LECO) delivers a balanced distribution with a 1.25% dividend yield and a sustainable 32% payout ratio, backed by strong free cash flow. Its consistent buybacks amplify total returns. Stanley Black & Decker (SWK) offers a higher 4.45% yield but an unsustainable 125% payout ratio, signaling dividend risk. SWK’s buybacks are steady but overshadowed by financial leverage and weaker margins. Historically, LECO’s disciplined capital allocation and moderate payouts offer more reliable, long-term shareholder value in 2026. I favor LECO for superior total return sustainability.
Comparative Score Analysis: The Strategic Profile
The radar chart reveals the core DNA and strategic trade-offs of Lincoln Electric Holdings, Inc. and Stanley Black & Decker, Inc., highlighting their financial strengths and vulnerabilities:
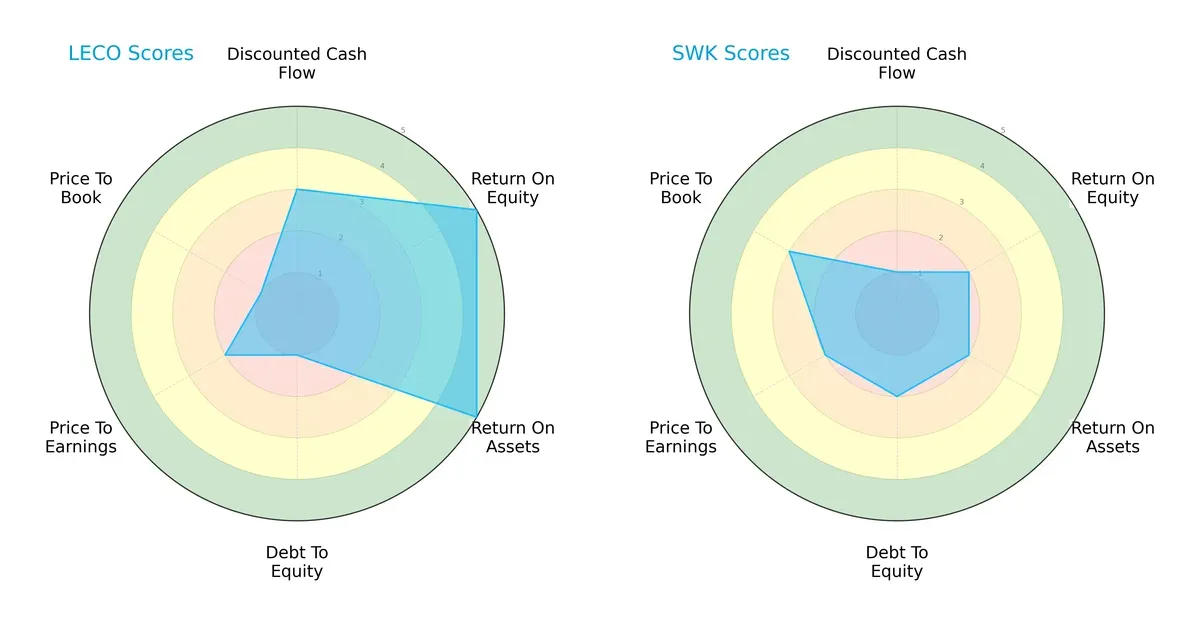
Lincoln Electric demonstrates superior operational efficiency with very favorable ROE and ROA scores (5 each), while Stanley Black & Decker lags with weaker returns (ROE 2, ROA 2). Lincoln Electric’s profile is less balanced due to its very unfavorable debt-to-equity (1) and valuation scores (P/E 2, P/B 1), signaling elevated financial risk and potential overvaluation. Stanley Black & Decker shows moderate balance but underperforms across DCF and profitability metrics, relying less on operational excellence and more on cautious leverage (debt-to-equity 2). Overall, Lincoln Electric leverages its operational edge but carries higher financial risk.
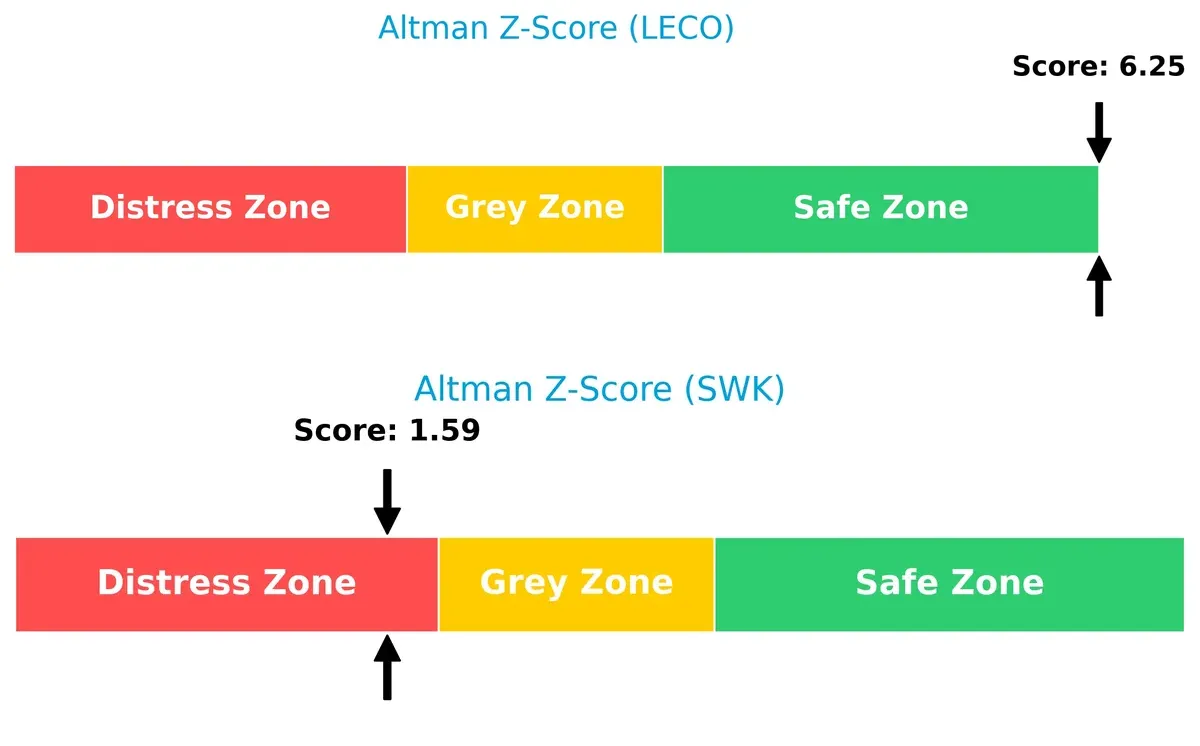
Bankruptcy Risk: Solvency Showdown
Lincoln Electric’s Altman Z-Score of 6.25 places it securely in the safe zone, indicating strong long-term solvency and a low bankruptcy risk. Conversely, Stanley Black & Decker’s 1.59 falls into the distress zone, signaling a high risk of financial distress in this market cycle:
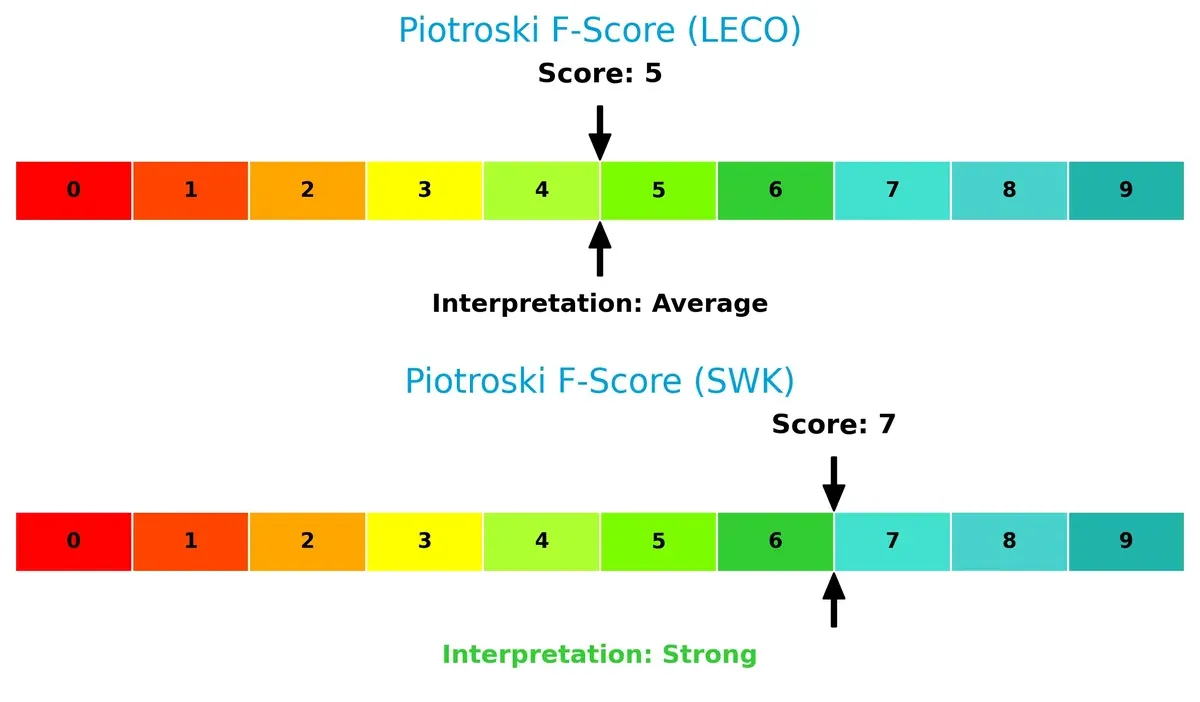
Financial Health: Quality of Operations
Stanley Black & Decker scores a robust 7 on the Piotroski F-Score, reflecting strong financial health and operational quality. Lincoln Electric’s score of 5 is average, suggesting potential red flags in internal metrics compared to its peer:
How are the two companies positioned?
This section dissects the operational DNA of LECO and SWK by analyzing their revenue distribution and internal dynamics. The goal is to confront their economic moats to reveal which model offers the most resilient competitive advantage today.
Revenue Segmentation: The Strategic Mix
This visual comparison dissects how Lincoln Electric Holdings and Stanley Black & Decker diversify their income streams and reveals where their primary sector bets lie:
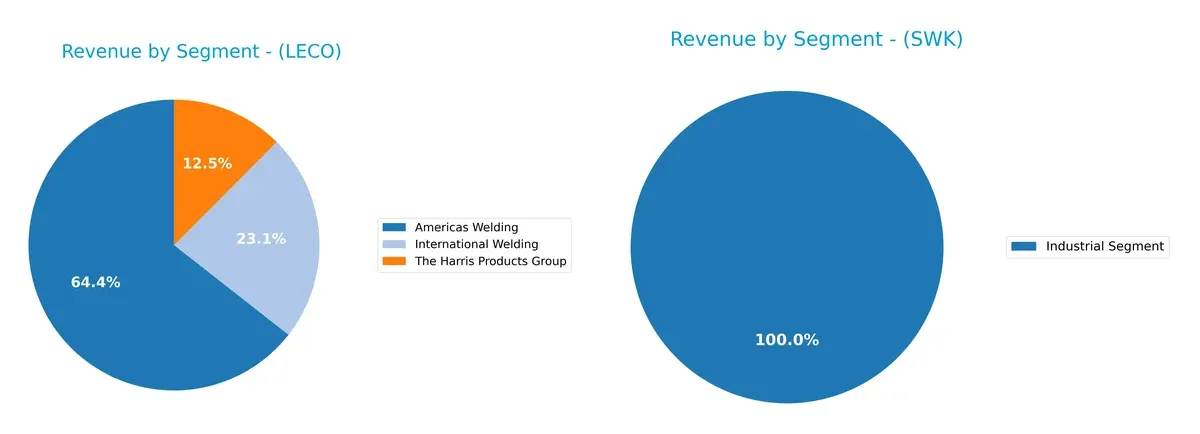
Lincoln Electric leans on welding—Americas Welding alone generates $2.7B, anchoring its revenue with International Welding and Harris Products adding depth. Stanley Black & Decker pivots heavily on Construction and Do It Yourself, exceeding $10B, with Industrial Segment trailing at $2B. Lincoln’s diversified welding focus reduces concentration risk, while Stanley’s dominance in one segment signals dependency on construction cycles but benefits from ecosystem lock-in.
Strengths and Weaknesses Comparison
This table compares the Strengths and Weaknesses of Lincoln Electric Holdings, Inc. (LECO) and Stanley Black & Decker, Inc. (SWK):
LECO Strengths
- Diversified welding segments across Americas and International markets
- Solid net margin at 12.3%
- Favorable debt-to-assets ratio
- Strong market presence in Americas Welding
- Consistent revenue from The Harris Products Group
SWK Strengths
- Broad geographic footprint including US, Europe, Asia, Canada
- Favorable fixed asset turnover at 8.26
- Higher dividend yield at 4.45%
- Favorable price-to-book at 1.24
- Moderate debt-to-assets at 27.6%
- Significant revenue in Construction and DIY segment
LECO Weaknesses
- Unfavorable ROE and ROIC at 0%
- Poor liquidity ratios with current and quick ratios at 0
- Unavailable WACC data
- High PE ratio at 25.51 marked unfavorable
- Low asset and fixed asset turnover
- Weak interest coverage at 0
SWK Weaknesses
- Low net margin at 2.66% and ROE at 4.44%
- Slightly unfavorable interest coverage at 1.89
- Quick ratio unfavorable at 0.35
- PE ratio high at 27.99 unfavorable
- Moderate debt-to-equity at 0.65 neutral
- Neutral current ratio at 1.14, showing limited liquidity
Overall, LECO demonstrates strengths in profitability and debt management but faces significant liquidity and return on capital challenges. SWK benefits from broader geographic diversification and asset efficiency but struggles with profitability and liquidity metrics. These factors shape each company’s strategic priorities and risk profiles.
The Moat Duel: Analyzing Competitive Defensibility
A structural moat alone guards long-term profits from relentless competitive pressures in manufacturing tools and accessories:
Lincoln Electric Holdings, Inc. (LECO): Intangible Assets and Product Innovation
Lincoln’s moat stems from deep intangible assets and specialized welding technology. Its 12.3% net margin and 5.6% recent revenue growth reflect stable pricing power. New automation and robotics could deepen its moat by expanding high-value segments in 2026.
Stanley Black & Decker, Inc. (SWK): Brand Strength and Scale
Stanley Black & Decker leverages brand recognition and global scale, contrasting Lincoln’s tech focus. However, declining revenue (-1.5% last year) and a weak margin profile signal erosion. Expansion in industrial fastening and pipeline services may offer limited moat restoration.
Innovation Depth vs. Brand Scale: Which Moat Holds Stronger?
Lincoln Electric’s technology-driven moat offers deeper competitive defensibility, supported by margin stability and growth. Stanley’s brand and scale face profitability headwinds, leaving it less equipped to defend market share in 2026.
Which stock offers better returns?
Over the past year, Lincoln Electric Holdings, Inc. surged 13.8% with accelerating gains, while Stanley Black & Decker, Inc. declined 3.8%, despite recent positive momentum.
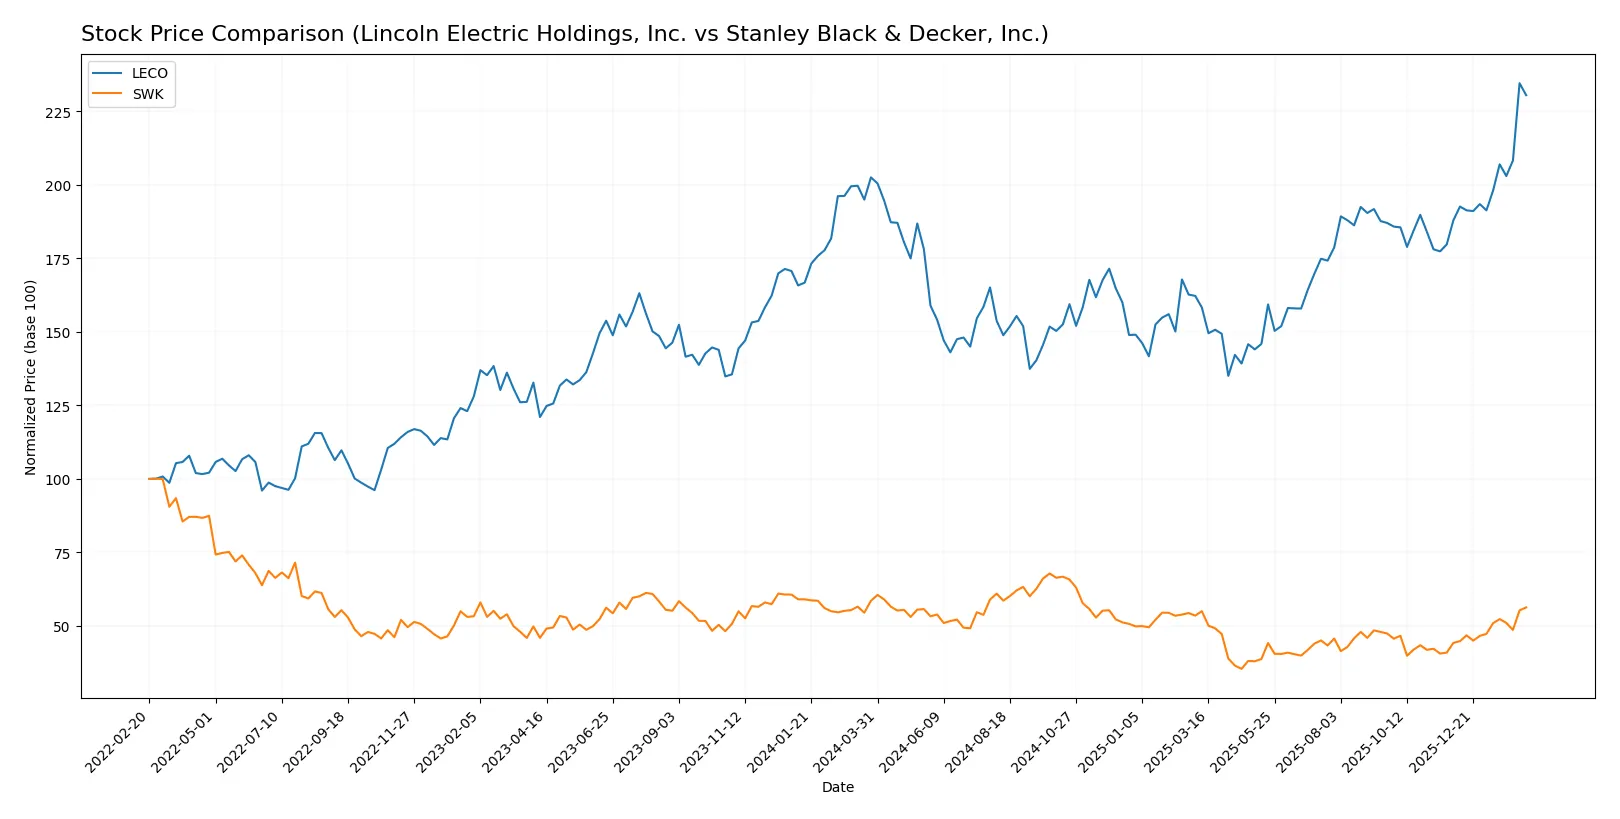
Trend Comparison
Lincoln Electric Holdings, Inc. shows a bullish 13.8% increase over 12 months with accelerating price gains and a wide trading range between 172 and 299. Volatility is high, with a standard deviation of 26.7%.
Stanley Black & Decker, Inc. exhibits a bearish 3.8% decline over the same period but recent months show a 27.3% rebound. Volatility is moderate at 12.3%, with accelerating trend slope.
Lincoln Electric delivered stronger annual returns, outperforming Stanley Black & Decker despite the latter’s recent recovery in price.
Target Prices
Analysts present a cautiously optimistic consensus for Lincoln Electric Holdings, Inc. and Stanley Black & Decker, Inc.
| Company | Target Low | Target High | Consensus |
|---|---|---|---|
| Lincoln Electric Holdings, Inc. | 208 | 340 | 297.5 |
| Stanley Black & Decker, Inc. | 82 | 100 | 89 |
The consensus targets for LECO imply a modest upside from its current price of 294, reflecting confidence in its industrial tools segment. SWK’s target consensus of 89 sits slightly below its current price of 91, suggesting a more cautious outlook within the sector.

Don’t Let Luck Decide Your Entry Point
Optimize your entry points with our advanced ProRealTime indicators. You’ll get efficient buy signals with precise price targets for maximum performance. Start outperforming now!
How do institutions grade them?
Here is a summary of recent institutional grades for Lincoln Electric Holdings, Inc. and Stanley Black & Decker, Inc.:
Lincoln Electric Holdings, Inc. Grades
The table below shows Lincoln Electric’s latest grades from major financial institutions.
| Grading Company | Action | New Grade | Date |
|---|---|---|---|
| Keybanc | Maintain | Overweight | 2026-02-13 |
| Barclays | Maintain | Overweight | 2026-02-13 |
| Stifel | Maintain | Hold | 2026-02-13 |
| Roth Capital | Maintain | Buy | 2026-02-03 |
| Stifel | Maintain | Hold | 2026-01-23 |
| Barclays | Maintain | Overweight | 2026-01-23 |
| Morgan Stanley | Maintain | Underweight | 2026-01-12 |
| Stifel | Maintain | Hold | 2025-12-16 |
| Stifel | Maintain | Hold | 2025-10-31 |
| Barclays | Maintain | Overweight | 2025-10-20 |
Stanley Black & Decker, Inc. Grades
Below is a summary of Stanley Black & Decker’s recent institutional ratings.
| Grading Company | Action | New Grade | Date |
|---|---|---|---|
| Citigroup | Maintain | Buy | 2026-02-06 |
| Wells Fargo | Maintain | Equal Weight | 2026-01-14 |
| UBS | Maintain | Buy | 2026-01-05 |
| Baird | Maintain | Neutral | 2025-12-23 |
| UBS | Maintain | Buy | 2025-11-06 |
| Wells Fargo | Maintain | Equal Weight | 2025-11-05 |
| Wells Fargo | Maintain | Equal Weight | 2025-10-06 |
| Barclays | Maintain | Overweight | 2025-07-30 |
| Wells Fargo | Maintain | Equal Weight | 2025-07-30 |
| Baird | Maintain | Neutral | 2025-07-22 |
Which company has the best grades?
Lincoln Electric has a mix of Overweight and Hold ratings, with one Underweight from Morgan Stanley. Stanley Black & Decker holds more Buy ratings but also several Equal Weight and Neutral grades. Investors might view Stanley Black & Decker’s grades as somewhat more bullish overall.
Risks specific to each company
The following categories identify critical pressure points and systemic threats facing Lincoln Electric Holdings, Inc. and Stanley Black & Decker, Inc. in the 2026 market environment:
1. Market & Competition
Lincoln Electric Holdings, Inc.
- Faces strong competition in welding and fabrication tools with limited diversification.
Stanley Black & Decker, Inc.
- Competes broadly in power tools and industrial markets but benefits from larger scale and brand portfolio.
2. Capital Structure & Debt
Lincoln Electric Holdings, Inc.
- Exhibits favorable debt-to-equity and debt-to-assets ratios but weak interest coverage signals risk.
Stanley Black & Decker, Inc.
- Moderate leverage with neutral debt-to-equity; interest coverage remains low, indicating financial strain.
3. Stock Volatility
Lincoln Electric Holdings, Inc.
- Beta of 1.27 suggests above-market volatility, raising risk during downturns.
Stanley Black & Decker, Inc.
- Slightly lower beta at 1.20 implies marginally less stock price volatility.
4. Regulatory & Legal
Lincoln Electric Holdings, Inc.
- Regulatory risks moderate; primarily manufacturing compliance and environmental standards.
Stanley Black & Decker, Inc.
- Faces broader regulatory scrutiny due to diverse industrial and geographic operations.
5. Supply Chain & Operations
Lincoln Electric Holdings, Inc.
- Supply chain concentrated in Americas; disruptions could impact manufacturing output significantly.
Stanley Black & Decker, Inc.
- Global supply chain exposure with diversified operations, yet vulnerable to international logistics challenges.
6. ESG & Climate Transition
Lincoln Electric Holdings, Inc.
- Limited disclosure on ESG initiatives; climate transition risks remain under-addressed.
Stanley Black & Decker, Inc.
- Increasing ESG focus but still faces pressure to meet evolving sustainability standards.
7. Geopolitical Exposure
Lincoln Electric Holdings, Inc.
- Primarily US and Mexico operations mitigate geopolitical risk but limit growth opportunities.
Stanley Black & Decker, Inc.
- Significant international presence exposes the company to geopolitical tensions and trade policy risks.
Which company shows a better risk-adjusted profile?
Lincoln Electric’s most impactful risk is its poor liquidity and weak interest coverage, which threaten financial flexibility. Stanley Black & Decker struggles with high operational complexity and distress-level Altman Z-score, despite strong Piotroski fundamentals. Lincoln Electric’s higher Altman Z-score and moderate Piotroski score indicate a safer financial position overall. However, Stanley’s broader global exposure and operational scale present both risk and opportunity. Recent data confirm Lincoln Electric’s superior bankruptcy safety margin, justifying greater confidence in its risk-adjusted profile.
Final Verdict: Which stock to choose?
Lincoln Electric Holdings excels as a cash-generating powerhouse with notably strong income growth and operational efficiency. Its main point of vigilance lies in a weakening return on invested capital trend, signaling caution on long-term value creation. It suits portfolios aiming for aggressive growth with an appetite for cyclical swings.
Stanley Black & Decker maintains a strategic moat through its diversified product portfolio and resilient recurring revenue streams. While its profitability metrics lag behind Lincoln Electric, it offers a relatively safer profile amid financial headwinds. This stock aligns with investors seeking GARP—growth at a reasonable price—with moderate risk tolerance.
If you prioritize robust growth fueled by operational excellence, Lincoln Electric outshines due to superior income momentum and cash flow strength. However, if you seek better stability and a defensive stance within industrials, Stanley Black & Decker offers a more cautious play despite its value challenges. Both present distinct analytical scenarios for different investor profiles.
Disclaimer: Investment carries a risk of loss of initial capital. The past performance is not a reliable indicator of future results. Be sure to understand risks before making an investment decision.
Go Further
I encourage you to read the complete analyses of Lincoln Electric Holdings, Inc. and Stanley Black & Decker, Inc. to enhance your investment decisions: