Home > Comparison > Industrials > SNA vs LECO
The strategic rivalry between Snap-on Incorporated and Lincoln Electric Holdings defines the current trajectory of the industrial tools sector. Snap-on operates as a diversified manufacturer offering diagnostic and repair systems, while Lincoln Electric focuses on welding and cutting solutions with strong global reach. This head-to-head pits Snap-on’s integrated systems approach against Lincoln’s specialized manufacturing expertise. This analysis will identify which model provides the superior risk-adjusted return for a balanced portfolio.
Table of contents
Companies Overview
Snap-on Incorporated and Lincoln Electric Holdings, Inc. both command significant influence in the global tools and accessories manufacturing landscape.
Snap-on Incorporated: Premier Professional Tools Provider
Snap-on dominates the professional tools and diagnostic equipment market. Its core revenue derives from hand and power tools, diagnostic systems, and repair information services. In 2026, Snap-on focuses strategically on expanding integrated diagnostic software and service offerings, reinforcing its competitive advantage in comprehensive solutions for industrial and vehicle repair sectors.
Lincoln Electric Holdings, Inc.: Welding and Cutting Innovator
Lincoln Electric leads in welding, cutting, and brazing products, supplying both consumables and advanced automation systems. Its revenue engine centers on welding equipment sales and related consumables across global markets. The 2026 strategy emphasizes innovation in robotic welding packages and enhanced automation, highlighting its market position in industrial fabrication and energy sectors.
Strategic Collision: Similarities & Divergences
Both companies operate within tools and accessories but pursue distinct business philosophies: Snap-on integrates diagnostics and repair systems, while Lincoln Electric prioritizes welding automation and consumables. Their battle for market share unfolds primarily in industrial manufacturing and repair services. Snap-on’s comprehensive service ecosystem contrasts with Lincoln’s focus on welding innovation, creating clearly differentiated investment profiles.
Income Statement Comparison
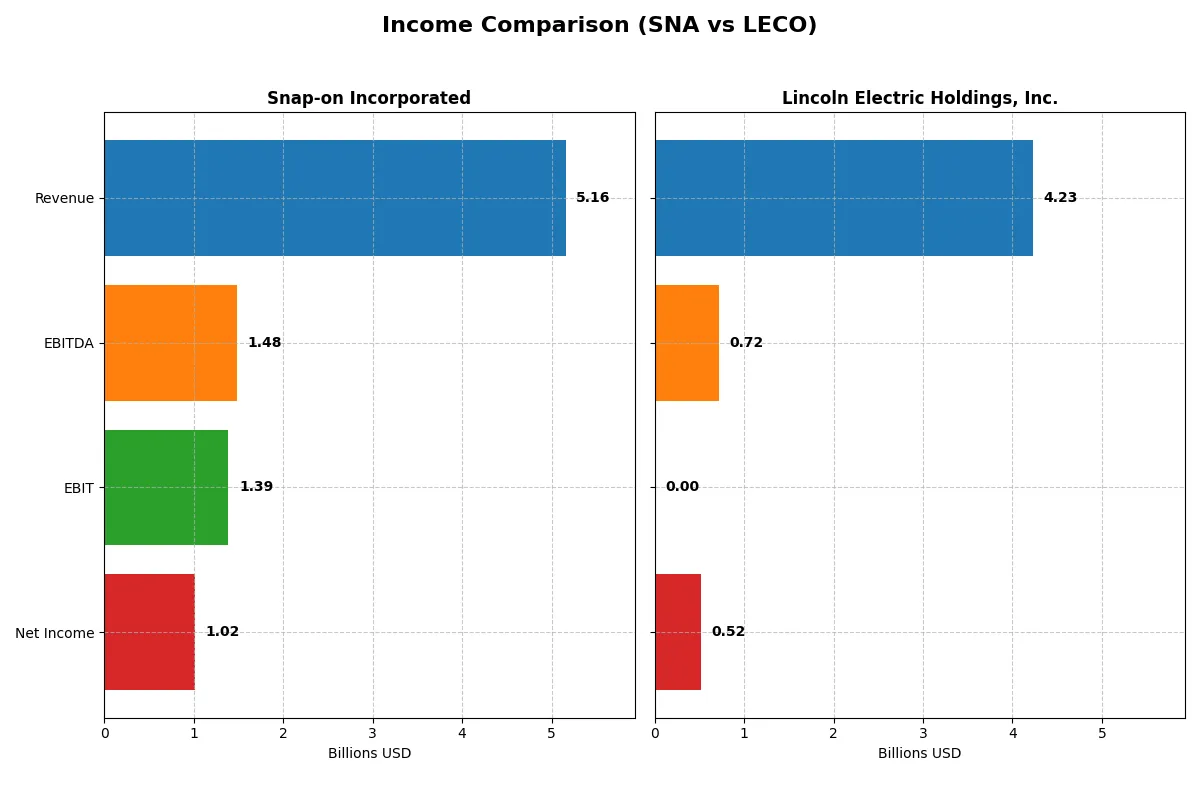
This data dissects the core profitability and scalability of both corporate engines to reveal who dominates the bottom line:
| Metric | Snap-on Incorporated (SNA) | Lincoln Electric Holdings, Inc. (LECO) |
|---|---|---|
| Revenue | 5.16B | 4.23B |
| Cost of Revenue | 2.49B | 2.70B |
| Operating Expenses | 1.34B | 798M |
| Gross Profit | 2.67B | 1.53B |
| EBITDA | 1.48B | 718M |
| EBIT | 1.39B | N/A |
| Interest Expense | 51M | 52M |
| Net Income | 1.02B | 521M |
| EPS | 19.52 | 9.39 |
| Fiscal Year | 2025 | 2025 |
Income Statement Analysis: The Bottom-Line Duel
This income statement comparison uncovers which company delivers stronger operational efficiency and bottom-line results.
Snap-on Incorporated Analysis
Snap-on’s revenue climbed steadily from 4.6B in 2021 to 5.16B in 2025, with net income rising from 820M to 1.02B. The company maintains robust margins, boasting a gross margin around 51.7% and net margin near 19.7% in 2025. Despite slight recent margin compression, Snap-on’s scale and margin strength highlight efficient cost management and solid earnings momentum.
Lincoln Electric Holdings, Inc. Analysis
Lincoln Electric’s revenue grew from 3.23B in 2021 to 4.23B in 2025, with net income surging from 277M to 521M. It operates with a lower gross margin of 36.3% and a net margin of 12.3% in 2025. The firm shows impressive overall growth rates, especially in net income and EPS, but its EBIT margin collapse to zero signals challenges in operating efficiency that investors must watch closely.
Margin Strength vs. Growth Trajectory
Snap-on leads on profitability with superior gross and net margins, reflecting strong operational discipline. Lincoln Electric outpaces in revenue and earnings growth rates but suffers from deteriorating EBIT margins. For investors prioritizing steady profit margins and operational efficiency, Snap-on offers a more attractive profile. Conversely, Lincoln’s high growth profile suits those willing to tolerate margin volatility.
Financial Ratios Comparison
These vital ratios act as a diagnostic tool to expose the underlying fiscal health, valuation premiums, and capital efficiency:
| Ratios | Snap-on Incorporated (SNA) | Lincoln Electric Holdings, Inc. (LECO) |
|---|---|---|
| ROE | 17.14% | 0% |
| ROIC | 13.79% | 0% |
| P/E | 17.98 | 25.51 |
| P/B | 3.08 | 0 |
| Current Ratio | 4.79 | 0 |
| Quick Ratio | 3.68 | 0 |
| D/E (Debt/Equity) | 0.22 | 0 |
| Debt-to-Assets | 15.77% | 0% |
| Interest Coverage | 26.29 | 13.93 |
| Asset Turnover | 0.61 | 0 |
| Fixed Asset Turnover | 8.11 | 0 |
| Payout Ratio | 45.45% | 31.93% |
| Dividend Yield | 2.53% | 1.25% |
| Fiscal Year | 2025 | 2025 |
Efficiency & Valuation Duel: The Vital Signs
Financial ratios serve as a company’s DNA, unveiling its operational strengths and hidden risks for investors’ scrutiny.
Snap-on Incorporated
Snap-on shows strong profitability with a 17.14% ROE and a healthy 19.72% net margin, signaling operational efficiency. Its P/E ratio of 17.98 is fairly valued, though a 3.08 PB ratio suggests some premium on assets. The 2.53% dividend yield rewards shareholders steadily, reflecting balanced capital allocation and disciplined buybacks.
Lincoln Electric Holdings, Inc.
Lincoln Electric reports a decent 12.3% net margin but lacks recent ROE and ROIC data, raising caution on profitability quality. Its P/E ratio of 25.51 appears stretched, indicating valuation risk. Dividend yield at 1.25% is modest, with no clear reinvestment signals, suggesting a less robust shareholder return strategy compared to peers.
Operational Excellence vs. Valuation Stretch
Snap-on delivers a more balanced risk-reward profile with solid profitability and shareholder returns at a reasonable valuation. Lincoln Electric’s stretched valuation and missing profitability metrics imply higher risk. Investors prioritizing stability and efficiency may prefer Snap-on’s proven financial discipline.
Which one offers the Superior Shareholder Reward?
I see Snap-on Incorporated (SNA) delivers a higher dividend yield near 2.5% with a moderate payout ratio around 39-45%, supported by strong free cash flow coverage above 90%. Its buyback program is consistent, enhancing total returns sustainably. Lincoln Electric Holdings (LECO) offers a lower dividend yield near 1.3%, similar payout ratios around 27-44%, but lacks clear buyback data, relying more on reinvestment in growth. Historically, Snap-on’s robust margins and cash flows support a more attractive, durable shareholder reward in 2026. I favor SNA for superior total return potential.
Comparative Score Analysis: The Strategic Profile
The radar chart reveals the fundamental DNA and trade-offs of Snap-on Incorporated and Lincoln Electric Holdings, Inc.:
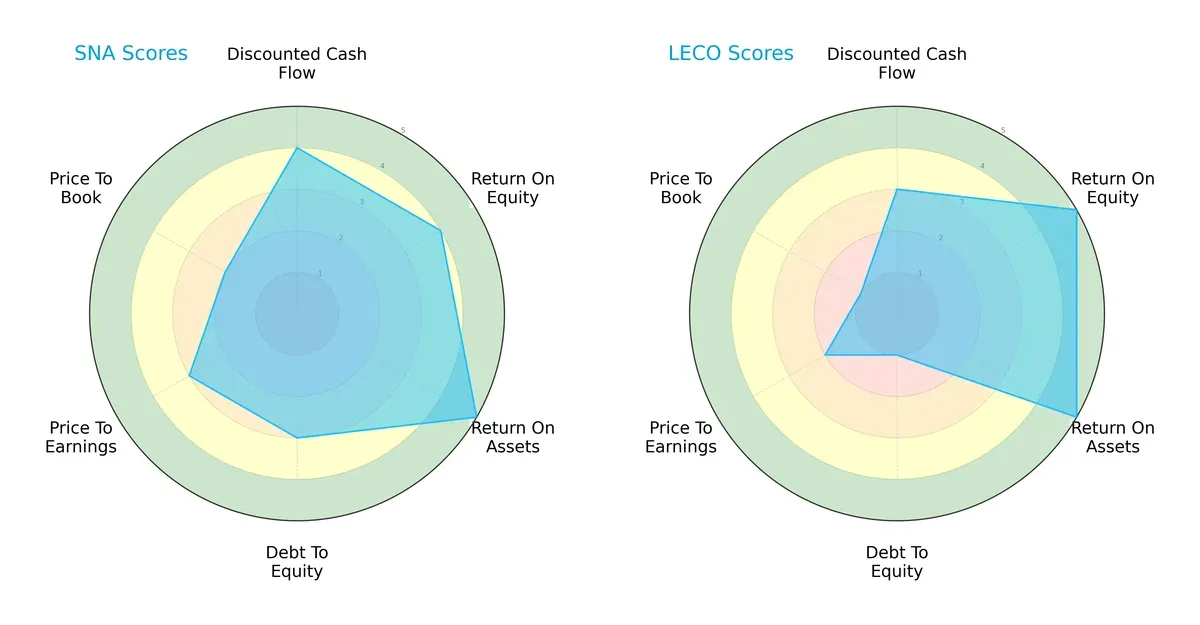
Snap-on shows a balanced profile with strong DCF (4), ROE (4), and ROA (5) scores, and moderate debt (3). Lincoln Electric excels in profitability with top ROE (5) and ROA (5) but reveals financial risk via weak debt-to-equity (1) and valuation scores (P/E 2, P/B 1). Snap-on’s moderate leverage and valuation indicate steadier risk management, while Lincoln Electric relies heavily on operational efficiency for its edge.
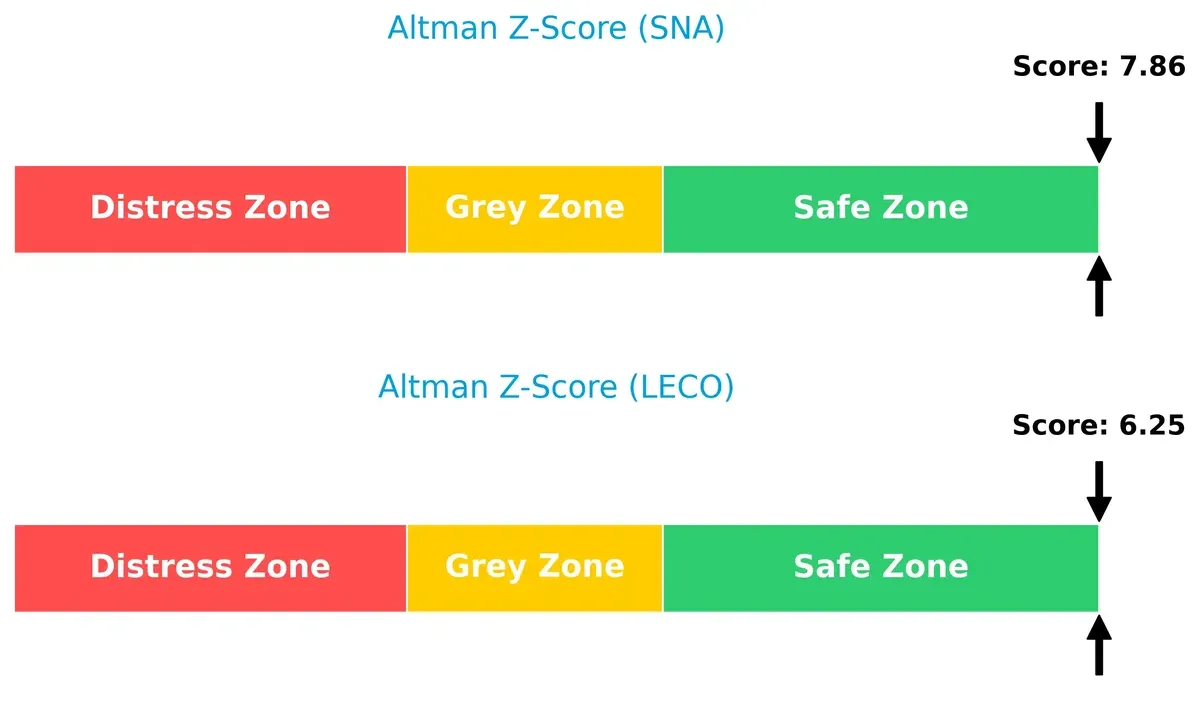
Bankruptcy Risk: Solvency Showdown
Snap-on’s Altman Z-Score of 7.86 surpasses Lincoln Electric’s 6.25, signaling superior long-term solvency and a safer financial buffer in this economic cycle:
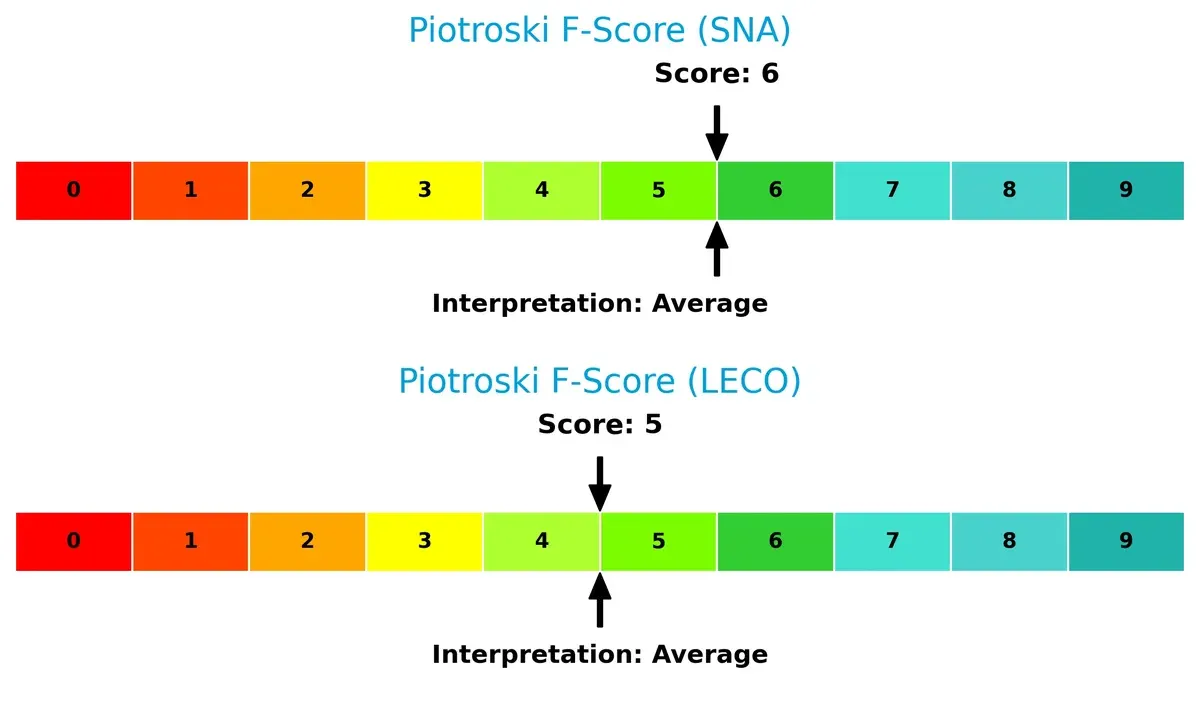
Financial Health: Quality of Operations
Snap-on’s Piotroski F-Score of 6 edges out Lincoln Electric’s 5, indicating marginally stronger operational quality and fewer internal red flags:
How are the two companies positioned?
This section dissects Snap-on and Lincoln Electric’s operational DNA by comparing their revenue distribution and internal dynamics. The goal is to confront their economic moats and identify which model delivers the most resilient, sustainable advantage today.
Revenue Segmentation: The Strategic Mix
This visual comparison dissects how Snap-on Incorporated and Lincoln Electric Holdings diversify their income streams and where their primary sector bets lie:
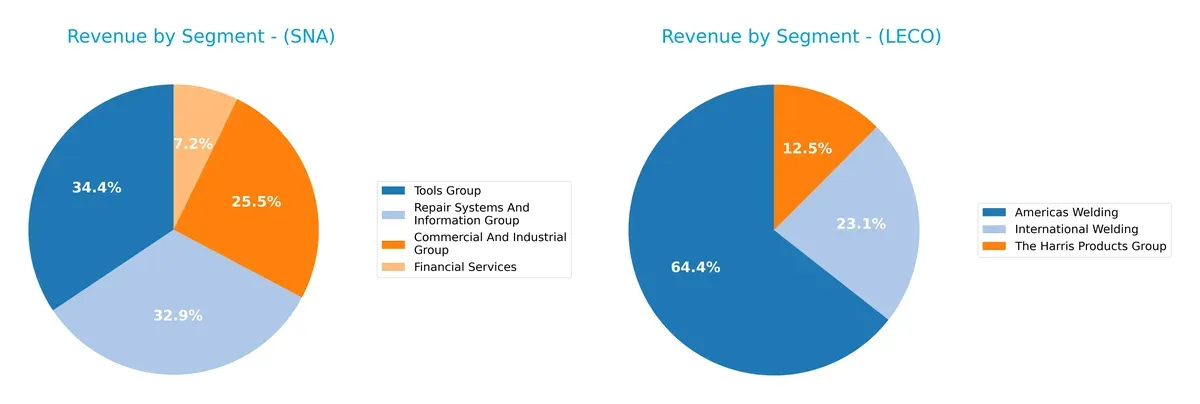
Snap-on anchors revenue in three main segments: Tools Group at $1.96B, Repair Systems at $1.88B, and Commercial & Industrial at $1.46B, with Financial Services contributing $413M. Lincoln Electric pivots on Americas Welding at $2.7B, dwarfs other segments like International Welding at $970M, and Harris Products at $522M. Snap-on exhibits a balanced mix reducing concentration risk. Lincoln Electric’s dominance in Americas Welding signals infrastructure strength but exposes it to regional market cycles.
Strengths and Weaknesses Comparison
This table compares the strengths and weaknesses of Snap-on Incorporated and Lincoln Electric Holdings, Inc.:
SNA Strengths
- Strong profitability with 19.72% net margin and 17.14% ROE
- High ROIC at 13.79% above WACC of 7.05%
- Solid financial leverage with 0.22 debt/equity and 15.77% debt/assets
- Diversified revenue streams across tools, repair, commercial groups and financial services
- Global presence with significant North America and Europe sales
- Favorable interest coverage at 27.45 and consistent dividend yield of 2.53%
LECO Strengths
- Diversified revenue across Americas Welding, International Welding, and Harris Products
- Favorable debt metrics with zero reported debt/equity and debt/assets
- Geographic diversification into United States and other foreign countries
- Positive net margin at 12.3% and favorable P/B ratio
- Established market share in welding and related products
SNA Weaknesses
- Unfavorable high current ratio at 4.79 may indicate inefficient asset use
- Neutral valuations with P/E at 17.98 and P/B at 3.08
- Neutral asset turnover at 0.61 limits operational efficiency insights
LECO Weaknesses
- Zero ROE and ROIC suggest lack of capital profitability
- Unfavorable P/E at 25.51 indicating expensive valuation
- Missing key liquidity ratios: current and quick ratios unavailable or zero
- Unfavorable interest coverage and asset turnover ratios at zero
- Overall unfavorable global financial ratios with 57.14% negative status
Snap-on demonstrates robust profitability and financial health with diversified operations and global reach, though it faces some efficiency concerns. Lincoln Electric shows strengths in diversification and debt management but suffers from weak profitability metrics and incomplete liquidity data, posing challenges for capital allocation and valuation assessment.
The Moat Duel: Analyzing Competitive Defensibility
A structural moat is the sole barrier protecting long-term profits from relentless competition. Here’s how Snap-on and Lincoln Electric stack up:
Snap-on Incorporated: Intangible Assets and Brand Loyalty
Snap-on’s moat stems from strong brand recognition and proprietary diagnostic systems. It delivers high ROIC and stable margins despite recent margin pressure. New product lines in diagnostics could deepen this moat in 2026.
Lincoln Electric Holdings, Inc.: Cost Advantage and Operational Expertise
Lincoln Electric’s moat relies on efficient manufacturing and cost leadership, contrasting Snap-on’s asset-heavy approach. It sustains solid revenue growth but shows a concerning ROIC decline. Expansion in robotics welding may disrupt markets ahead.
Verdict: Brand Loyalty vs. Cost Leadership
Snap-on maintains a wider moat with consistent value creation despite declining ROIC. Lincoln Electric’s cost edge faces sustainability risks given its falling profitability. Snap-on is better equipped to defend market share long term.
Which stock offers better returns?
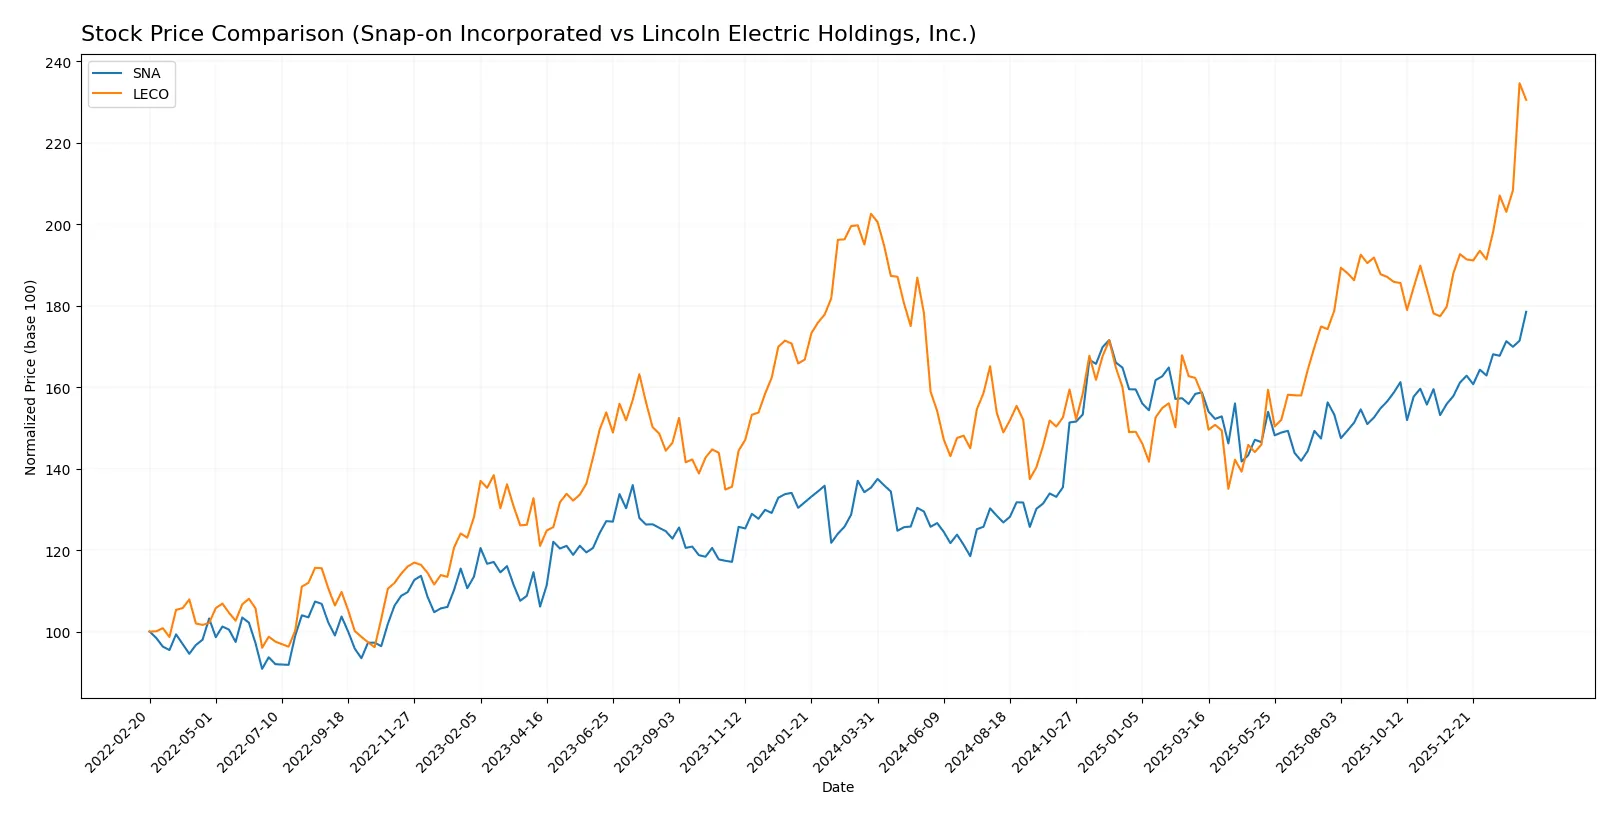
Over the past year, Snap-on Incorporated and Lincoln Electric Holdings, Inc. showed notable bullish price movements with distinct acceleration patterns and shifting trading dynamics.
Trend Comparison
Snap-on Incorporated’s stock rose 31.88% over the past 12 months, showing a strong bullish trend with accelerating price gains and a significant peak at 384.61. Volatility is high with a standard deviation of 31.69.
Lincoln Electric Holdings’ stock gained 13.81% in the same period, also bullish with acceleration. Its highest price reached 298.88, with moderate volatility indicated by a 26.69 standard deviation.
Snap-on’s 31.88% gain surpasses Lincoln Electric’s 13.81%, delivering the stronger market performance over the past year.
Target Prices
Analysts present a cautiously optimistic target price consensus for Snap-on Incorporated and Lincoln Electric Holdings, Inc.
| Company | Target Low | Target High | Consensus |
|---|---|---|---|
| Snap-on Incorporated | 375 | 409 | 396.33 |
| Lincoln Electric Holdings, Inc. | 208 | 340 | 297.5 |
Snap-on’s consensus target of 396.33 slightly exceeds its current price of 384.61, signaling moderate upside potential. Lincoln Electric’s target consensus of 297.5 aligns closely with its current price of 293.68, indicating a balanced risk-reward outlook.

Don’t Let Luck Decide Your Entry Point
Optimize your entry points with our advanced ProRealTime indicators. You’ll get efficient buy signals with precise price targets for maximum performance. Start outperforming now!
How do institutions grade them?
Snap-on Incorporated Grades
This table summarizes recent institutional grades for Snap-on Incorporated.
| Grading Company | Action | New Grade | Date |
|---|---|---|---|
| Roth Capital | Maintain | Buy | 2026-02-10 |
| Tigress Financial | Maintain | Buy | 2025-10-21 |
| Baird | Maintain | Neutral | 2025-10-17 |
| Barrington Research | Maintain | Outperform | 2025-10-15 |
| Barrington Research | Maintain | Outperform | 2025-09-23 |
| Tigress Financial | Maintain | Buy | 2025-08-29 |
| B of A Securities | Maintain | Underperform | 2025-07-18 |
| Baird | Maintain | Neutral | 2025-07-18 |
| Barrington Research | Maintain | Outperform | 2025-07-18 |
| Barrington Research | Maintain | Outperform | 2025-07-17 |
Lincoln Electric Holdings, Inc. Grades
This table lists recent institutional grades assigned to Lincoln Electric Holdings, Inc.
| Grading Company | Action | New Grade | Date |
|---|---|---|---|
| Keybanc | Maintain | Overweight | 2026-02-13 |
| Barclays | Maintain | Overweight | 2026-02-13 |
| Stifel | Maintain | Hold | 2026-02-13 |
| Roth Capital | Maintain | Buy | 2026-02-03 |
| Stifel | Maintain | Hold | 2026-01-23 |
| Barclays | Maintain | Overweight | 2026-01-23 |
| Morgan Stanley | Maintain | Underweight | 2026-01-12 |
| Stifel | Maintain | Hold | 2025-12-16 |
| Stifel | Maintain | Hold | 2025-10-31 |
| Barclays | Maintain | Overweight | 2025-10-20 |
Which company has the best grades?
Snap-on Incorporated has a mix of Buy and Outperform ratings, with some Neutral and Underperform grades. Lincoln Electric holds mostly Overweight and Hold grades, with one Buy and one Underweight rating. Snap-on’s stronger Buy and Outperform presence may attract growth-focused investors, while Lincoln Electric’s consistent Overweight ratings indicate steady confidence.
Risks specific to each company
The following categories identify the critical pressure points and systemic threats facing both firms in the 2026 market environment:
1. Market & Competition
Snap-on Incorporated
- Strong brand in professional tools with broad product range; moderate market beta indicates relative stability.
Lincoln Electric Holdings, Inc.
- Faces higher market volatility with beta above 1.2; competitive welding sector demands constant innovation.
2. Capital Structure & Debt
Snap-on Incorporated
- Low debt-to-equity ratio (0.22) and strong interest coverage (27.45) minimize refinancing risks.
Lincoln Electric Holdings, Inc.
- Limited available data suggests low leverage but interest coverage at zero flags potential financial strain.
3. Stock Volatility
Snap-on Incorporated
- Beta of 0.79 signals lower stock volatility than the market; safer for risk-averse investors.
Lincoln Electric Holdings, Inc.
- Beta of 1.27 exposes stock to above-market swings, adding volatility risk.
4. Regulatory & Legal
Snap-on Incorporated
- Operates globally with exposure to compliance costs but benefits from diversified end markets.
Lincoln Electric Holdings, Inc.
- Welding products face regulatory scrutiny, especially around safety and environmental standards.
5. Supply Chain & Operations
Snap-on Incorporated
- Diverse manufacturing footprint helps mitigate supply disruptions; operational efficiency strong.
Lincoln Electric Holdings, Inc.
- High dependency on raw materials for welding consumables could face pricing and availability pressures.
6. ESG & Climate Transition
Snap-on Incorporated
- Increasing focus on sustainability in manufacturing could raise costs but enhance brand loyalty.
Lincoln Electric Holdings, Inc.
- Energy-intensive processes require adaptation to stricter emissions regulations and greener technologies.
7. Geopolitical Exposure
Snap-on Incorporated
- Global sales expose Snap-on to trade tensions but diversified markets reduce country-specific risk.
Lincoln Electric Holdings, Inc.
- Significant operations in North America and Mexico expose it to NAFTA-related regulatory changes and tariffs.
Which company shows a better risk-adjusted profile?
Snap-on faces its biggest risk in market competition but benefits from a strong balance sheet and low stock volatility. Lincoln Electric’s critical risk is financial vulnerability, with weak coverage ratios and higher stock volatility. Snap-on’s robust Altman Z-Score (7.86) and moderate Piotroski score (6) contrast sharply with Lincoln’s weaker financial metrics and higher market risk. Recent ratio evaluations confirm Snap-on’s superior capital structure and stability, making it the better risk-adjusted choice in today’s environment.
Final Verdict: Which stock to choose?
Snap-on Incorporated’s superpower lies in its robust value creation, consistently generating returns well above its cost of capital. I’ve observed its operational efficiency and strong cash flow as key advantages. However, its elevated current ratio signals a liquidity management point of vigilance. It suits aggressive growth portfolios seeking stable profitability.
Lincoln Electric Holdings commands a strategic moat through its revenue growth and solid margin expansion, supported by a recurring revenue base. While it offers less balance sheet safety compared to Snap-on, its improving operational metrics appeal to investors favoring growth with reasonable risk. It fits well within GARP (Growth at a Reasonable Price) strategies.
If you prioritize consistent value creation and financial resilience, Snap-on outshines with its superior capital efficiency and stable cash flows. However, if your focus is on faster growth potential with an eye on operational improvement, Lincoln Electric offers better momentum albeit with higher balance sheet risks. Each represents a distinct analytical scenario for different investor profiles.
Disclaimer: Investment carries a risk of loss of initial capital. The past performance is not a reliable indicator of future results. Be sure to understand risks before making an investment decision.
Go Further
I encourage you to read the complete analyses of Snap-on Incorporated and Lincoln Electric Holdings, Inc. to enhance your investment decisions: