Lincoln Electric Holdings, Inc. (LECO) and ESAB Corporation (ESAB) are two prominent players in the industrial manufacturing sector, specializing in welding and metal fabrication solutions. Both companies compete in overlapping markets, offering innovative welding equipment and consumables while integrating advanced automation and digital technologies. This comparison will help investors identify which company presents a more compelling opportunity based on industry position, innovation strategies, and growth potential. Let’s explore which stock deserves a place in your portfolio.
Table of contents
Companies Overview
I will begin the comparison between Lincoln Electric Holdings, Inc. and ESAB Corporation by providing an overview of these two companies and their main differences.
Lincoln Electric Holdings, Inc. Overview
Lincoln Electric Holdings, Inc. operates globally in the manufacturing sector, focusing on welding, cutting, and brazing products. Founded in 1895 and based in Cleveland, Ohio, the company serves various industries including automotive, construction, and heavy fabrication. It offers a broad range of products like arc welding power sources, robotic welding packages, and consumables, distributing through direct sales and retail channels.
ESAB Corporation Overview
ESAB Corporation, incorporated in 2021 and headquartered in Wilmington, Delaware, specializes in manufacturing consumables and equipment for welding, cutting, and gas control. The company targets markets such as construction, energy, and medical life sciences, providing products under the ESAB brand. Its offerings include electrodes, automated welding systems, and digital solutions for productivity enhancement, sold via distributors and direct sales.
Key similarities and differences
Both companies operate in the industrial manufacturing sector with a focus on welding products and cater to diverse end markets like construction and energy. Lincoln Electric has a longer history and broader product range including HVAC components, while ESAB emphasizes digital solutions and automation in welding. Lincoln Electric is larger by market capitalization and employee count, reflecting its established global presence compared to ESAB’s more recent market entry.
Income Statement Comparison
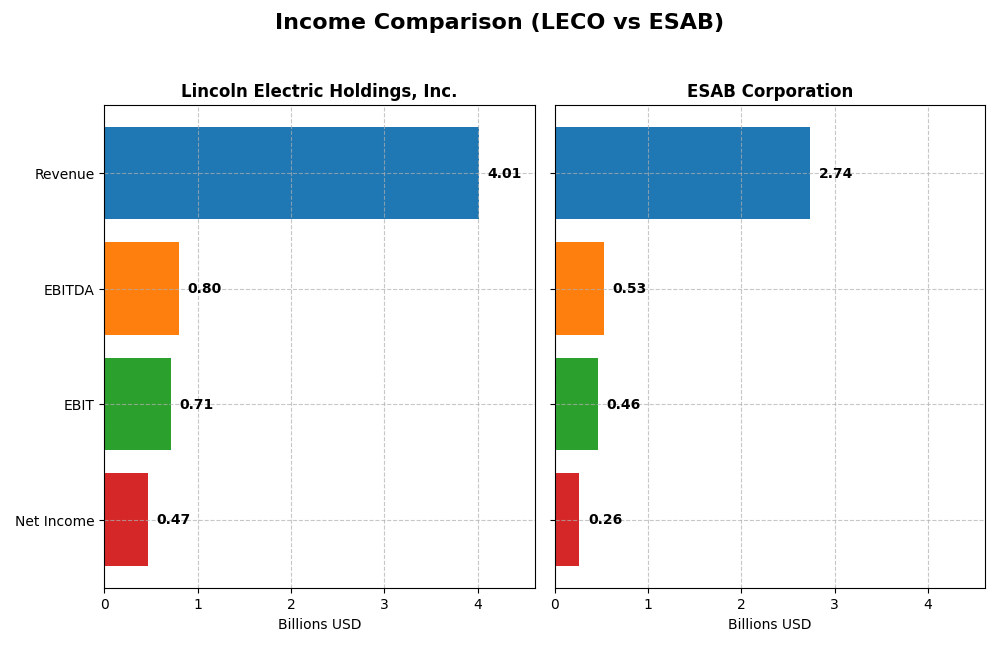
The table below presents a side-by-side comparison of key income statement metrics for Lincoln Electric Holdings, Inc. and ESAB Corporation, based on their most recent fiscal year 2024.
| Metric | Lincoln Electric Holdings, Inc. | ESAB Corporation |
|---|---|---|
| Market Cap | 13.4B | 6.8B |
| Revenue | 4.01B | 2.74B |
| EBITDA | 801M | 531M |
| EBIT | 712M | 465M |
| Net Income | 466M | 265M |
| EPS | 8.23 | 4.36 |
| Fiscal Year | 2024 | 2024 |
Income Statement Interpretations
Lincoln Electric Holdings, Inc.
Lincoln Electric’s revenue grew by roughly 51% from 2020 to 2024, with net income more than doubling over the same period. Margins remained generally stable, with a gross margin near 36.9% and net margin at 11.6% in 2024. However, revenue declined by 4.4% in the latest year, alongside a 10.6% drop in net margin, indicating some recent pressure despite strong long-term growth.
ESAB Corporation
ESAB’s revenue increased about 40.6% between 2020 and 2024, with net income rising 68.3%. The company maintained a solid gross margin of 37.9% and a net margin of 9.7% in 2024. While revenue fell slightly by 1.2% last year, net margin and EPS grew significantly, by 30.6% and 28.3% respectively, reflecting improved profitability despite modest top-line contraction.
Which one has the stronger fundamentals?
Both companies show favorable income statement trends, but ESAB exhibits a higher percentage of favorable income metrics (85.7%) compared to Lincoln Electric (57.1%). Lincoln Electric has stronger long-term revenue and net income growth, but ESAB’s recent margin and EPS improvements suggest more robust short-term fundamentals. Each displays strengths balanced by some near-term challenges.
Financial Ratios Comparison
Below is a comparison of key financial ratios for Lincoln Electric Holdings, Inc. (LECO) and ESAB Corporation (ESAB) for the fiscal year 2024.
| Ratios | Lincoln Electric Holdings, Inc. (LECO) | ESAB Corporation (ESAB) |
|---|---|---|
| ROE | 35.1% | 15.0% |
| ROIC | 18.1% | 10.3% |
| P/E | 22.8 | 27.4 |
| P/B | 8.0 | 4.1 |
| Current Ratio | 1.87 | 1.82 |
| Quick Ratio | 1.25 | 1.18 |
| D/E (Debt-to-Equity) | 0.99 | 0.66 |
| Debt-to-Assets | 37.4% | 28.8% |
| Interest Coverage | 14.9 | 6.90 |
| Asset Turnover | 1.14 | 0.68 |
| Fixed Asset Turnover | 6.47 | 7.06 |
| Payout ratio | 34.8% | 6.4% |
| Dividend yield | 1.53% | 0.23% |
Interpretation of the Ratios
Lincoln Electric Holdings, Inc.
Lincoln Electric shows strong profitability with a net margin of 11.63% and a high return on equity at 35.11%, indicating efficient capital use. Liquidity ratios are favorable, and interest coverage is solid at 16.65, though the price-to-book ratio is unfavorable at 8.0. The company pays a dividend with a 1.53% yield, supported by stable free cash flow, suggesting manageable payout risks.
ESAB Corporation
ESAB presents moderate profitability, with a net margin of 9.66% and a return on equity of 14.97%, reflecting average capital efficiency. Liquidity and interest coverage ratios are favorable, but valuation metrics such as P/E of 27.37 and P/B of 4.1 are less attractive. The dividend yield is low at 0.23%, indicating limited shareholder returns via dividends this year.
Which one has the best ratios?
Lincoln Electric exhibits a more favorable overall ratio profile, with a higher proportion of positive indicators, stronger profitability, and better liquidity compared to ESAB. ESAB’s ratios are somewhat mixed, with several neutral and unfavorable valuations, resulting in a slightly favorable global opinion. Lincoln Electric’s metrics suggest a more robust financial position at this time.
Strategic Positioning
This section compares the strategic positioning of Lincoln Electric Holdings, Inc. and ESAB Corporation across Market position, Key segments, and Exposure to technological disruption:
Lincoln Electric Holdings, Inc.
- Leading manufacturing tools & accessories firm with higher market cap amid industrial competition.
- Diverse segments: Americas Welding, International Welding, Harris Products Group driving revenue.
- Integrates advanced automation and robotic welding solutions within product offerings.
ESAB Corporation
- Mid-sized metal fabrication manufacturer facing moderate competitive pressure.
- Focused on Consumable and Equipment Products in welding and cutting markets.
- Offers digital software and remote monitoring solutions to enhance productivity.
Lincoln Electric Holdings, Inc. vs ESAB Corporation Positioning
Lincoln Electric has a diversified portfolio spanning multiple welding segments and HVAC components, supporting broad exposure. ESAB concentrates on consumables and equipment with digital tools, reflecting a more focused approach. Each strategy has inherent risks and opportunities based on market breadth and specialization.
Which has the best competitive advantage?
Lincoln Electric demonstrates a very favorable moat with ROIC significantly exceeding WACC and growing profitability, signaling durable competitive advantage. ESAB shows slightly favorable moat with increasing ROIC but remains a value shedder, indicating a less established competitive moat.
Stock Comparison
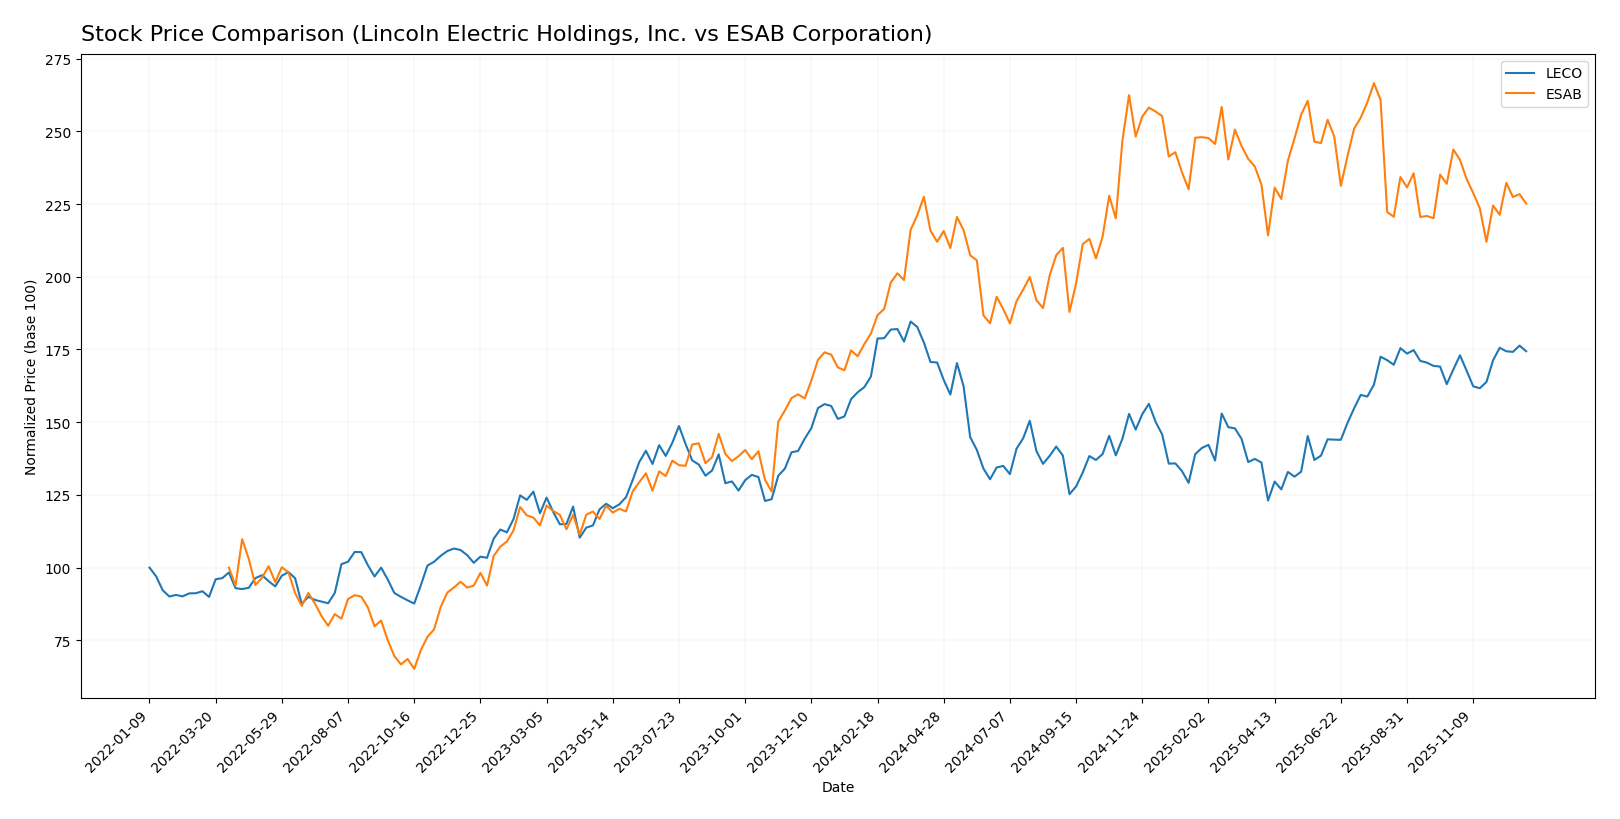
The past year shows distinct price movements for Lincoln Electric Holdings, Inc. (LECO) and ESAB Corporation (ESAB), with LECO experiencing moderate gains and an accelerating bullish trend, while ESAB posted stronger overall growth but recent downward pressure.
Trend Analysis
Lincoln Electric Holdings, Inc. (LECO) recorded a 5.24% price increase over the last 12 months, indicating a bullish trend with acceleration and a high volatility level of 23.76. The stock reached a high of 258.04 and a low of 172.02.
ESAB Corporation (ESAB) showed a 24.75% price increase over the same period, confirming a bullish trend but with a deceleration pattern. Volatility was lower at 11.08. The stock peaked at 133.28 and bottomed at 90.24.
Comparing trends, ESAB delivered the highest market performance with a significantly larger price increase despite recent short-term weakness, whereas LECO’s growth was more moderate but accelerating.
Target Prices
The consensus target prices for Lincoln Electric Holdings, Inc. and ESAB Corporation reflect moderate upside potential based on analyst estimates.
| Company | Target High | Target Low | Consensus |
|---|---|---|---|
| Lincoln Electric Holdings, Inc. | 285 | 252 | 265.67 |
| ESAB Corporation | 150 | 140 | 145.5 |
Analysts expect Lincoln Electric’s stock to rise roughly 9% above the current price of $243.76, while ESAB’s consensus target suggests a potential 29% increase from its $112.57 market price.
Analyst Opinions Comparison
This section compares analysts’ ratings and grades for Lincoln Electric Holdings, Inc. (LECO) and ESAB Corporation (ESAB):
Rating Comparison
LECO Rating
- Rating: B, assessed as Very Favorable overall financial standing.
- Discounted Cash Flow Score: 3, indicating a moderate valuation based on DCF.
- ROE Score: 5, very favorable measure of profit generation from equity.
- ROA Score: 5, very favorable for asset utilization in earnings generation.
- Debt To Equity Score: 1, very unfavorable due to higher financial risk.
- Overall Score: 3, moderate overall financial performance.
ESAB Rating
- Rating: B-, also evaluated as Very Favorable overall financial standing.
- Discounted Cash Flow Score: 3, also moderate valuation based on DCF.
- ROE Score: 3, moderate efficiency in generating profit from equity.
- ROA Score: 3, moderate effectiveness in using assets for earnings.
- Debt To Equity Score: 2, moderate financial risk with better balance sheet.
- Overall Score: 3, moderate overall financial performance.
Which one is the best rated?
Based on the data, LECO and ESAB have the same overall score of 3 and similar discounted cash flow scores. LECO outperforms ESAB in ROE and ROA scores but has a less favorable debt to equity score. Overall, LECO shows stronger profitability metrics while ESAB demonstrates better financial stability.
Scores Comparison
Here is a comparison of the financial health scores for Lincoln Electric Holdings, Inc. and ESAB Corporation:
LECO Scores
- Altman Z-Score: 6.85, indicating a safe zone with very low bankruptcy risk.
- Piotroski Score: 7, reflecting strong financial health and investment quality.
ESAB Scores
- Altman Z-Score: 2.77, placing the company in the grey zone with moderate bankruptcy risk.
- Piotroski Score: 5, showing average financial strength and investment quality.
Which company has the best scores?
Based on the provided data, LECO demonstrates stronger financial health with a higher Altman Z-Score in the safe zone and a stronger Piotroski Score compared to ESAB’s more moderate grey zone Altman Z-Score and average Piotroski Score.
Grades Comparison
Here is the grades comparison of Lincoln Electric Holdings, Inc. and ESAB Corporation from reputable grading companies:
Lincoln Electric Holdings, Inc. Grades
The following table presents recent grades assigned to Lincoln Electric Holdings, Inc. by recognized grading firms.
| Grading Company | Action | New Grade | Date |
|---|---|---|---|
| Stifel | Maintain | Hold | 2025-12-16 |
| Stifel | Maintain | Hold | 2025-10-31 |
| Barclays | Maintain | Overweight | 2025-10-20 |
| Stifel | Maintain | Hold | 2025-08-01 |
| Keybanc | Maintain | Overweight | 2025-08-01 |
| Baird | Maintain | Outperform | 2025-08-01 |
| Stifel | Maintain | Hold | 2025-07-21 |
| Keybanc | Maintain | Overweight | 2025-07-15 |
| Morgan Stanley | Maintain | Underweight | 2025-05-06 |
| Keybanc | Maintain | Overweight | 2025-05-01 |
Overall, Lincoln Electric Holdings, Inc. shows a mixed but generally neutral to moderately positive rating trend with several Hold and Overweight grades.
ESAB Corporation Grades
Below is the summary of recent grades for ESAB Corporation from leading grading companies.
| Grading Company | Action | New Grade | Date |
|---|---|---|---|
| Stifel | Maintain | Buy | 2025-12-16 |
| JP Morgan | Maintain | Overweight | 2025-10-30 |
| UBS | Maintain | Buy | 2025-10-20 |
| JP Morgan | Maintain | Overweight | 2025-10-14 |
| Loop Capital | Upgrade | Buy | 2025-08-22 |
| Stifel | Upgrade | Buy | 2025-08-07 |
| Oppenheimer | Maintain | Outperform | 2025-08-07 |
| JP Morgan | Maintain | Overweight | 2025-08-07 |
| Stifel | Maintain | Hold | 2025-07-21 |
| Evercore ISI Group | Maintain | In Line | 2025-05-19 |
ESAB Corporation demonstrates a predominantly positive rating trend with multiple Buy and Overweight grades and some upgrades.
Which company has the best grades?
ESAB Corporation has received consistently stronger grades, including several Buy ratings and upgrades, compared to Lincoln Electric Holdings, Inc., which shows a mix of Hold and Overweight ratings. This suggests ESAB is viewed more favorably by analysts, which may influence investor sentiment towards greater confidence in its potential performance.
Strengths and Weaknesses
Below is a comparison table highlighting key strengths and weaknesses of Lincoln Electric Holdings, Inc. (LECO) and ESAB Corporation (ESAB) based on recent financial and strategic data.
| Criterion | Lincoln Electric Holdings, Inc. (LECO) | ESAB Corporation (ESAB) |
|---|---|---|
| Diversification | Strong diversification across Americas, International, and Harris Products segments with revenues over 3.3B USD in 2024. | Moderate diversification with Consumable and Equipment segments, total revenue about 2.7B USD in 2024. |
| Profitability | High profitability: ROIC 18.06%, Net Margin 11.63%, ROE 35.11%, indicating efficient capital use and strong returns. | Moderate profitability: ROIC 10.3%, Net Margin 9.66%, ROE 14.97%, improving but less robust than LECO. |
| Innovation | Demonstrates durable competitive advantage with growing ROIC (+45.9%), signaling successful innovation and management. | Growing ROIC (+93.1%) indicates improving innovation and efficiency, but still shedding value overall. |
| Global presence | Solid global footprint with strong Americas and International segments leading revenue. | Global reach focused on equipment and consumables, but less revenue diversification across regions. |
| Market Share | Large market share in welding products, supported by broad product segments and geographic diversity. | Smaller market share relative to LECO, with a focus on consumables and equipment products. |
Key takeaways: Lincoln Electric Holdings shows a very favorable competitive position with strong profitability, diversification, and global presence. ESAB is improving its profitability and innovation but remains less diversified and slightly less profitable, representing a slightly favorable investment profile.
Risk Analysis
Below is a comparative table of key risk metrics for Lincoln Electric Holdings, Inc. (LECO) and ESAB Corporation (ESAB) based on the most recent data from 2024.
| Metric | Lincoln Electric Holdings, Inc. (LECO) | ESAB Corporation (ESAB) |
|---|---|---|
| Market Risk | Beta 1.26 – Moderate market volatility | Beta 1.20 – Moderate market volatility |
| Debt level | Debt/Equity 0.99 – Neutral risk | Debt/Equity 0.66 – Lower risk |
| Regulatory Risk | Moderate – Industry compliance required | Moderate – Industry compliance required |
| Operational Risk | Favorable operational ratios, strong asset turnover | Moderate operational efficiency, lower asset turnover |
| Environmental Risk | Moderate – Industrial manufacturing impact | Moderate – Metal fabrication impact |
| Geopolitical Risk | Exposure due to global operations | Exposure due to global operations |
Lincoln Electric faces moderate market and financial leverage risks but benefits from strong operational performance and financial health, reflected in a high Altman Z-score (6.85) indicating low bankruptcy risk. ESAB, while having lower debt levels, shows a moderate Altman Z-score (2.77), placing it in a grey zone with moderate financial risk. Market volatility and regulatory compliance remain the most impactful risks for both companies.
Which Stock to Choose?
Lincoln Electric Holdings, Inc. (LECO) shows a favorable income evolution with 57% of income statement metrics positive despite a slight recent revenue decline. Its financial ratios are largely favorable, highlighting strong profitability, stable debt levels, and a very favorable global rating. The company’s debt remains moderate with a net debt to EBITDA near 1.17, and it holds a very favorable moat due to a ROIC significantly above WACC and a growing trend.
ESAB Corporation (ESAB) displays a favorable overall income statement evaluation with 86% positive metrics and solid growth in net margin and EPS over the past year. Its financial ratios are slightly favorable, supported by a lower debt-to-assets ratio and decent profitability, though some valuation metrics are less strong. ESAB’s debt is somewhat higher with net debt to EBITDA near 1.72, and it has a slightly favorable moat reflecting value shedding but improving profitability.
From an analytical perspective, LECO might appear more suitable for investors prioritizing quality and economic moat with strong profitability and financial stability. ESAB could be interpreted as appealing for those focused on growth potential and improving profitability despite higher leverage and moderate ratings. The choice may depend on whether an investor values durable competitive advantage or growth momentum.
Disclaimer: Investment carries a risk of loss of initial capital. The past performance is not a reliable indicator of future results. Be sure to understand risks before making an investment decision.
Go Further
I encourage you to read the complete analyses of Lincoln Electric Holdings, Inc. and ESAB Corporation to enhance your investment decisions: