Home > Comparison > Industrials > TT vs LII
The strategic rivalry between Trane Technologies plc and Lennox International Inc. shapes the industrial HVAC and refrigeration sector. Trane dominates with a broad, global footprint and integrated energy solutions, while Lennox excels in specialized residential and commercial HVAC products. This analysis pits Trane’s scale and innovation against Lennox’s focused market approach. I aim to reveal which trajectory offers superior risk-adjusted returns for a diversified industrial portfolio.
Table of contents
Companies Overview
Trane Technologies and Lennox International both play pivotal roles in the global HVAC and refrigeration markets.
Trane Technologies plc: Global HVAC and Refrigeration Leader
Trane Technologies dominates the industrial HVAC and transport refrigeration sector. It generates revenue by designing, manufacturing, and servicing heating, ventilation, air conditioning, and refrigeration solutions worldwide. In 2026, its strategic focus emphasizes expanding energy-efficient products and integrated building management services to enhance sustainability and customer value.
Lennox International Inc.: Residential and Commercial Climate Solutions
Lennox International specializes in residential and commercial heating and cooling systems with a significant refrigeration segment. It drives revenue through product sales and services across HVAC and refrigeration markets in North America and beyond. Its 2026 strategy centers on innovation in variable refrigerant flow technology and expanding aftermarket parts distribution to strengthen market penetration.
Strategic Collision: Similarities & Divergences
Both companies compete intensely in HVAC but differ in scope and approach. Trane Technologies pursues a broad global footprint with a focus on industrial and transport refrigeration, while Lennox targets residential and light commercial markets with a concentrated North American base. Their battleground lies in innovation and service integration. Investors face distinct profiles: Trane offers scale and diversification, Lennox presents niche specialization with steady aftermarket revenue.
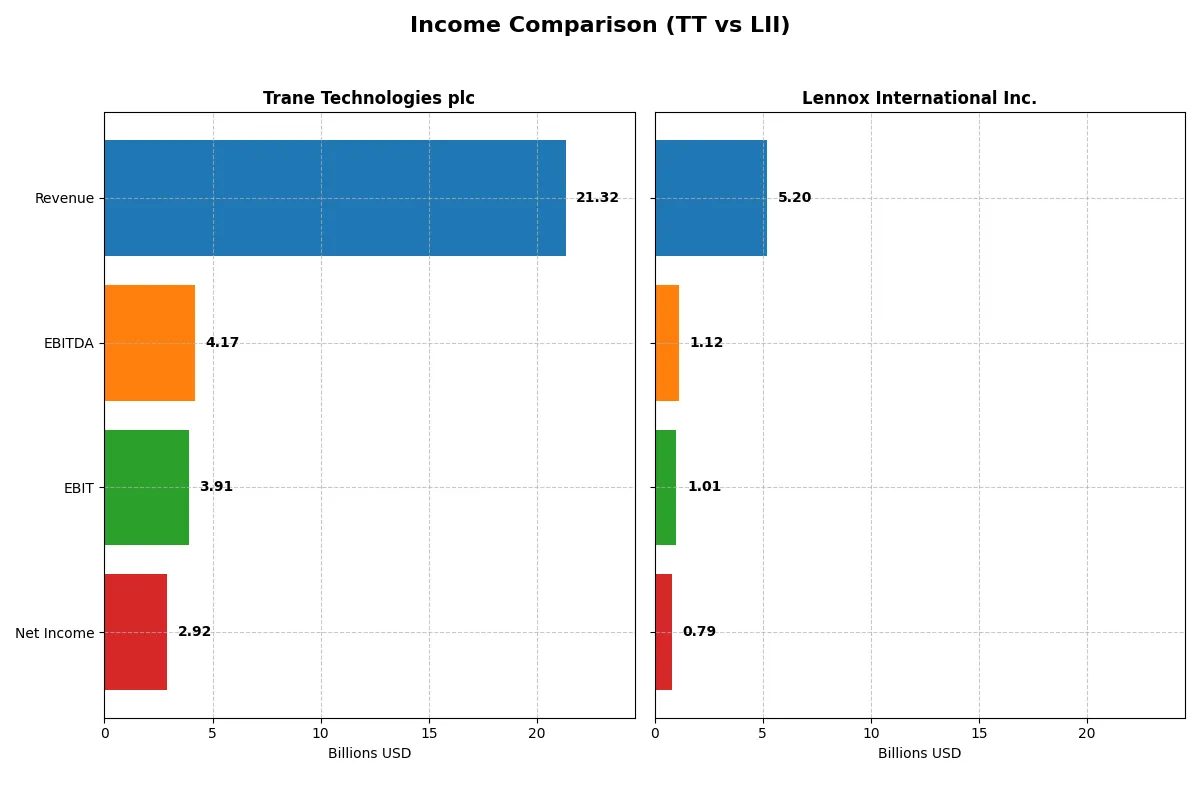
Income Statement Comparison
This data dissects the core profitability and scalability of both corporate engines to reveal who dominates the bottom line:
| Metric | Trane Technologies plc (TT) | Lennox International Inc. (LII) |
|---|---|---|
| Revenue | 21.3B | 5.2B |
| Cost of Revenue | 13.6B | 3.5B |
| Operating Expenses | 3.7B | 700M |
| Gross Profit | 7.7B | 1.7B |
| EBITDA | 4.2B | 1.1B |
| EBIT | 3.9B | 1.0B |
| Interest Expense | 228M | 41M |
| Net Income | 2.9B | 786M |
| EPS | 13.09 | 22.31 |
| Fiscal Year | 2025 | 2025 |
Income Statement Analysis: The Bottom-Line Duel
This income statement comparison reveals which company operates more efficiently and drives superior profitability through its financial performance.
Trane Technologies plc Analysis
Trane Technologies steadily grew revenue from 14.1B in 2021 to 21.3B in 2025, doubling net income to 2.9B. Its gross margin stands strong at 36%, while net margin improved to nearly 14%, reflecting effective cost control. The 2025 results show accelerating EBIT growth (+12%) and EPS growth (+15%), signaling robust momentum.
Lennox International Inc. Analysis
Lennox’s revenue rose 24% over five years, reaching 5.2B in 2025 but declined 2.7% in the last year. Gross margin remains favorable at 33%, with net margin at 15%. However, EBIT and net income slightly contracted recently. Despite these setbacks, EPS growth over the period is strong (+80%), supported by disciplined expense management.
Margin Efficiency vs. Top-Line Expansion
Trane Technologies outpaces Lennox in revenue and net income growth, showcasing superior scale and profitability expansion. Lennox offers higher net margins but faces near-term top-line pressure. For investors, Trane’s profile of broad growth and margin improvement appeals more to those seeking dynamic earnings power, while Lennox suits those valuing margin stability.
Financial Ratios Comparison
These vital ratios act as a diagnostic tool to expose the underlying fiscal health, valuation premiums, and capital efficiency of the companies compared below:
| Ratios | Trane Technologies plc (TT) | Lennox International Inc. (LII) |
|---|---|---|
| ROE | 33.9% | 67.6% |
| ROIC | 20.3% | 25.5% |
| P/E | 29.8 | 21.6 |
| P/B | 10.1 | 14.6 |
| Current Ratio | 1.25 | 1.60 |
| Quick Ratio | 0.92 | 0.63 |
| D/E | 0.54 | 1.77 |
| Debt-to-Assets | 21.5% | 50.6% |
| Interest Coverage | 17.4 | 24.8 |
| Asset Turnover | 1.00 | 1.27 |
| Fixed Asset Turnover | 9.47 | 4.18 |
| Payout Ratio | 28.7% | 22.0% |
| Dividend Yield | 0.96% | 1.02% |
| Fiscal Year | 2025 | 2025 |
Efficiency & Valuation Duel: The Vital Signs
Ratios function as a company’s DNA, unveiling hidden risks and operational strengths that shape investor decisions.
Trane Technologies plc
Trane Technologies posts a robust 33.9% ROE and a solid 13.7% net margin, signaling strong profitability. Its valuation appears stretched, with a high P/E of 29.8 and P/B at 10.1. The modest 0.96% dividend yield suggests limited direct shareholder returns, likely favoring reinvestment for growth and operational efficiency.
Lennox International Inc.
Lennox International outshines with a remarkable 67.6% ROE and a superior 15.1% net margin. Its P/E ratio of 21.6 looks reasonable, though a high P/B of 14.6 raises valuation concerns. With a 1.02% dividend yield, it balances shareholder income with reinvestment, supporting its elevated profitability and asset turnover.
Valuation Stretch vs. Profit Power
Lennox offers stronger profitability and a more balanced valuation than Trane, despite both having slightly favorable ratio profiles. Investors seeking operational excellence with moderate valuation risk may prefer Lennox, while those prioritizing steady reinvestment might lean toward Trane’s approach.
Which one offers the Superior Shareholder Reward?
Trane Technologies (TT) offers a modest 0.96% dividend yield with a sustainable 29% payout ratio and strong free cash flow coverage (88%). Its buybacks are steady but conservative. Lennox International (LII) yields slightly higher at 1.02%, with a lower 22% payout ratio and robust free cash flow supporting generous buybacks. However, LII carries heavier debt and higher financial leverage, increasing risk. I judge Lennox’s aggressive buybacks and lower payout ratio better reward shareholders in 2026, but Trane’s balanced approach offers safer, more sustainable returns. For risk-tolerant investors, LII leads total shareholder return; for conservative profiles, TT stands out.
Comparative Score Analysis: The Strategic Profile
The radar chart reveals the fundamental DNA and trade-offs of Trane Technologies and Lennox International:
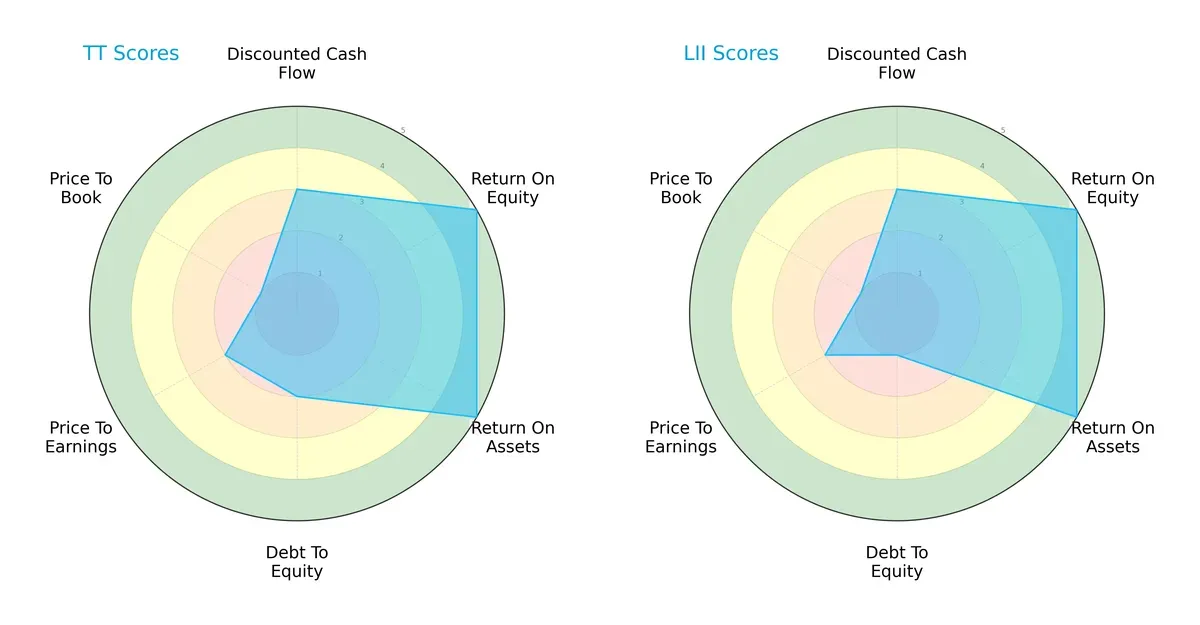
Both firms score identically on overall, DCF, ROE, and ROA metrics, showing strong operational efficiency. Trane holds a moderate debt-to-equity risk (score 2) versus Lennox’s weaker balance sheet (score 1). Both have moderate P/E scores but very unfavorable P/B scores. Trane’s profile is more balanced; Lennox relies on operational excellence despite financial leverage risks.
Bankruptcy Risk: Solvency Showdown
Trane’s Altman Z-Score is 6.11, while Lennox’s is higher at 7.49:
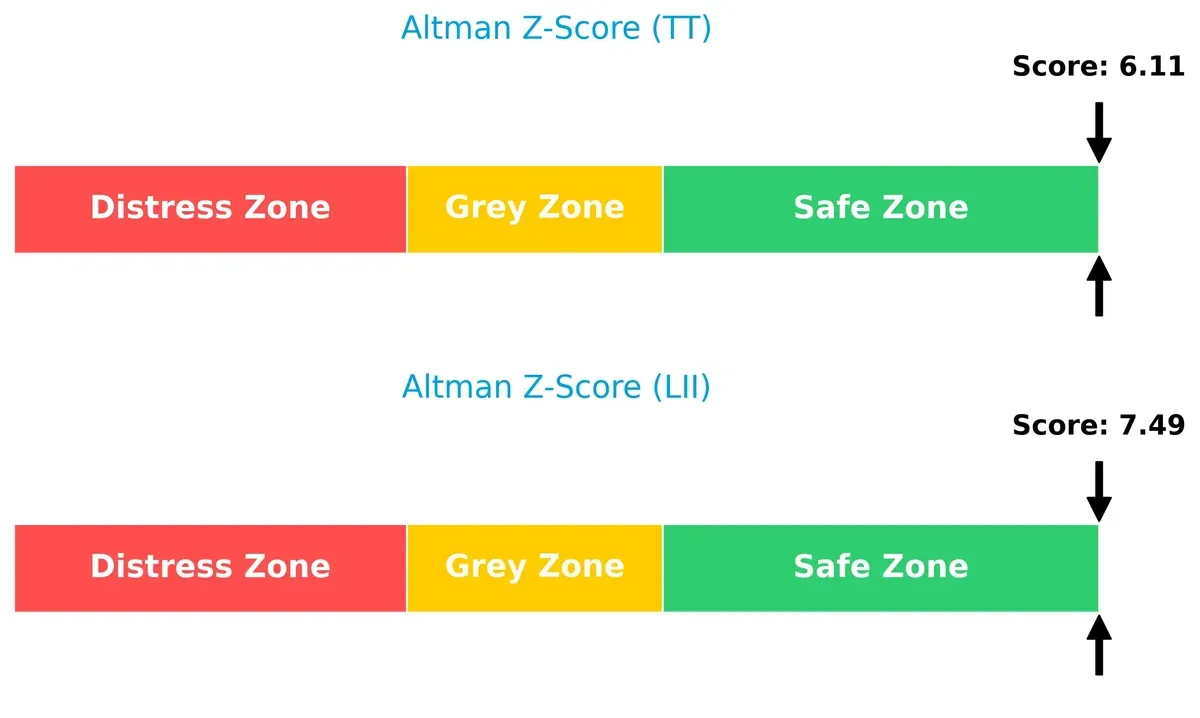
Both companies sit comfortably in the safe zone, signaling strong solvency and low bankruptcy risk amid current economic cycles. Lennox’s higher score reflects a slightly stronger cushion against financial distress.
Financial Health: Quality of Operations
Trane scores 8 on the Piotroski F-Score versus Lennox’s 5:
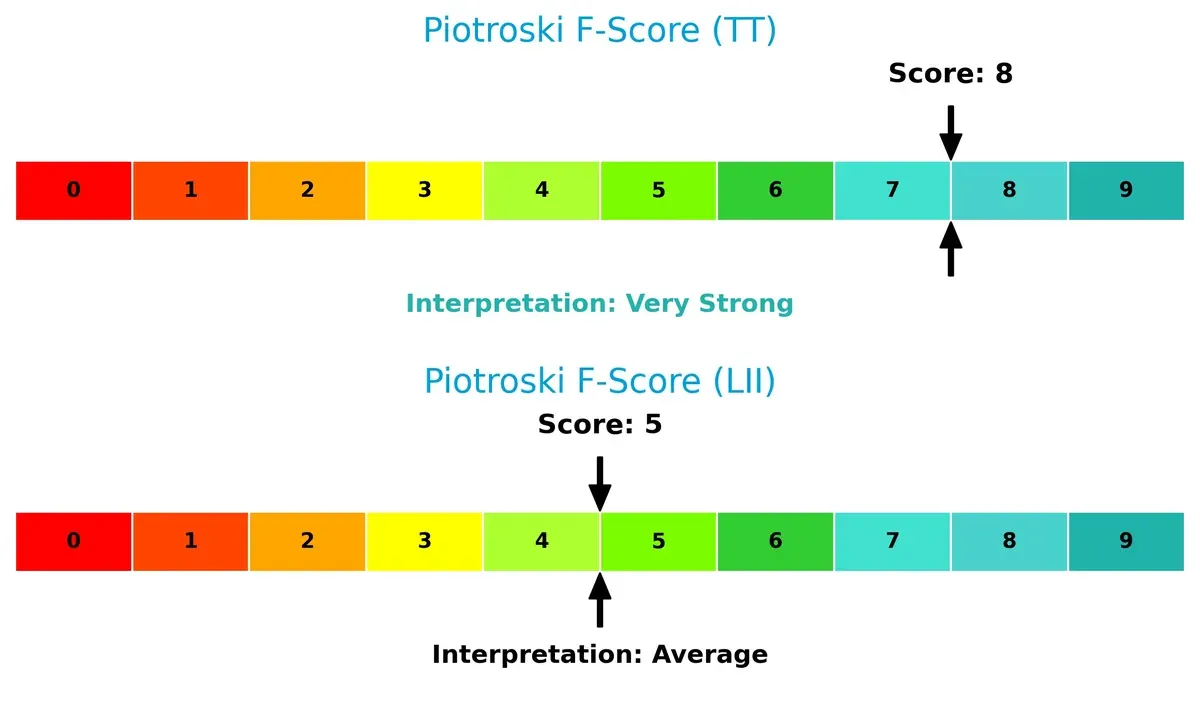
Trane demonstrates very strong financial health with robust profitability, liquidity, and operational efficiency. Lennox’s average score raises caution about internal weaknesses or inconsistent fundamentals relative to Trane’s standout quality.
How are the two companies positioned?
This section dissects the operational DNA of TT and LII by comparing their revenue distribution by segment and internal dynamics. The final objective is to confront their economic moats and identify which model offers the most resilient competitive advantage today.
Revenue Segmentation: The Strategic Mix
This comparison dissects how Trane Technologies plc and Lennox International Inc. diversify income streams and reveals their primary sector bets:
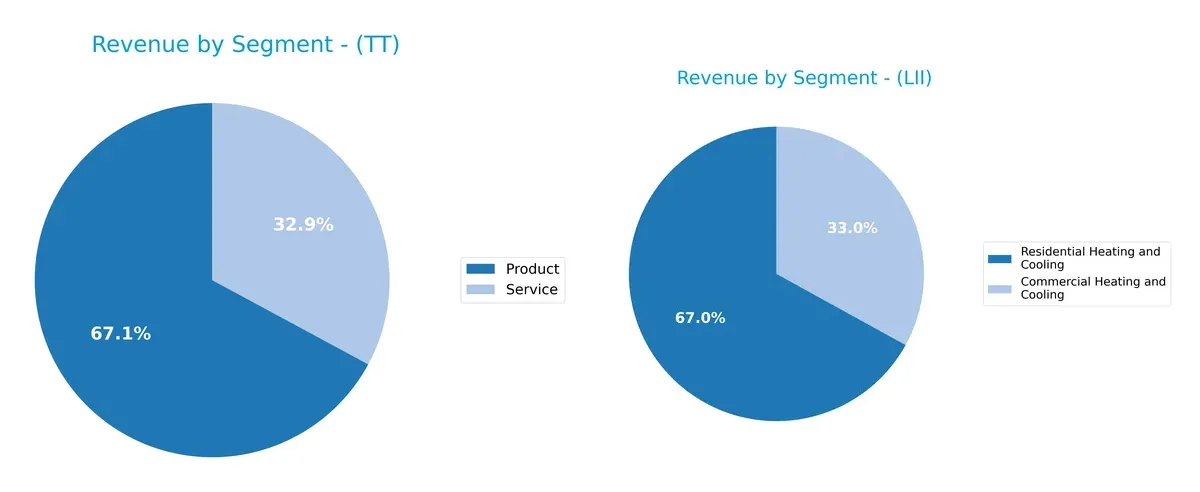
Trane Technologies anchors its revenue in two broad segments: $13.3B from Products and $6.5B from Services, showing a clear product-service balance. Lennox International pivots mostly on Residential Heating and Cooling at $3.6B, with Commercial Heating and Cooling at $1.8B, revealing heavier concentration. Trane’s dual-segment mix reduces concentration risk, while Lennox’s reliance on residential HVAC suggests vulnerability to housing cycles but strong ecosystem lock-in.
Strengths and Weaknesses Comparison
This table compares the Strengths and Weaknesses of Trane Technologies plc (TT) and Lennox International Inc. (LII):
TT Strengths
- Balanced revenue split between products (13.3B) and services (6.5B)
- Favorable net margin (13.7%) and ROIC (20.3%)
- Strong interest coverage (17.2)
- Moderate debt-to-assets ratio (21.6%) indicates prudent leverage
- Global presence with significant Americas (15.9B) and EMEA (2.6B) sales
LII Strengths
- Higher net margin (15.1%) and ROIC (25.5%) reflect strong profitability
- Superior ROE (67.6%) and interest coverage (24.7)
- Asset turnover (1.27) and fixed asset turnover (4.18) indicate efficient asset use
- Favorable current ratio (1.6) supports liquidity
- Clear market focus with strong residential heating and cooling segment (3.6B)
TT Weaknesses
- Elevated P/E (29.8) and P/B (10.1) ratios suggest high valuation risk
- Neutral liquidity ratios (current 1.25, quick 0.92) may limit short-term flexibility
- Dividend yield low (0.96%) compared to peers
- Limited recent innovation data
- Americas market concentration may impact geographic diversification
LII Weaknesses
- High debt-to-equity (1.77) and debt-to-assets (50.6%) ratios signal elevated financial risk
- Quick ratio weak (0.63), indicating liquidity concerns
- Unfavorable P/B (14.6) ratio
- International sales minimal (~250M), limiting global diversification
- Dividend yield neutral at 1.02%
TT demonstrates solid profitability with balanced revenue streams and prudent leverage. LII excels in profitability and asset efficiency but carries higher financial risk and lower geographic diversification. Both companies maintain slightly favorable overall ratios but face valuation and liquidity challenges that investors should monitor closely.
The Moat Duel: Analyzing Competitive Defensibility
A structural moat is the only reliable shield protecting long-term profits from relentless competitive erosion. Let’s dissect the moats of two industry players:
Trane Technologies plc: Innovation-Driven Operational Excellence
Trane’s primary moat stems from its cost advantage powered by advanced HVAC technology and global scale. It sustains a high ROIC of nearly 11% above WACC, reflecting efficient capital use and margin stability. In 2026, expanding its energy-efficient product suite could deepen its moat amid rising environmental regulations.
Lennox International Inc.: Niche Market Specialization
Lennox’s moat relies on strong brand recognition and commercial HVAC specialization, contrasting with Trane’s broader scale. Despite a higher ROIC premium over WACC, its declining ROIC trend signals margin pressure. Growth opportunities hinge on expanding international reach and innovation to reverse profitability decline.
Scale Efficiency vs. Market Focus: The Moat Showdown
Trane boasts a wider and more durable moat with rising profitability and diversified global presence. Lennox creates value but faces margin erosion and a narrower market footprint. Trane is better positioned to defend and grow its market share in 2026.
Which stock offers better returns?
The past year shows distinct price dynamics: Trane Technologies surged strongly but slowed recently, while Lennox International posted moderate gains with accelerating momentum.
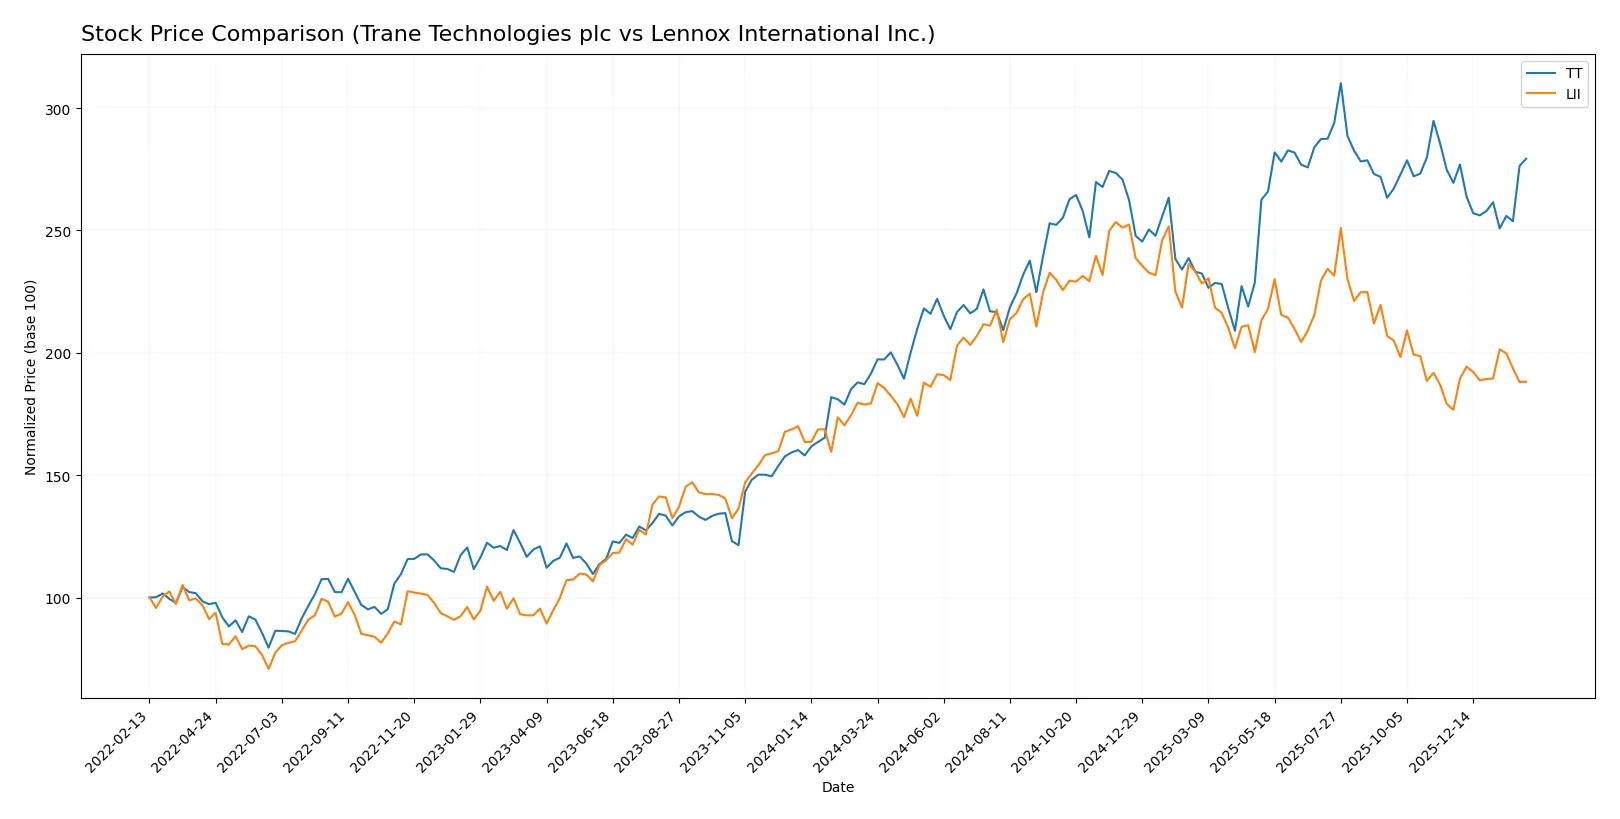
Trend Comparison
Trane Technologies’ stock price rose 45.87% over the last 12 months, marking a bullish trend with decelerating gains. The price ranged between 288.27 and 472.07, showing high volatility (std deviation 43.35).
Lennox International gained 4.92% over the same period, sustaining a bullish trend with accelerating momentum. Prices fluctuated from 457.15 to 667.13, experiencing higher volatility (std deviation 53.46).
Trane Technologies outperformed Lennox International in market returns, with a significantly higher price increase despite slowing recent gains.
Target Prices
Analysts show a bullish target consensus for both Trane Technologies plc and Lennox International Inc.
| Company | Target Low | Target High | Consensus |
|---|---|---|---|
| Trane Technologies plc | 370 | 520 | 475 |
| Lennox International Inc. | 450 | 667 | 555 |
The consensus target for Trane Technologies exceeds its current price of 425, suggesting upside potential. Lennox’s target consensus of 555 also implies significant appreciation from its current 495 level.

Don’t Let Luck Decide Your Entry Point
Optimize your entry points with our advanced ProRealTime indicators. You’ll get efficient buy signals with precise price targets for maximum performance. Start outperforming now!
How do institutions grade them?
Trane Technologies plc Grades
The following table summarizes recent grades assigned to Trane Technologies plc by major institutions.
| Grading Company | Action | New Grade | Date |
|---|---|---|---|
| Oppenheimer | Maintain | Outperform | 2026-01-30 |
| RBC Capital | Maintain | Sector Perform | 2026-01-30 |
| Citigroup | Maintain | Buy | 2026-01-30 |
| JP Morgan | Maintain | Neutral | 2026-01-30 |
| Barclays | Maintain | Overweight | 2026-01-30 |
| Wells Fargo | Maintain | Underweight | 2026-01-30 |
| Oppenheimer | Upgrade | Outperform | 2026-01-20 |
| Morgan Stanley | Maintain | Overweight | 2026-01-13 |
| Barclays | Maintain | Overweight | 2026-01-07 |
| UBS | Maintain | Buy | 2026-01-05 |
Lennox International Inc. Grades
The following table summarizes recent grades assigned to Lennox International Inc. by major institutions.
| Grading Company | Action | New Grade | Date |
|---|---|---|---|
| Wells Fargo | Maintain | Equal Weight | 2026-01-29 |
| RBC Capital | Maintain | Sector Perform | 2026-01-29 |
| JP Morgan | Maintain | Underweight | 2026-01-16 |
| Barclays | Maintain | Overweight | 2026-01-07 |
| Barclays | Maintain | Overweight | 2025-12-11 |
| Wells Fargo | Maintain | Equal Weight | 2025-12-04 |
| Wolfe Research | Upgrade | Peer Perform | 2025-11-13 |
| UBS | Maintain | Neutral | 2025-10-27 |
| Morgan Stanley | Maintain | Underweight | 2025-10-23 |
| RBC Capital | Maintain | Sector Perform | 2025-10-23 |
Which company has the best grades?
Trane Technologies consistently earns higher grades like Outperform, Buy, and Overweight from multiple institutions. Lennox International holds more cautious ratings, including Equal Weight and Underweight. This disparity suggests stronger institutional confidence in Trane Technologies, which may influence investor sentiment accordingly.
Risks specific to each company
The following categories identify the critical pressure points and systemic threats facing both Trane Technologies plc and Lennox International Inc. in the 2026 market environment:
1. Market & Competition
Trane Technologies plc
- Faces intense global competition in HVAC and refrigeration, leveraging strong brands but exposed to pricing pressure.
Lennox International Inc.
- Competes primarily in North America with a focused product range, benefiting from brand loyalty but limited geographic diversification.
2. Capital Structure & Debt
Trane Technologies plc
- Maintains moderate leverage (D/E 0.54) with solid interest coverage (17.17), signaling manageable financial risk.
Lennox International Inc.
- Carries high leverage (D/E 1.77) and elevated debt-to-assets (50.57%), increasing vulnerability to interest rate hikes.
3. Stock Volatility
Trane Technologies plc
- Exhibits a beta of 1.21, indicating moderate sensitivity to market swings.
Lennox International Inc.
- Slightly less volatile with beta of 1.18, reflecting marginally lower market risk.
4. Regulatory & Legal
Trane Technologies plc
- Global operations expose it to diverse regulatory environments, increasing compliance complexity.
Lennox International Inc.
- Primarily US-based, facing concentrated regulatory risks but fewer international legal hurdles.
5. Supply Chain & Operations
Trane Technologies plc
- Global supply chains provide scale but risk disruption from geopolitical tensions and logistics bottlenecks.
Lennox International Inc.
- Smaller scale supply chain focused in North America, potentially more agile but less diversified.
6. ESG & Climate Transition
Trane Technologies plc
- Invests heavily in energy-efficient products and climate solutions, aligning with global ESG trends.
Lennox International Inc.
- Also advancing sustainability efforts but lags slightly in broad-scale climate innovation compared to peers.
7. Geopolitical Exposure
Trane Technologies plc
- Significant international footprint subjects it to trade tensions and currency risks.
Lennox International Inc.
- Limited international exposure reduces geopolitical risk but limits growth opportunities abroad.
Which company shows a better risk-adjusted profile?
Trane Technologies faces substantial geopolitical and regulatory risks but benefits from a stronger balance sheet and superior ESG positioning. Lennox carries heavier debt burdens, elevating financial risk despite a more stable regulatory environment. Trane’s diversified global presence and prudent leverage grant it a superior risk-adjusted profile. The high debt-to-equity ratio at Lennox is particularly concerning amid rising interest rates, while Trane’s robust interest coverage and safe-zone Altman Z-score reinforce its financial resilience.
Final Verdict: Which stock to choose?
Trane Technologies plc (TT) impresses with its powerhouse efficiency in capital allocation, delivering a durable competitive advantage through steadily growing returns on invested capital. Its main point of vigilance lies in valuation metrics, which appear stretched and could pressure future gains. TT suits investors targeting aggressive growth fueled by operational excellence.
Lennox International Inc. (LII) stands out with a strategic moat rooted in superior return on equity and asset utilization, reflecting strong profitability despite a recent dip in ROIC trend. It offers a comparatively safer profile with better liquidity but carries higher financial leverage. LII fits growth-at-a-reasonable-price portfolios seeking strong earnings quality paired with manageable risk.
If you prioritize durable operational excellence and consistent value creation, TT is the compelling choice due to its improving profitability and well-managed capital structure. However, if you seek a balance of high returns with better current liquidity and a somewhat lower valuation premium, LII offers better stability amid cyclical pressures. Both stocks present viable but distinct analytical scenarios aligned with specific investor risk tolerances and growth objectives.
Disclaimer: Investment carries a risk of loss of initial capital. The past performance is not a reliable indicator of future results. Be sure to understand risks before making an investment decision.
Go Further
I encourage you to read the complete analyses of Trane Technologies plc and Lennox International Inc. to enhance your investment decisions: