Home > Comparison > Industrials > LII vs MAS
The strategic rivalry between Lennox International Inc. and Masco Corporation shapes the competitive landscape of the Industrials sector. Lennox focuses on capital-intensive heating, ventilation, and refrigeration solutions, while Masco operates as a diversified manufacturer of home improvement and building products. This analysis contrasts their operational models to identify which company presents the superior risk-adjusted potential for a balanced portfolio amid evolving market dynamics.
Table of contents
Companies Overview
Lennox International and Masco Corporation each command significant influence in the global construction sector.
Lennox International Inc.: HVAC & Refrigeration Specialist
Lennox International dominates the heating, ventilation, air conditioning, and refrigeration markets. Its core revenue derives from residential and commercial HVAC equipment sales plus refrigeration solutions. In 2026, Lennox sharpens its focus on expanding variable refrigerant flow commercial products and integrated service solutions to capture light commercial market share. The company’s diversified segment strategy underpins steady revenue streams.
Masco Corporation: Home Improvement & Building Products Leader
Masco Corporation excels in home improvement and building products, primarily plumbing and decorative architectural offerings. Revenue flows from faucets, valves, paints, and lighting sold globally through wholesalers and retail channels. In 2026, Masco prioritizes brand consolidation and innovation across core product lines like DELTA faucets and BEHR paints. The firm’s broad brand portfolio drives its extensive market reach.
Strategic Collision: Similarities & Divergences
Both firms operate in construction-related sectors but diverge sharply in business philosophy. Lennox focuses on technology-driven HVAC systems with integrated services, forming a closed ecosystem. Masco champions a diversified product portfolio spanning plumbing to decorative hardware, leveraging open distribution channels. Their primary battleground is capturing residential and commercial building projects. Lennox offers a tech-heavy growth profile, while Masco provides diversified exposure with strong brand equity.
Income Statement Comparison
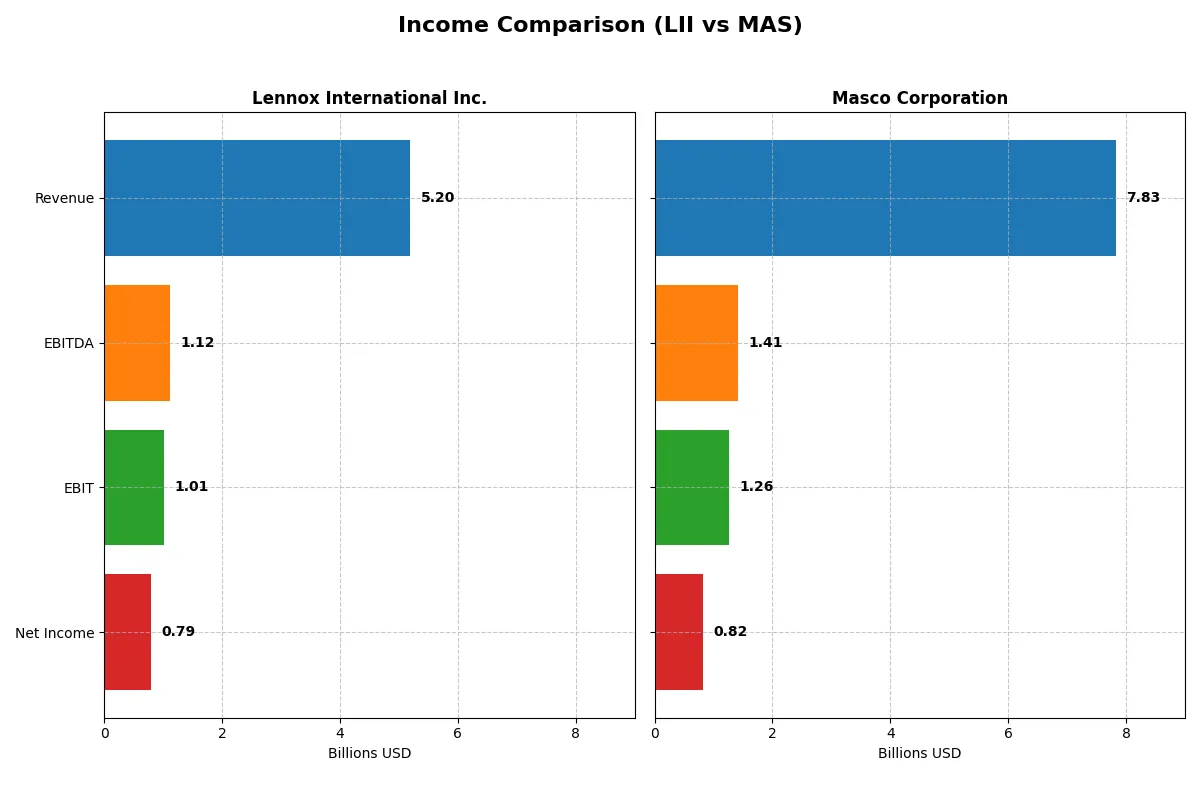
This data dissects the core profitability and scalability of both corporate engines to reveal who dominates the bottom line:
| Metric | Lennox International Inc. (LII) | Masco Corporation (MAS) |
|---|---|---|
| Revenue | 5.20B | 7.83B |
| Cost of Revenue | 3.48B | 4.99B |
| Operating Expenses | 700M | 1.47B |
| Gross Profit | 1.72B | 2.83B |
| EBITDA | 1.12B | 1.41B |
| EBIT | 1.01B | 1.26B |
| Interest Expense | 41M | 99M |
| Net Income | 786M | 822M |
| EPS | 22.31 | 3.77 |
| Fiscal Year | 2025 | 2024 |
Income Statement Analysis: The Bottom-Line Duel
This income statement comparison reveals the true efficiency and profitability of each company’s business model over recent years.
Lennox International Inc. Analysis
Lennox International’s revenue shows a healthy 24% growth from 2021 to 2025, peaking at $5.2B in 2025 despite a slight 2.7% decline from 2024. Net income surged 69% over five years, reaching $786M in 2025. Gross margins hold firm at 33%, while net margins remain robust at 15%, signaling strong operational control and consistent profitability momentum.
Masco Corporation Analysis
Masco’s revenue grew 9% from 2020 to 2024, totaling $7.8B in 2024 but slightly retreating by 1.7% year-over-year. Net income, however, contracted 33% over the period, arriving at $822M in 2024. Gross margins are solid at 36%, yet net margins lag at 10.5%, reflecting pressure on expenses and a declining bottom line, which highlights challenges in sustaining profit efficiency.
Margin Resilience vs. Revenue Scale
Lennox International outperforms Masco in net income growth and margin expansion, despite Masco’s larger revenue base. Lennox’s superior net margin and consistent earnings growth mark it as the fundamentally stronger operator. Investors favor companies that convert sales into profits efficiently; Lennox’s profile exemplifies this strength over Masco’s scale with diminishing returns.
Financial Ratios Comparison
These vital ratios act as a diagnostic tool to expose the underlying fiscal health, valuation premiums, and capital efficiency of the companies compared below:
| Ratios | Lennox International Inc. (LII) | Masco Corporation (MAS) |
|---|---|---|
| ROE | 67.60% | -2.94% |
| ROIC | 25.51% | 29.30% |
| P/E | 21.56 | 19.25 |
| P/B | 14.57 | -56.50 |
| Current Ratio | 1.60 | 1.75 |
| Quick Ratio | 0.63 | 1.15 |
| D/E (Debt to Equity) | 1.77 | -11.48 |
| Debt-to-Assets | 50.57% | 64.07% |
| Interest Coverage | 24.83 | 13.77 |
| Asset Turnover | 1.27 | 1.56 |
| Fixed Asset Turnover | 4.18 | 5.81 |
| Payout ratio | 22.00% | 30.90% |
| Dividend yield | 1.02% | 1.61% |
| Fiscal Year | 2025 | 2024 |
Efficiency & Valuation Duel: The Vital Signs
Financial ratios act as the company’s DNA, uncovering hidden risks and revealing operational strengths that drive shareholder value.
Lennox International Inc.
Lennox International posts a strong 67.6% ROE and 15.13% net margin, signaling robust profitability. Its P/E of 21.56 suggests a fairly valued stock, though a high P/B of 14.57 raises caution. The company delivers modest 1.02% dividend yield, balancing shareholder returns with reinvestment in operational efficiency.
Masco Corporation
Masco shows a favorable 10.5% net margin and a strong 29.3% ROIC, reflecting operational effectiveness. Its P/E of 19.25 signals reasonable valuation, supported by a healthy 1.61% dividend yield. Despite a negative ROE, Masco’s favorable leverage and liquidity ratios indicate solid financial footing for long-term investors.
Balanced Efficiency Meets Valuation Prudence
Masco leads with a more favorable overall ratio profile and stronger free cash flow yield, while Lennox excels in equity returns but carries higher leverage risks. Investors seeking operational safety may prefer Masco’s steadier metrics; those favoring high profitability could lean toward Lennox’s aggressive returns.
Which one offers the Superior Shareholder Reward?
Lennox International (LII) delivers a 1.02% dividend yield with a 22% payout ratio, backed by strong free cash flow coverage (84%). It pairs modest dividends with active buybacks, signaling balanced capital return. Masco (MAS) yields 1.61%, with a higher 31% payout ratio but lower free cash flow coverage (84%). MAS’s buybacks are less intense but consistent. I observe LII’s disciplined payout and buyback combo as more sustainable amid cyclical pressures. For 2026 investors, LII offers a superior total return profile grounded in prudent capital allocation and resilience.
Comparative Score Analysis: The Strategic Profile
The radar chart reveals the fundamental DNA and trade-offs of Lennox International Inc. and Masco Corporation, highlighting their core financial strengths and vulnerabilities:
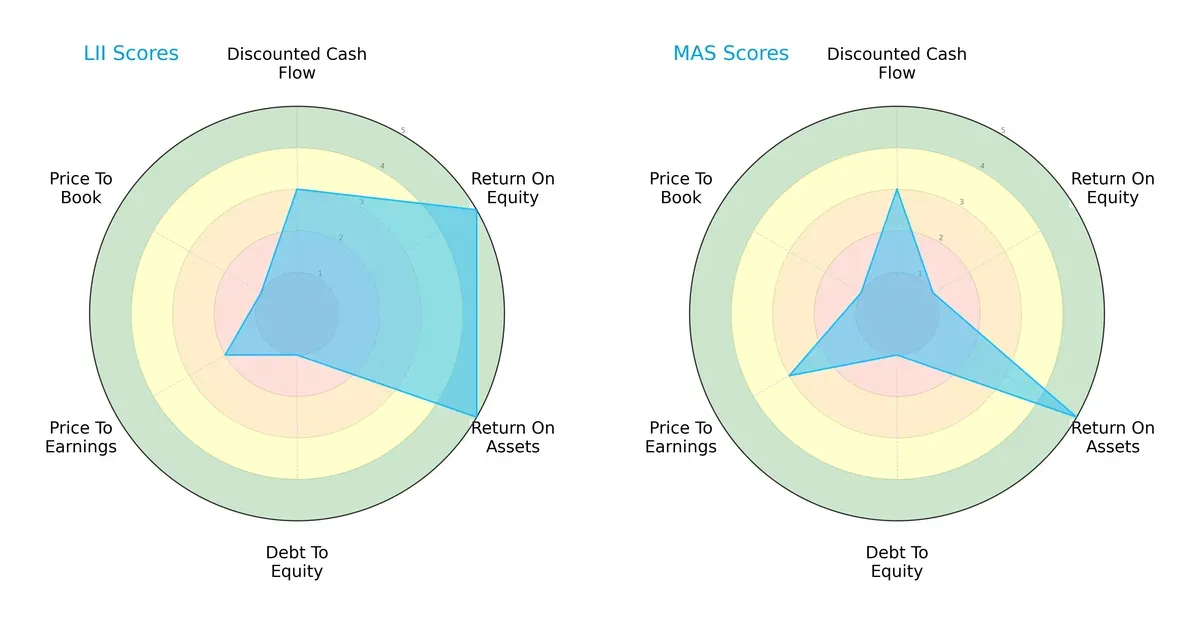
Lennox International excels in return on equity (5) and return on assets (5), demonstrating operational efficiency. Masco matches Lennox in asset utilization (5) but lags in equity returns (1). Both firms share heavy debt burdens (score 1). Lennox has a slightly weaker valuation profile (PE 2, PB 1) than Masco (PE 3, PB 1). Lennox’s profile is more skewed towards profitability metrics; Masco balances valuation better but with weaker equity returns.
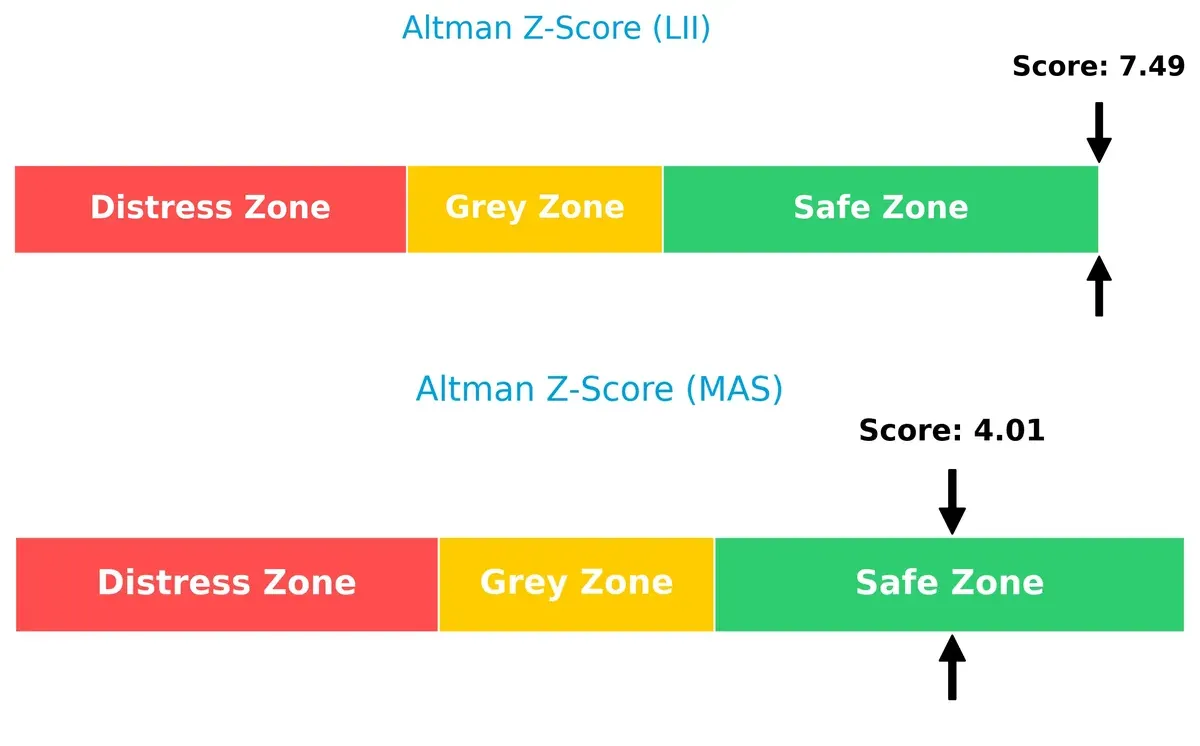
Bankruptcy Risk: Solvency Showdown
Lennox’s Altman Z-Score (7.49) significantly outpaces Masco’s (4.01), signaling stronger long-term solvency in this economic cycle:
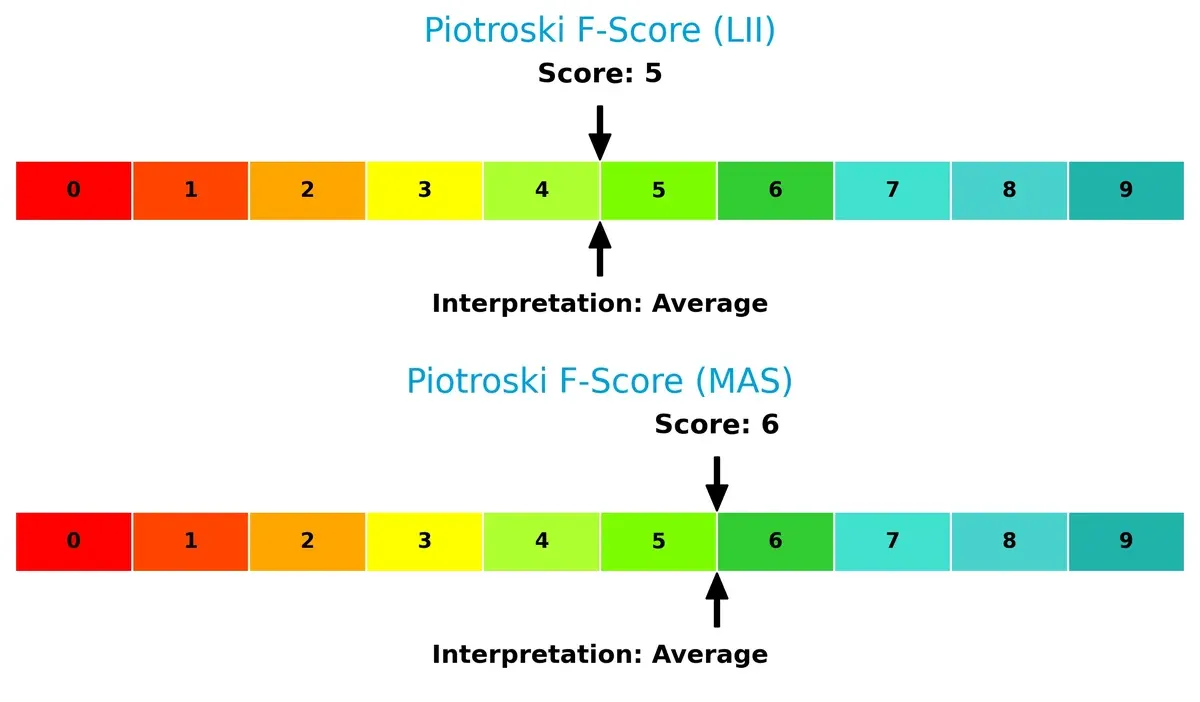
Financial Health: Quality of Operations
Masco’s Piotroski score (6) slightly exceeds Lennox’s (5), indicating marginally better internal financial health and fewer red flags in operational metrics:
How are the two companies positioned?
This section dissects Lennox International and Masco’s operational DNA by comparing their revenue distribution and internal strengths and weaknesses. The goal is to confront their economic moats, identifying which model offers the most resilient and sustainable competitive advantage today.
Revenue Segmentation: The Strategic Mix
The following visual comparison dissects how Lennox International Inc. and Masco Corporation diversify their income streams and where their primary sector bets lie:
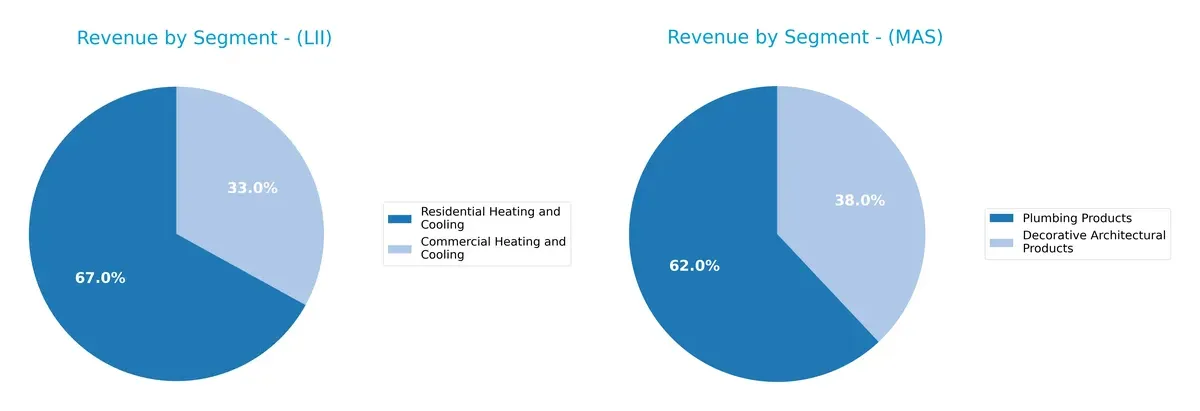
Lennox International leans heavily on Residential Heating and Cooling, generating $3.58B in 2024 and anchoring its revenue mix. Masco Corporation displays a more balanced segmentation with $4.85B from Plumbing Products and $3.0B from Decorative Architectural Products. Masco’s diversified portfolio reduces concentration risk, while Lennox’s dominance in HVAC suggests strong ecosystem lock-in but higher exposure to sector-specific cycles.
Strengths and Weaknesses Comparison
This table compares the strengths and weaknesses of Lennox International Inc. and Masco Corporation:
LII Strengths
- Strong profitability with 15.13% net margin and 67.6% ROE
- Favorable ROIC at 25.51% exceeding WACC
- Diverse revenue streams in residential, commercial HVAC, and refrigeration
- Solid current ratio at 1.6 indicates liquidity
- Consistent asset turnover and interest coverage ratios
MAS Strengths
- Favorable net margin of 10.5% and high ROIC at 29.3%
- Strong liquidity with quick ratio of 1.15 and current ratio of 1.75
- Wide product diversification across plumbing, decorative, cabinetry, and specialty products
- Larger global presence with 1.56B foreign revenue
- Superior fixed asset turnover at 5.81
LII Weaknesses
- Unfavorable high debt levels: debt-to-assets 50.57% and D/E 1.77
- Low quick ratio of 0.63 signals weaker short-term liquidity
- High price-to-book ratio at 14.57 may indicate overvaluation
- Limited international revenue around 250M suggests modest global penetration
MAS Weaknesses
- Negative ROE at -293.57% raises concerns about equity profitability
- Elevated debt-to-assets ratio at 64.07% signals financial leverage risk
- Negative D/E ratio is unusual and requires caution
- Moderate interest coverage at 12.73 is weaker than LII’s
Both companies show strong operational efficiency and product diversification. LII excels in profitability metrics but carries higher leverage risks and weaker quick liquidity. MAS presents a broader product and geographic footprint with robust liquidity but suffers from negative equity returns and high financial leverage. These contrasts highlight different strategic and financial risk profiles.
The Moat Duel: Analyzing Competitive Defensibility
A structural moat is the only defense long-term profits have against relentless competition erosion. Let’s dissect the moats protecting these two Industrials leaders:
Lennox International Inc. (LII): Cost Advantage with Operational Efficiency
Lennox’s moat springs from a cost advantage driven by efficient manufacturing and product innovation. This reflects in a solid 15% net margin and 33% gross margin. Despite a declining ROIC trend, its 17% excess return over WACC signals value creation. New HVAC technologies and expanding refrigeration markets could deepen this moat, though rising input costs pose risks.
Masco Corporation (MAS): Brand Portfolio and Market Penetration
Masco’s competitive edge rests on a broad brand portfolio and strong market penetration, contrasting LII’s cost focus. It commands a 36% gross margin but a thinner 10.5% net margin. Its ROIC outpaces WACC by 21%, with a rising trend indicating strengthening profitability. Continued expansion in plumbing and decorative products internationally supports moat durability and market disruption potential.
Cost Leadership vs. Brand Strength: The Moat Faceoff
Masco holds a wider and more durable moat, backed by growing ROIC and a strong brand ecosystem. Lennox creates value through cost efficiency but faces margin pressure and declining ROIC. Masco is better positioned to defend market share amid evolving industry dynamics.
Which stock offers better returns?
Stock prices for Lennox International Inc. (LII) and Masco Corporation (MAS) show contrasting dynamics over the past year, with LII gaining steadily and MAS experiencing a decline followed by recent gains.
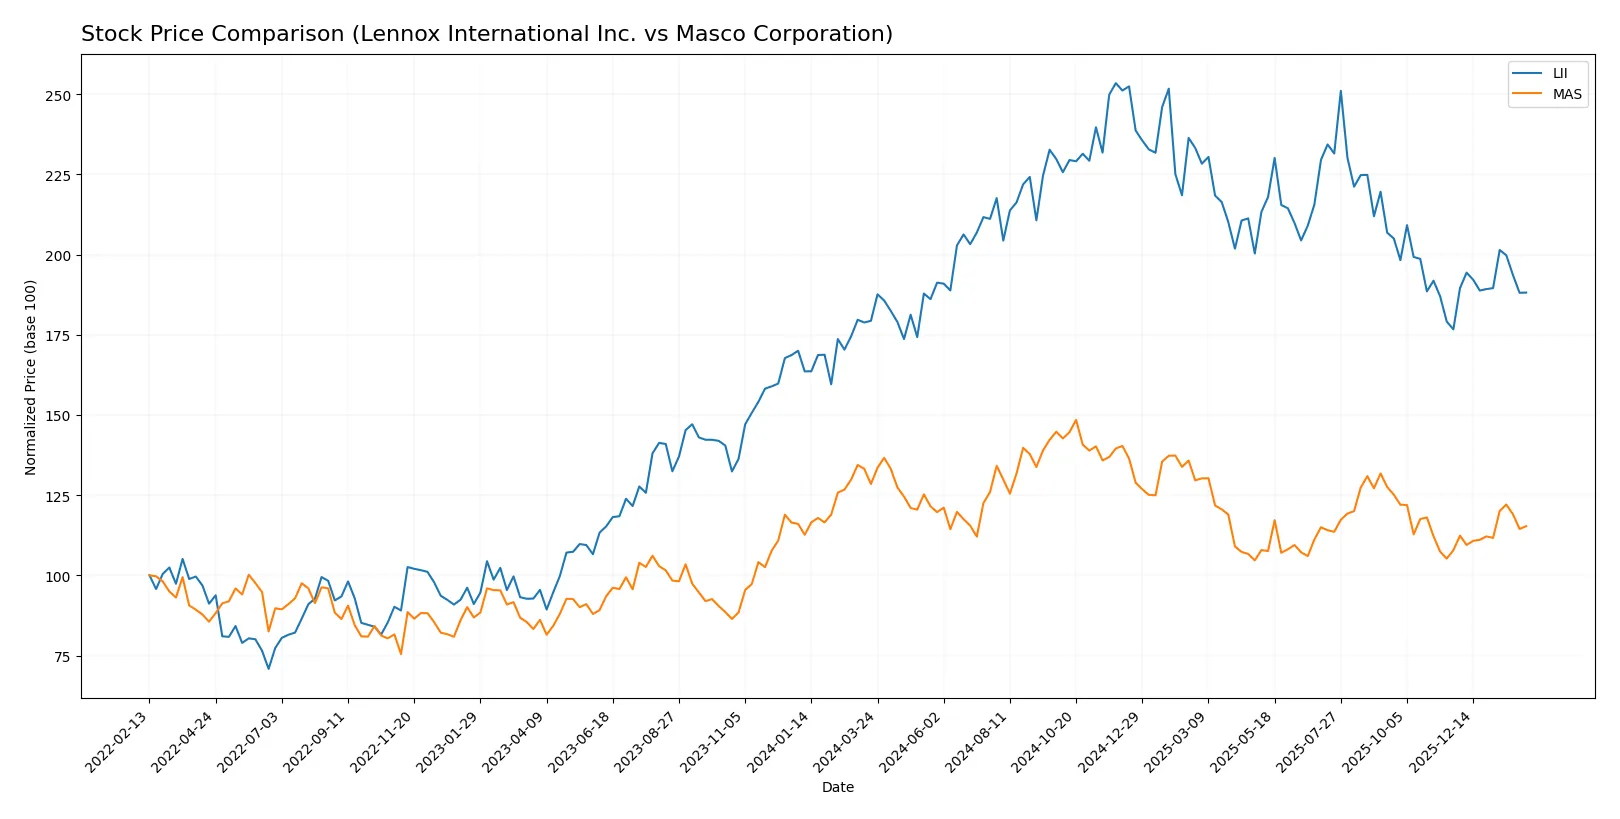
Trend Comparison
Lennox International’s stock rose 4.92% over the past year, marking a bullish trend with accelerating momentum and a high volatility level (std deviation 53.46). It reached a peak of 667.13 and a low of 457.15.
Masco’s stock declined 10.23% in the same period, reflecting a bearish trend despite accelerating momentum. Volatility is much lower (std deviation 6.51), with a high of 85.71 and a low of 60.42.
Comparing trends, Lennox International delivered the highest market performance over the past year, while Masco showed recent recovery but remained overall negative.
Target Prices
Analysts present a clear target price consensus for Lennox International Inc. and Masco Corporation.
| Company | Target Low | Target High | Consensus |
|---|---|---|---|
| Lennox International Inc. | 450 | 667 | 555 |
| Masco Corporation | 67 | 84 | 76.71 |
The target consensus for Lennox International is roughly 12% above its current price of 495, signaling moderate upside potential. Masco’s consensus target exceeds its current price by about 15%, indicating analyst optimism amid market volatility.

Don’t Let Luck Decide Your Entry Point
Optimize your entry points with our advanced ProRealTime indicators. You’ll get efficient buy signals with precise price targets for maximum performance. Start outperforming now!
How do institutions grade them?
Here are the latest institutional grades for Lennox International Inc. and Masco Corporation:
Lennox International Inc. Grades
The table below shows recent grades from leading financial institutions for Lennox International Inc.:
| Grading Company | Action | New Grade | Date |
|---|---|---|---|
| Wells Fargo | Maintain | Equal Weight | 2026-01-29 |
| RBC Capital | Maintain | Sector Perform | 2026-01-29 |
| JP Morgan | Maintain | Underweight | 2026-01-16 |
| Barclays | Maintain | Overweight | 2026-01-07 |
| Barclays | Maintain | Overweight | 2025-12-11 |
| Wells Fargo | Maintain | Equal Weight | 2025-12-04 |
| Wolfe Research | Upgrade | Peer Perform | 2025-11-13 |
| UBS | Maintain | Neutral | 2025-10-27 |
| Morgan Stanley | Maintain | Underweight | 2025-10-23 |
| RBC Capital | Maintain | Sector Perform | 2025-10-23 |
Masco Corporation Grades
Below is the recent grading data from reputable firms for Masco Corporation:
| Grading Company | Action | New Grade | Date |
|---|---|---|---|
| Wells Fargo | Maintain | Overweight | 2026-01-14 |
| Citigroup | Maintain | Neutral | 2026-01-08 |
| Wells Fargo | Upgrade | Overweight | 2025-12-15 |
| Barclays | Downgrade | Equal Weight | 2025-12-08 |
| Argus Research | Maintain | Buy | 2025-11-05 |
| UBS | Maintain | Buy | 2025-10-30 |
| Barclays | Maintain | Overweight | 2025-10-30 |
| Wells Fargo | Maintain | Equal Weight | 2025-10-30 |
| Evercore ISI Group | Maintain | In Line | 2025-10-30 |
| RBC Capital | Maintain | Sector Perform | 2025-10-30 |
Which company has the best grades?
Masco Corporation generally receives more positive grades, including multiple Buy and Overweight ratings. Lennox International shows mixed sentiments with several Underweight and Equal Weight grades. Investors might view Masco’s stronger grades as reflecting better near-term confidence.
Risks specific to each company
The following categories identify the critical pressure points and systemic threats facing both firms in the 2026 market environment:
1. Market & Competition
Lennox International Inc.
- Operates in HVAC and refrigeration with strong residential and commercial segments but faces intense competition and cyclical construction demand.
Masco Corporation
- Focuses on home improvement and building products with diverse brands but faces margin pressure from raw material costs and retail competition.
2. Capital Structure & Debt
Lennox International Inc.
- High debt-to-equity ratio of 1.77 signals elevated leverage risk despite strong interest coverage.
Masco Corporation
- Negative debt-to-equity suggests unusual leverage reporting; however, 64% debt-to-assets ratio indicates a heavier debt burden.
3. Stock Volatility
Lennox International Inc.
- Beta of 1.18 implies moderate sensitivity to market swings, typical for industrial cyclical stocks.
Masco Corporation
- Beta of 1.28 shows higher volatility, increasing risk in turbulent markets.
4. Regulatory & Legal
Lennox International Inc.
- Subject to environmental regulations for refrigeration and HVAC emissions, with compliance costs rising.
Masco Corporation
- Faces regulations in product safety and environmental standards, especially in chemical coatings and plumbing products.
5. Supply Chain & Operations
Lennox International Inc.
- Relies on global supply chains for components; disruptions can impact manufacturing and delivery schedules.
Masco Corporation
- Complex supply chain involving raw materials and multiple product lines, vulnerable to inflation and logistics bottlenecks.
6. ESG & Climate Transition
Lennox International Inc.
- Pressure to innovate energy-efficient HVAC systems amid tightening climate regulations.
Masco Corporation
- Needs to improve sustainability in manufacturing and product life cycles to meet investor and regulatory expectations.
7. Geopolitical Exposure
Lennox International Inc.
- International sales expose it to trade tensions and currency risks, especially in North America and abroad.
Masco Corporation
- Broad geographic footprint increases exposure to tariffs, trade policies, and political instability in key markets.
Which company shows a better risk-adjusted profile?
Lennox’s highest risk is its elevated leverage, which may constrain flexibility in downturns. Masco’s main risk is operational complexity and debt levels combined with weaker profitability metrics. Despite higher volatility, Masco’s balance sheet metrics and favorable ratio scores suggest a marginally better risk-adjusted profile. Recent data shows Lennox’s high debt-to-assets ratio amid rising interest rates, a red flag for cautious investors.
Final Verdict: Which stock to choose?
Lennox International Inc. (LII) excels as a cash-generating powerhouse, demonstrating robust return on invested capital well above its cost of capital. Its declining ROIC trend signals caution, suggesting the need for vigilant monitoring of profitability erosion. LII suits aggressive growth portfolios that tolerate cyclical pressures for premium returns.
Masco Corporation (MAS) boasts a durable moat supported by a growing ROIC and consistent operational efficiency. Its stronger liquidity ratios and steadier financial footing offer relative safety compared to LII, making MAS a fit for investors seeking growth at a reasonable price with moderate risk exposure.
If you prioritize dynamic growth and can weather some margin volatility, Lennox International outshines due to its superior capital returns and bullish price momentum. However, if you seek better stability with a durable competitive advantage, Masco offers a more balanced risk profile and improving profitability trends. Both cases warrant careful risk assessment aligned with your investment horizon.
Disclaimer: Investment carries a risk of loss of initial capital. The past performance is not a reliable indicator of future results. Be sure to understand risks before making an investment decision.
Go Further
I encourage you to read the complete analyses of Lennox International Inc. and Masco Corporation to enhance your investment decisions: