Home > Comparison > Consumer Cyclical > LEN vs PHM
The strategic rivalry between Lennar Corporation and PulteGroup, Inc. shapes the trajectory of the U.S. residential construction sector. Lennar operates a diversified homebuilding and financial services model with a broad product range. PulteGroup focuses on land acquisition and varied home designs under multiple brands. This analysis pits scale and operational breadth against focused market penetration to identify the superior risk-adjusted investment opportunity for diversified portfolios.

Table of contents
Companies Overview
Lennar Corporation and PulteGroup, Inc. are heavyweight competitors shaping the US residential construction market.
Lennar Corporation: Leading Integrated Homebuilder
Lennar dominates as a homebuilder in the United States, generating revenue through construction and sale of single-family and multifamily homes. It also profits from residential mortgage financing and title services. In 2026, Lennar prioritizes expanding multifamily rental properties and enhancing its financial services to capture diverse homebuyer segments.
PulteGroup, Inc.: Versatile Residential Developer
PulteGroup stands out as a residential land developer and homebuilder offering a broad mix of housing types, including single-family and townhomes. It also provides mortgage origination and title insurance. The company’s 2026 focus lies in optimizing lot control and streamlining financing solutions for a wide demographic of homebuyers across multiple branded communities.
Strategic Collision: Similarities & Divergences
Both firms pursue diversified homebuilding and financing to secure market share, but Lennar leans into integrated financial services while PulteGroup emphasizes land acquisition and varied housing designs. Their battleground centers on catering to evolving homebuyer preferences and geographic expansion. Investors face distinct profiles: Lennar’s scale and financial breadth contrast with PulteGroup’s land strategy and brand variety.
Income Statement Comparison
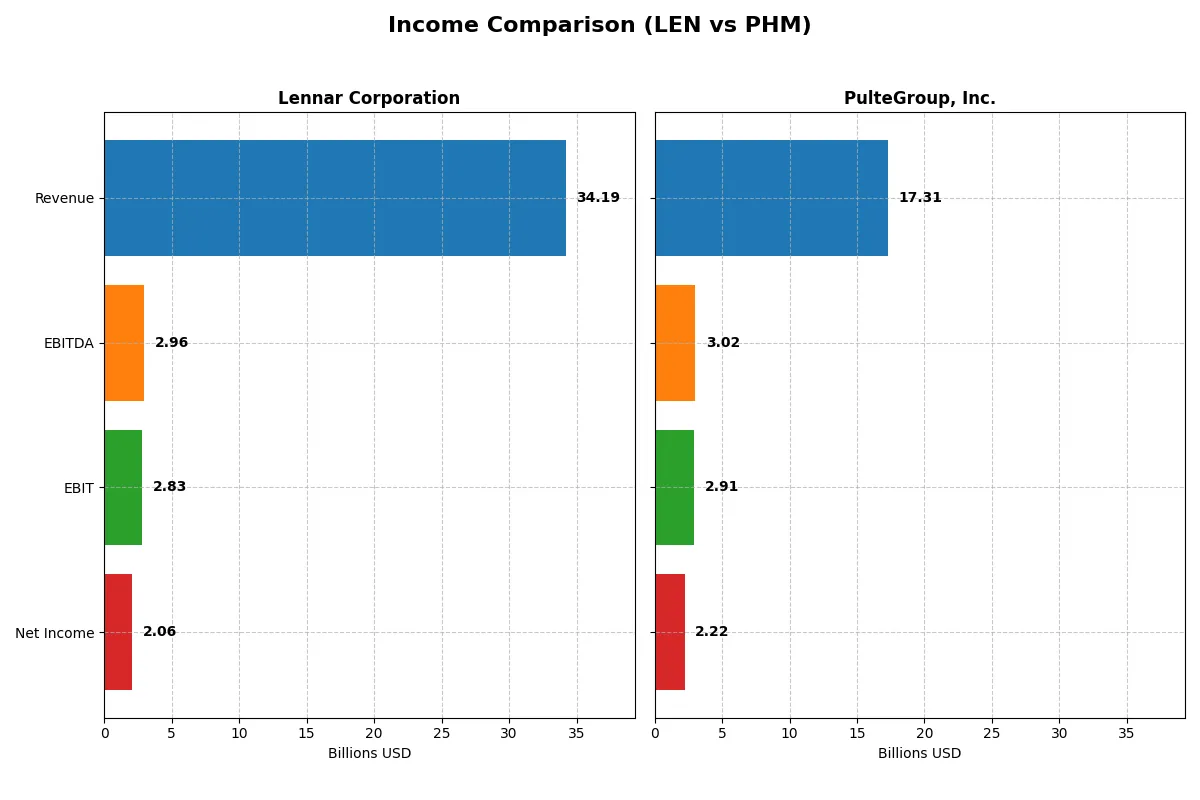
This data dissects the core profitability and scalability of both corporate engines to reveal who dominates the bottom line:
| Metric | Lennar Corporation (LEN) | PulteGroup, Inc. (PHM) |
|---|---|---|
| Revenue | 34.2B | 17.3B |
| Cost of Revenue | 28.1B | 12.7B |
| Operating Expenses | 3.3B | 1.6B |
| Gross Profit | 6.1B | 4.6B |
| EBITDA | 3.0B | 3.0B |
| EBIT | 2.8B | 2.9B |
| Interest Expense | 14M | 0 |
| Net Income | 2.1B | 2.2B |
| EPS | 7.98 | 11.21 |
| Fiscal Year | 2025 | 2025 |
Income Statement Analysis: The Bottom-Line Duel
This income statement comparison reveals the true efficiency and profitability of Lennar Corporation and PulteGroup’s corporate engines over recent years.
Lennar Corporation Analysis
Lennar’s revenue grew 26% from 2021 to 2025 but fell 3.6% in 2025 alone. Net income halved over five years and dropped 45% in 2025. Gross and net margins contracted sharply, signaling margin pressure. The 2025 net margin at 6.0% reflects declining profitability and weaker operational momentum.
PulteGroup, Inc. Analysis
PulteGroup’s revenue rose 26% over five years but declined 3.5% in 2025. Unlike Lennar, net income grew 14% overall despite a 25% dip in 2025. Gross margin at 26.4% and net margin at 12.8% remain robust. PulteGroup sustains stronger margin health and better earnings resilience entering 2026.
Margin Strength vs. Revenue Scale
Lennar commands larger revenue but struggles with shrinking margins and declining profits. PulteGroup trades scale for superior profitability and margin expansion. The fundamental winner is PulteGroup, whose efficient cost management and earnings growth offer a more attractive profile for investors prioritizing sustainable returns.
Financial Ratios Comparison
These vital ratios act as a diagnostic tool to expose the underlying fiscal health, valuation premiums, and capital efficiency of the companies analyzed:
| Ratios | Lennar Corporation (LEN) | PulteGroup, Inc. (PHM) |
|---|---|---|
| ROE | 9.37% | 17.09% |
| ROIC | 6.62% | 159.84% |
| P/E | 16.31 | 10.46 |
| P/B | 1.53 | 1.79 |
| Current Ratio | 3.12 | 20.56 |
| Quick Ratio | 0.96 | -17810.42 |
| D/E | 0.29 | 0.00013 |
| Debt-to-Assets | 18.35% | 10.86% |
| Interest Coverage | 198.24 | 0 |
| Asset Turnover | 0.99 | 1152.44 |
| Fixed Asset Turnover | 37.49 | 0 |
| Payout Ratio | 25.31% | 7.96% |
| Dividend Yield | 1.55% | 0.76% |
| Fiscal Year | 2025 | 2025 |
Efficiency & Valuation Duel: The Vital Signs
Ratios serve as a company’s DNA, uncovering hidden risks and operational strengths essential for informed investment decisions.
Lennar Corporation
Lennar posts a modest 9.37% ROE and neutral net margin at 6.02%, signaling moderate profitability. Its P/E of 16.31 and P/B of 1.53 suggest a fairly valued stock, neither stretched nor cheap. Lennar delivers a 1.55% dividend yield, balancing shareholder returns with cautious reinvestment.
PulteGroup, Inc.
PulteGroup exhibits stronger profitability, with a 17.09% ROE and favorable 12.82% net margin. Its P/E at 10.46 signals an attractively priced stock relative to earnings. Despite a low 0.76% dividend yield, PulteGroup’s impressive ROIC and asset turnover suggest aggressive growth and operational efficiency.
Balanced Profitability Meets Valuation Discipline
PulteGroup offers higher profitability and a more favorable valuation but carries some liquidity concerns. Lennar shows steadier dividend returns and moderate valuation metrics. Investors seeking growth may prefer PulteGroup’s aggressive profile; those favoring stability might lean toward Lennar’s balanced approach.
Which one offers the Superior Shareholder Reward?
I compare Lennar Corporation (LEN) and PulteGroup, Inc. (PHM) based on dividends, payout ratios, and buyback intensity. LEN yields around 1.55% with a 25% payout ratio, supported by strong free cash flow coverage near 93%. PHM yields less at 0.76%, with a lower 8% payout ratio but retains more capital for reinvestment. Both execute modest buybacks, yet LEN’s stable dividends combined with disciplined buybacks suggest a more sustainable distribution model. LEN balances shareholder rewards and growth prudently. I conclude LEN offers a superior total return profile for 2026 investors.
Comparative Score Analysis: The Strategic Profile
The radar chart reveals the fundamental DNA and trade-offs of both firms, highlighting how each balances growth, profitability, leverage, and valuation:
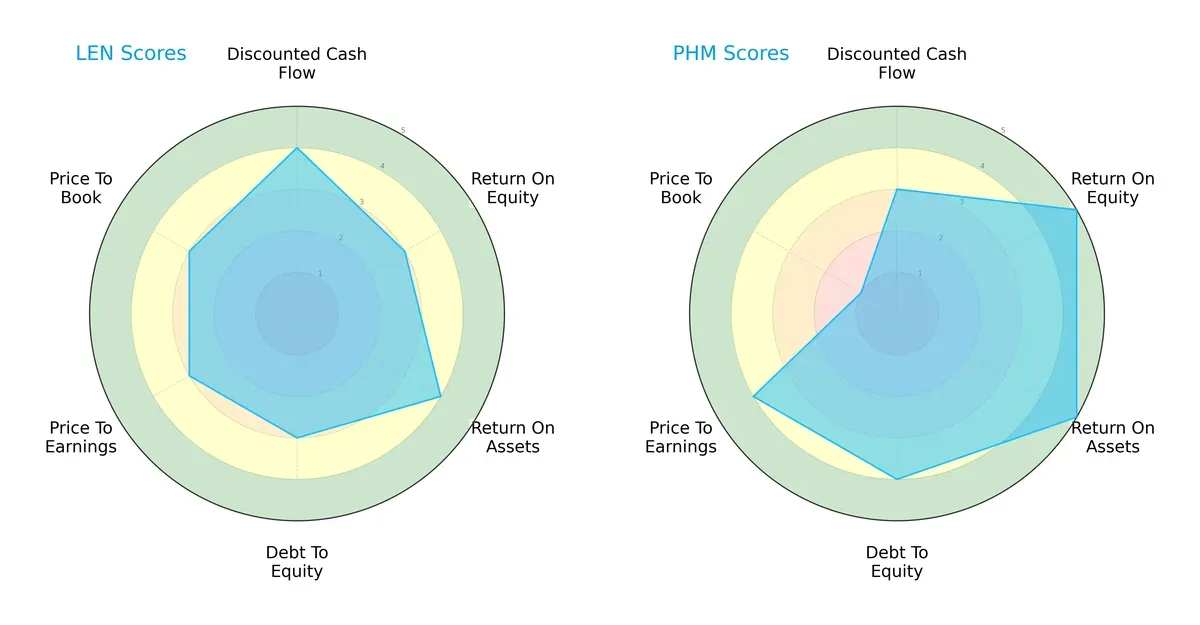
Lennar Corporation (LEN) presents a balanced profile with favorable DCF and ROA scores but moderate ROE and debt management. PulteGroup, Inc. (PHM) excels in profitability metrics (ROE 5, ROA 5) and manages debt better (4 vs. 3), yet shows a valuation weakness in price-to-book (score 1). PHM relies on operational efficiency, while LEN maintains steadier valuation scores, making LEN more balanced overall.
Bankruptcy Risk: Solvency Showdown
The Altman Z-Score delta favors PulteGroup, indicating stronger solvency and lower bankruptcy risk in this cycle:
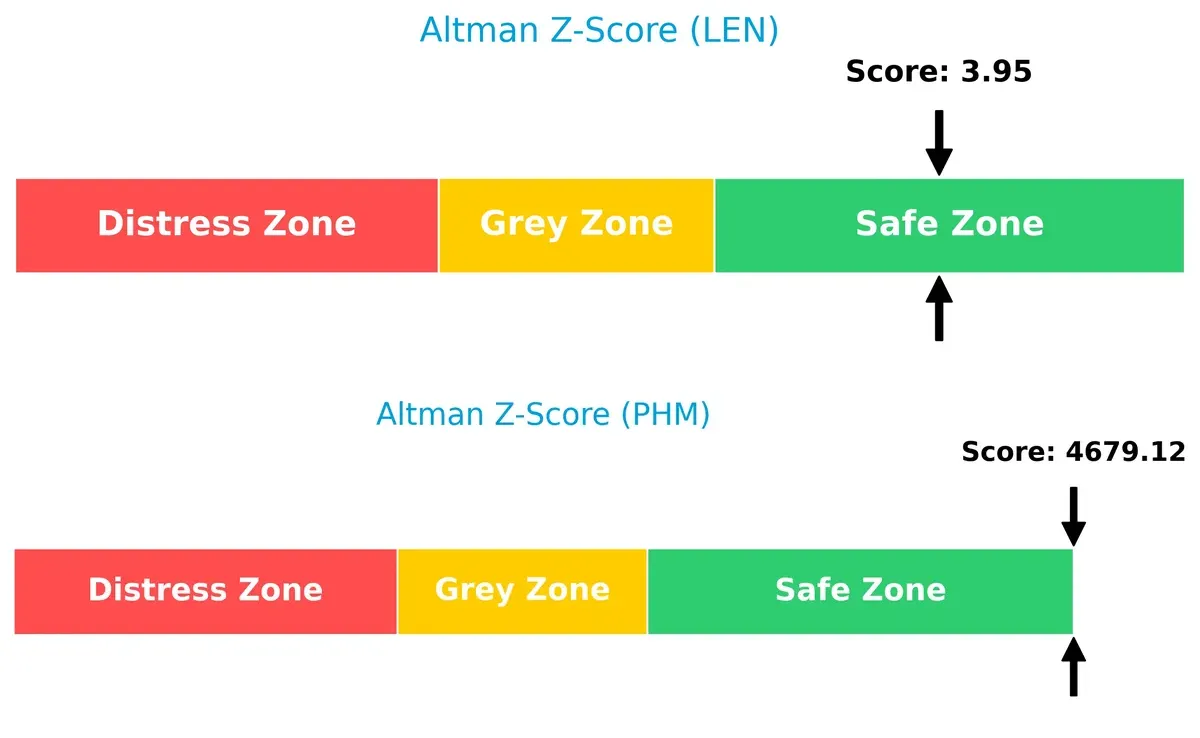
PHM’s Z-Score of 4,680 far exceeds LEN’s 3.95, both safely in the safe zone. However, PHM’s score suggests exceptional financial stability, reducing long-term survival risk compared to LEN.
Financial Health: Quality of Operations
PulteGroup’s higher Piotroski F-Score signals superior operational quality and fewer red flags relative to Lennar:
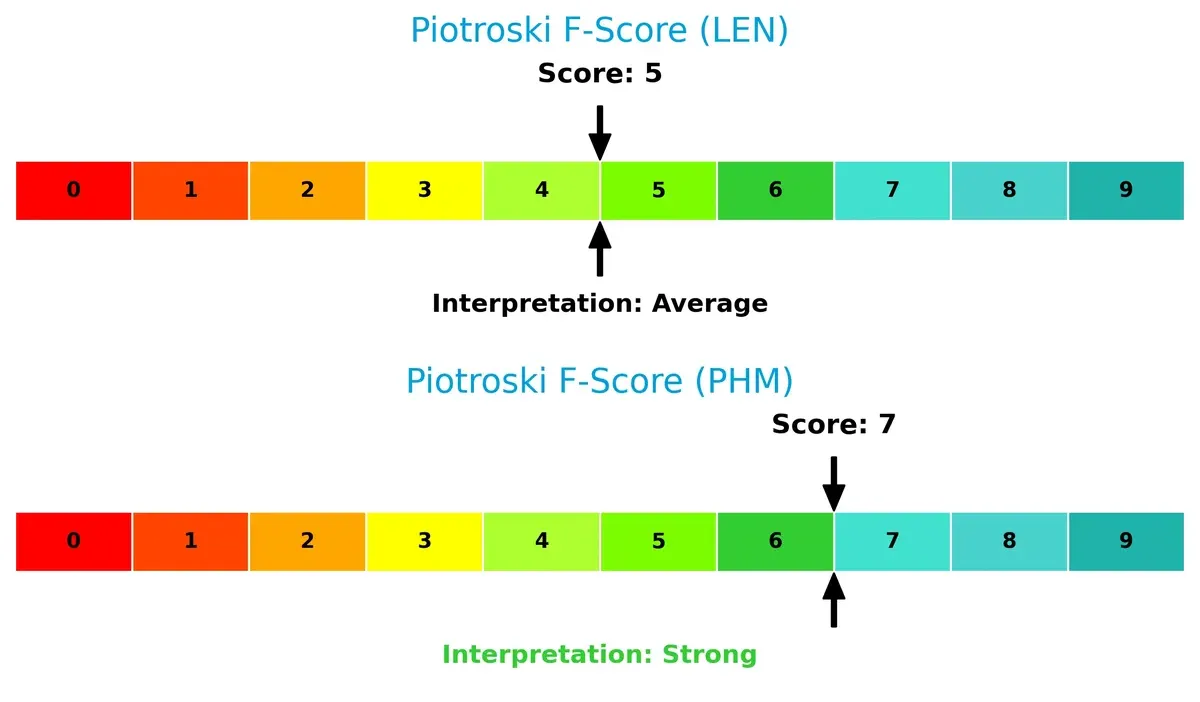
PHM scores 7 (strong), outperforming LEN’s 5 (average). This suggests PHM’s internal metrics like profitability, liquidity, and efficiency are more robust, reinforcing its healthier financial condition.
How are the two companies positioned?
This section dissects Lennar and PulteGroup’s operational DNA by comparing revenue distribution and internal dynamics. The goal is to confront their economic moats and identify which model offers the most sustainable competitive advantage today.
Revenue Segmentation: The Strategic Mix
This visual comparison dissects how Lennar Corporation and PulteGroup, Inc. diversify their income streams and where their primary sector bets lie:
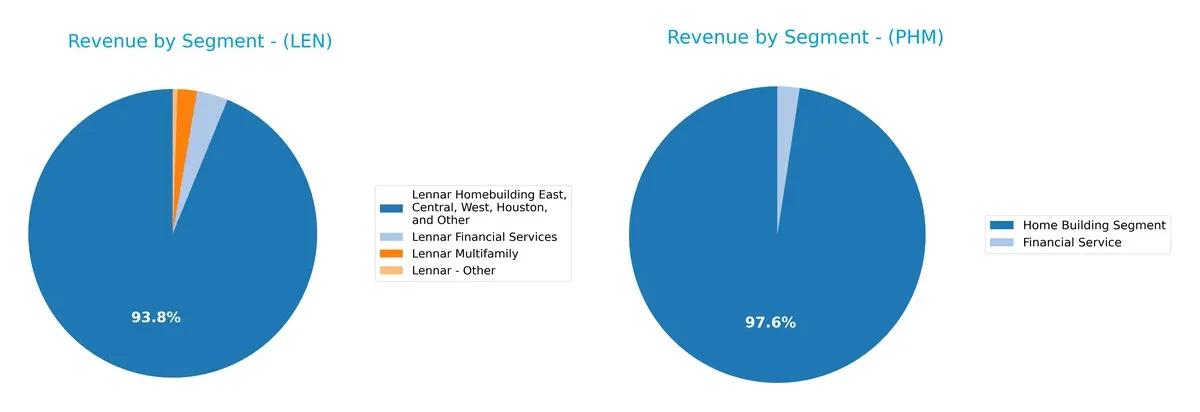
Lennar dwarfs PulteGroup in financial services, generating $1.2B versus $433M in 2024, while its core homebuilding segment anchors $32.3B in revenue. PulteGroup relies heavily on homebuilding at $17.5B, with a smaller financial segment. Lennar’s diversification into multifamily and financial services mitigates concentration risk, whereas PulteGroup pivots more on its homebuilding segment, exposing it to housing market cycles.
Strengths and Weaknesses Comparison
This table compares the Strengths and Weaknesses of Lennar Corporation and PulteGroup, Inc.:
Lennar Corporation Strengths
- Diverse revenue streams including homebuilding, financial services, and multifamily segments
- Favorable debt metrics with low debt-to-equity and strong interest coverage
- Solid asset turnover efficiency
PulteGroup, Inc. Strengths
- Strong profitability with high net margin, ROE, and ROIC
- Favorable valuation with low P/E ratio
- Debt-free with excellent interest coverage
- High asset turnover indicating efficient use of assets
Lennar Corporation Weaknesses
- Unfavorable return on equity below cost of capital
- Unusually high current ratio may indicate inefficient asset use
- Quick ratio neutral but near liquidity concerns
- Moderate market valuation metrics
PulteGroup, Inc. Weaknesses
- Unfavorable liquidity ratios with extreme current and quick ratios
- Fixed asset turnover is zero, suggesting low asset utilization
- Lower dividend yield compared to Lennar
- Higher proportion of unfavorable ratios overall
Overall, Lennar benefits from diversified operations and prudent leverage but faces challenges in equity returns and liquidity efficiency. PulteGroup excels in profitability and balance sheet strength but exhibits liquidity anomalies and asset utilization concerns, which may influence strategic focus areas.
The Moat Duel: Analyzing Competitive Defensibility
A structural moat is the only reliable shield protecting long-term profits from relentless competitive erosion in cyclical industries like homebuilding:
Lennar Corporation: Geographic Diversification and Scale Moat
Lennar leverages broad regional presence and scale to stabilize revenue amid cycles. However, declining ROIC and profit margins signal weakening efficiency and a shrinking moat in 2026.
PulteGroup, Inc.: Operational Excellence and Capital Efficiency Moat
PulteGroup’s moat centers on superior capital allocation and operational efficiency, reflected by a very favorable ROIC trend. This positions PulteGroup to deepen its competitive edge through disciplined growth in 2026.
Scale and Efficiency: The Moat Face-Off
PulteGroup’s growing ROIC and clear value creation mark a wider, more durable moat than Lennar’s diminishing returns. I see PulteGroup better equipped to defend and expand market share in a volatile housing market.
Which stock offers better returns?
The past year reveals stark contrasts: Lennar Corporation’s shares declined sharply, while PulteGroup, Inc. gained steadily with accelerating momentum.
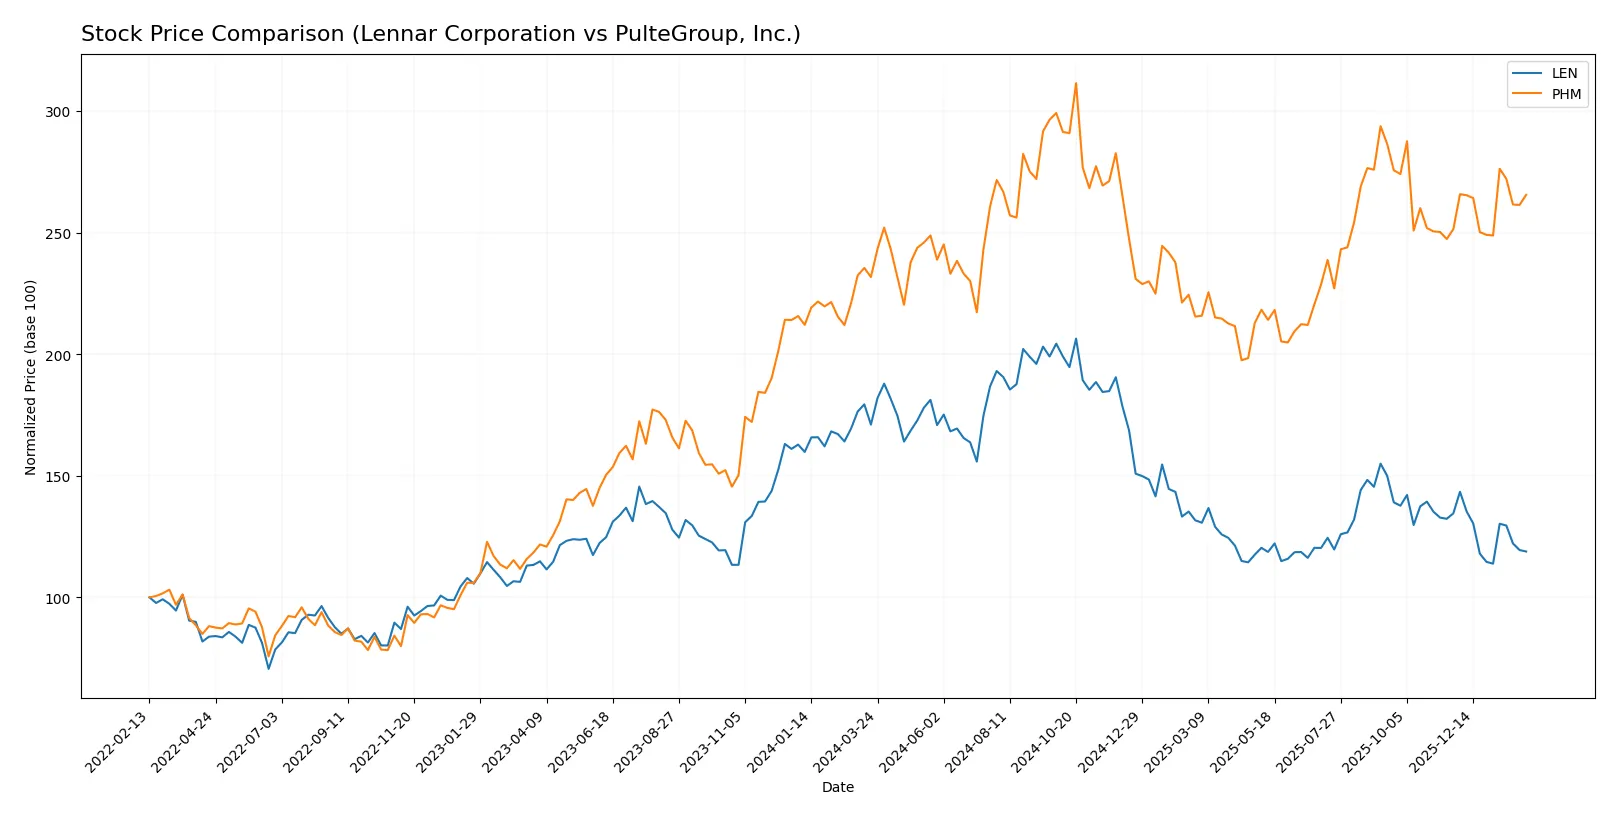
Trend Comparison
Lennar’s stock fell 30.51% over the last 12 months, signaling a bearish trend with decelerating losses. It ranged from a high of 188.93 to a low near 104, with high volatility (25.93 std dev).
PulteGroup’s stock rose 14.58% in the same period, marking a bullish trend with accelerating gains. The price fluctuated between 94.53 and 149.04, showing moderate volatility (12.39 std dev).
Comparing both, PulteGroup outperformed Lennar, delivering the highest market returns with a clear upward trajectory.
Target Prices
Analysts show a bullish consensus for Lennar Corporation and PulteGroup, Inc., with targets above current market prices.
| Company | Target Low | Target High | Consensus |
|---|---|---|---|
| Lennar Corporation | 88 | 140 | 106.88 |
| PulteGroup, Inc. | 115 | 159 | 136 |
The consensus target for Lennar at 106.88 is slightly below its current price of 108.8, suggesting limited upside. PulteGroup’s consensus target of 136 exceeds its current price of 127.07, indicating stronger growth expectations.

Don’t Let Luck Decide Your Entry Point
Optimize your entry points with our advanced ProRealTime indicators. You’ll get efficient buy signals with precise price targets for maximum performance. Start outperforming now!
How do institutions grade them?
The following tables summarize recent institutional grades for Lennar Corporation and PulteGroup, Inc.:
Lennar Corporation Grades
This table lists the latest grades issued by major financial institutions for Lennar Corporation.
| Grading Company | Action | New Grade | Date |
|---|---|---|---|
| Citigroup | maintain | Neutral | 2026-01-08 |
| Citizens | downgrade | Market Perform | 2026-01-07 |
| Wells Fargo | maintain | Equal Weight | 2026-01-06 |
| UBS | downgrade | Neutral | 2026-01-06 |
| Wells Fargo | maintain | Equal Weight | 2025-12-18 |
| Keefe, Bruyette & Woods | maintain | Market Perform | 2025-12-18 |
| B of A Securities | downgrade | Underperform | 2025-12-18 |
| Evercore ISI Group | downgrade | Underperform | 2025-12-18 |
| UBS | maintain | Buy | 2025-12-18 |
| RBC Capital | downgrade | Underperform | 2025-12-18 |
PulteGroup, Inc. Grades
This table shows recent grades from respected institutions for PulteGroup, Inc.
| Grading Company | Action | New Grade | Date |
|---|---|---|---|
| RBC Capital | maintain | Sector Perform | 2026-01-30 |
| Oppenheimer | maintain | Outperform | 2026-01-30 |
| Wells Fargo | maintain | Overweight | 2026-01-14 |
| Citigroup | maintain | Neutral | 2026-01-08 |
| Wells Fargo | maintain | Overweight | 2026-01-06 |
| UBS | maintain | Buy | 2026-01-06 |
| Evercore ISI Group | maintain | In Line | 2025-10-22 |
| B of A Securities | maintain | Buy | 2025-10-10 |
| Evercore ISI Group | downgrade | In Line | 2025-10-07 |
| Citigroup | maintain | Neutral | 2025-10-01 |
Which company has the best grades?
PulteGroup consistently holds stronger grades, including Buy and Overweight ratings. Lennar faces several downgrades to Underperform and Neutral. Investors might view PulteGroup as currently favored by analysts.
Risks specific to each company
The following categories identify the critical pressure points and systemic threats facing both firms in the 2026 market environment:
1. Market & Competition
Lennar Corporation
- Faces intense competition with a beta of 1.46, indicating higher sensitivity to market swings.
PulteGroup, Inc.
- Slightly lower beta at 1.34 suggests marginally less market volatility risk.
2. Capital Structure & Debt
Lennar Corporation
- Maintains moderate leverage (D/E 0.29) with strong interest coverage (204x), signaling prudent debt management.
PulteGroup, Inc.
- Virtually no debt (D/E 0.0) and infinite interest coverage, reflecting a very conservative capital structure.
3. Stock Volatility
Lennar Corporation
- Experiences higher stock volatility (beta 1.46), increasing investment risk.
PulteGroup, Inc.
- Lower beta (1.34) reduces exposure to market turbulence.
4. Regulatory & Legal
Lennar Corporation
- Operates nationwide with typical residential construction regulatory exposure; no specific legal red flags noted.
PulteGroup, Inc.
- Similar regulatory environment; no material legal issues reported.
5. Supply Chain & Operations
Lennar Corporation
- Asset turnover near 1.0 shows efficient use of assets, supporting operational stability.
PulteGroup, Inc.
- Extremely high asset turnover (1152x) appears anomalous, possibly due to accounting factors; fixed asset turnover at zero raises operational concerns.
6. ESG & Climate Transition
Lennar Corporation
- No explicit ESG data; as a large builder, likely faces moderate transition risks.
PulteGroup, Inc.
- Similarly exposed; lack of disclosed ESG metrics adds uncertainty.
7. Geopolitical Exposure
Lennar Corporation
- US-focused operations reduce geopolitical risk but remain sensitive to national economic cycles.
PulteGroup, Inc.
- Also US-centric; geopolitical risk limited but economic cycle sensitivity remains.
Which company shows a better risk-adjusted profile?
PulteGroup faces operational anomalies with its asset turnover and liquidity ratios, but it boasts stronger profitability and near-zero leverage. Lennar holds a more balanced operational profile but carries higher leverage and volatility. Both are in the safe zone per Altman Z-scores, yet PulteGroup’s superior ROE and lower debt tilt the risk-adjusted advantage in its favor. However, PulteGroup’s unusual liquidity ratios warrant caution. Recent financial data reveal PulteGroup’s exceptional return on invested capital and zero debt, underscoring its strong financial footing despite operational red flags.
Final Verdict: Which stock to choose?
Lennar Corporation’s superpower lies in its robust balance sheet and disciplined capital structure. It maintains strong liquidity and manageable debt, which supports resilience in housing market cycles. However, its declining profitability signals a point of vigilance. Lennar fits an aggressive growth portfolio willing to weather short-term headwinds for potential long-term gains.
PulteGroup, Inc. boasts a durable competitive moat with exceptional capital efficiency and rising returns on invested capital. Its strong margins and solid income quality underpin a safer investment profile compared to Lennar. PulteGroup suits a GARP (Growth at a Reasonable Price) portfolio focused on consistent value creation and stability.
If you prioritize capital efficiency and durable profitability, PulteGroup outshines Lennar with its superior moat and improving returns. However, if you seek a company with strong liquidity and are comfortable with cyclical risks, Lennar might offer attractive growth potential despite its earnings challenges. Both present distinct analytical scenarios tailored to different investor risk tolerances.
Disclaimer: Investment carries a risk of loss of initial capital. The past performance is not a reliable indicator of future results. Be sure to understand risks before making an investment decision.
Go Further
I encourage you to read the complete analyses of Lennar Corporation and PulteGroup, Inc. to enhance your investment decisions: