Home > Comparison > Consumer Cyclical > LEN vs NVR
The competitive dynamic between Lennar Corporation and NVR, Inc. shapes the residential construction sector’s landscape. Lennar operates a diversified model spanning homebuilding and mortgage financing, while NVR focuses on efficient single-family home construction with a leaner workforce. This head-to-head contrasts scale and vertical integration against operational discipline. This analysis aims to identify which strategy delivers superior risk-adjusted returns for a balanced, growth-oriented portfolio.

Table of contents
Companies Overview
Lennar Corporation and NVR, Inc. stand as two heavyweight contenders in the U.S. residential construction market, shaping housing trends and consumer choices.
Lennar Corporation: Diverse Homebuilding Powerhouse
Lennar leads as a broad-market homebuilder with a strong footprint in single-family and multifamily homes. It monetizes through diversified segments, including mortgage financing and land development. In 2026, Lennar emphasizes expanding its financial services and multifamily rental development to capture evolving housing demand.
NVR, Inc.: Focused Regional Builder
NVR operates as a specialized homebuilder targeting single-family detached and attached homes primarily in the Mid-Atlantic and Midwest. Its revenue hinges on the sale of homes under multiple brand names and mortgage-related services. The company focuses on regional market depth and streamlining mortgage banking to enhance operational efficiency.
Strategic Collision: Similarities & Divergences
Both companies compete fiercely in residential construction, yet Lennar’s diversified service model contrasts with NVR’s regional, brand-focused approach. The primary battleground lies in market coverage and financing integration. Investors face distinct profiles: Lennar offers scale and diversification, whereas NVR delivers focused execution and operational discipline.
Income Statement Comparison
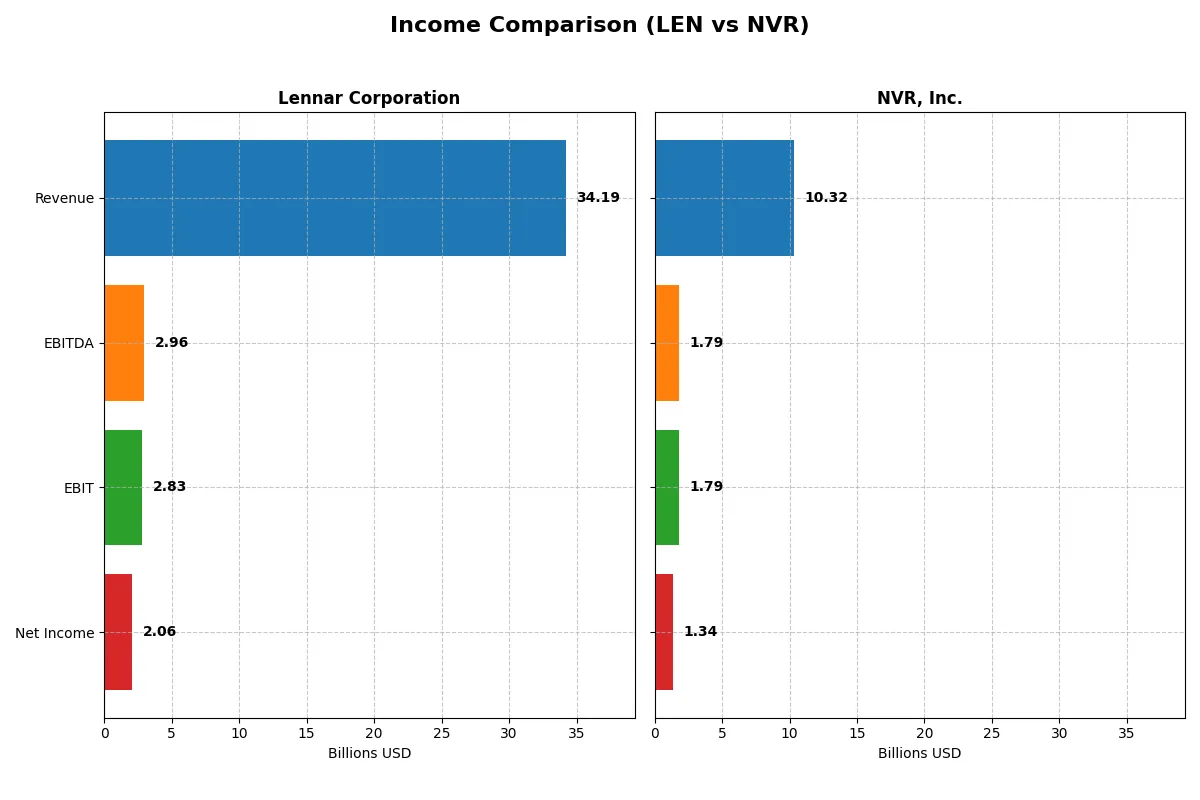
The following data dissects the core profitability and scalability of both corporate engines to reveal who dominates the bottom line:
| Metric | Lennar Corporation (LEN) | NVR, Inc. (NVR) |
|---|---|---|
| Revenue | 34.2B | 10.3B |
| Cost of Revenue | 28.1B | 7.9B |
| Operating Expenses | 3.3B | 699M |
| Gross Profit | 6.1B | 2.4B |
| EBITDA | 3.0B | 1.8B |
| EBIT | 2.8B | 1.8B |
| Interest Expense | 14M | 29M |
| Net Income | 2.1B | 1.3B |
| EPS | 7.98 | 462 |
| Fiscal Year | 2025 | 2025 |
Income Statement Analysis: The Bottom-Line Duel
This income statement comparison reveals the true efficiency and profitability dynamics of Lennar Corporation and NVR, Inc. over recent years.
Lennar Corporation Analysis
Lennar’s revenue grew 26% from 2021 to 2025 but dipped 3.6% in the latest year to $34.2B. Net income halved over five years, falling sharply by 45.7% in 2025 to $2.06B. Gross and net margins contracted significantly, signaling margin pressure. Efficiency weakened as EBIT dropped 46%, reflecting cost challenges and reduced profitability momentum.
NVR, Inc. Analysis
NVR’s revenue rose 15% over five years, easing 2.1% to $10.3B in 2025. Net income edged up 8.3% over the period, reaching $1.34B despite a 18.7% net margin decline last year. Higher gross margin near 23% and EBIT margin of 17.4% showcase stronger profitability. Although growth slowed, NVR sustains healthier margin profiles and operational leverage.
Margin Resilience vs. Scale and Decline
NVR exhibits superior margin resilience and steady net income growth, underpinning operational efficiency. Lennar commands larger revenue but suffers sharp margin erosion and profit declines. For investors, NVR’s consistent profitability and margin strength present a more attractive profile compared to Lennar’s scale challenged by deteriorating earnings.
Financial Ratios Comparison
These vital ratios act as a diagnostic tool to expose the underlying fiscal health, valuation premiums, and capital efficiency of the companies compared below:
| Ratios | Lennar Corporation (LEN) | NVR, Inc. (NVR) |
|---|---|---|
| ROE | 9.37% | 0% |
| ROIC | 6.62% | 0% |
| P/E | 16.31 | 15.79 |
| P/B | 1.53 | 0 |
| Current Ratio | 3.12 | 0 |
| Quick Ratio | 0.96 | 0 |
| D/E | 0.29 | 0 |
| Debt-to-Assets | 18.35% | 0% |
| Interest Coverage | 198.24 | -55.89 |
| Asset Turnover | 0.99 | 0 |
| Fixed Asset Turnover | 37.49 | 0 |
| Payout ratio | 25.31% | 0% |
| Dividend yield | 1.55% | 0% |
| Fiscal Year | 2025 | 2025 |
Efficiency & Valuation Duel: The Vital Signs
Ratios act as a company’s DNA, unveiling hidden risks and operational strengths that raw numbers alone cannot reveal.
Lennar Corporation
Lennar posts a modest 9.4% ROE, reflecting subdued profitability, while its P/E of 16.3 suggests fair valuation. The 6% net margin is neutral, indicating operational steadiness. Dividend yield at 1.55% shows moderate shareholder returns. With a focus on maintaining financial health, Lennar balances debt prudently and invests in fixed assets efficiently.
NVR, Inc.
NVR shows a strong net margin of 13.3%, signaling superior operational efficiency despite a reported 0% ROE and ROIC, which may reflect reporting gaps. Its P/E of 15.8 remains neutral, indicating reasonable market pricing. NVR does not pay dividends, instead retaining earnings to fuel growth. The company exhibits low leverage and robust interest coverage, highlighting financial stability.
Balanced Operational Efficiency vs. Reporting Clarity
Lennar offers more consistent profitability metrics and moderate shareholder returns, while NVR’s operational margin outperforms but suffers from incomplete return ratios. Investors seeking clarity and steady income may lean toward Lennar, whereas those favoring operational efficiency and growth potential might prefer NVR’s profile.
Which one offers the Superior Shareholder Reward?
I find Lennar Corporation (LEN) offers a more balanced and sustainable shareholder reward compared to NVR, Inc. LEN pays a consistent dividend yield around 1.5% with a moderate payout ratio near 25%, supported by strong free cash flow coverage. It also actively repurchases shares, enhancing total returns. NVR pays no dividends and relies solely on capital appreciation through reinvestment, with no disclosed buybacks. LEN’s dividend plus buyback strategy provides steady income and capital return, while NVR’s growth-only approach carries more risk amid market volatility. For 2026, I favor LEN’s distribution model for long-term value and shareholder rewards.
Comparative Score Analysis: The Strategic Profile
The radar chart reveals the fundamental DNA and strategic trade-offs between Lennar Corporation and NVR, Inc.:
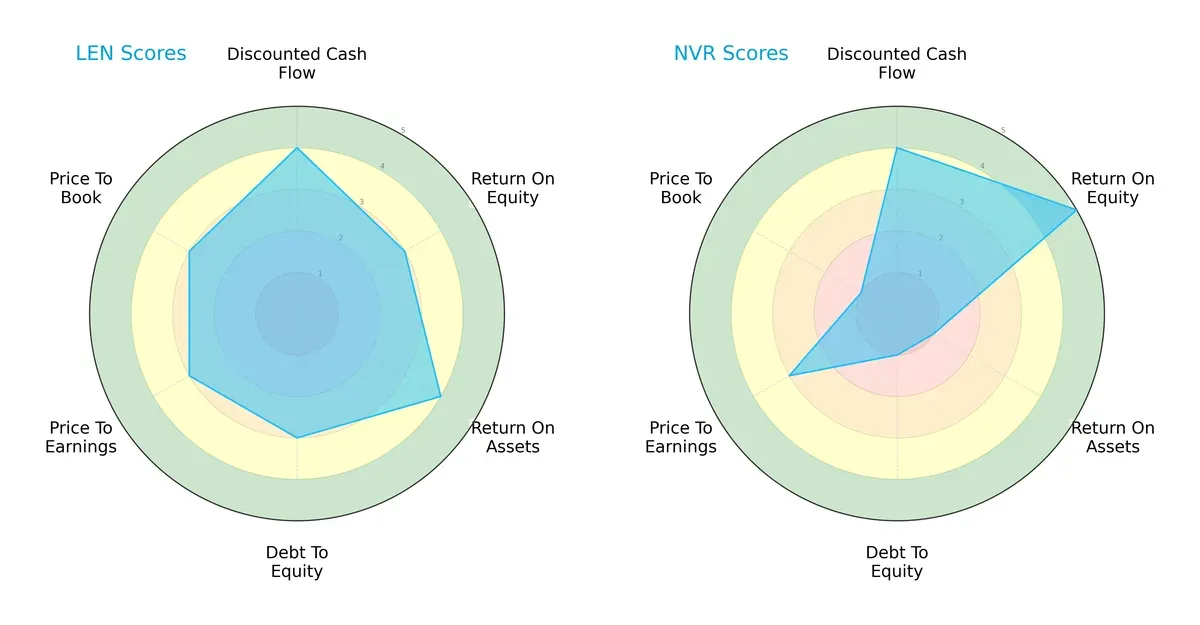
Lennar shows a balanced financial profile with solid scores in DCF (4), ROA (4), and moderate leverage (3). NVR excels in ROE (5) but struggles with asset efficiency (ROA 1) and carries higher financial risk (Debt/Equity 1). Lennar’s diversification contrasts with NVR’s reliance on equity returns.
Bankruptcy Risk: Solvency Showdown
Lennar’s Altman Z-Score of 3.95 places it securely in the safe zone, signaling strong long-term survival prospects in this cycle. NVR’s Altman Z-Score is unavailable, limiting direct comparison:

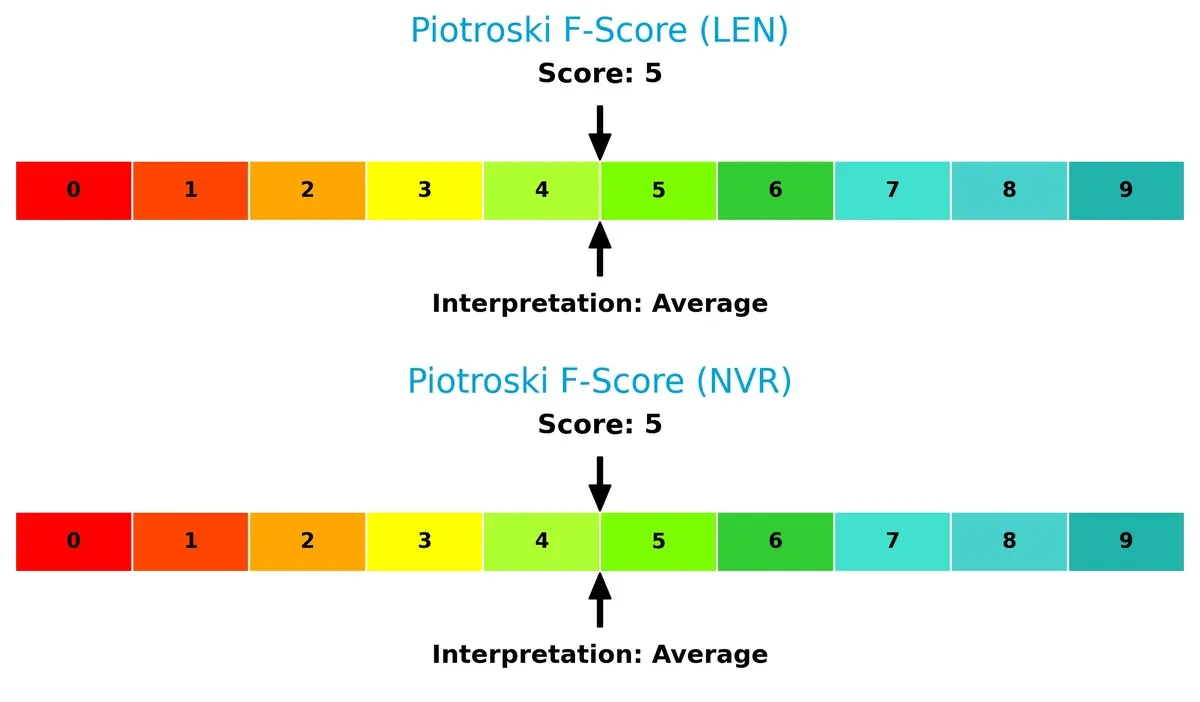
Financial Health: Quality of Operations
Both firms score a 5 on the Piotroski F-Score, indicating average financial health. Neither company raises immediate red flags, but there is room for improvement to reach strong financial quality:
How are the two companies positioned?
This section dissects the operational DNA of LEN and NVR by comparing their revenue distribution and internal dynamics, including strengths and weaknesses. The final objective confronts their economic moats to reveal which business model offers the most resilient, sustainable competitive advantage today.
Revenue Segmentation: The Strategic Mix
This visual comparison dissects how Lennar Corporation and NVR, Inc. diversify their income streams and reveals where their primary sector bets lie:
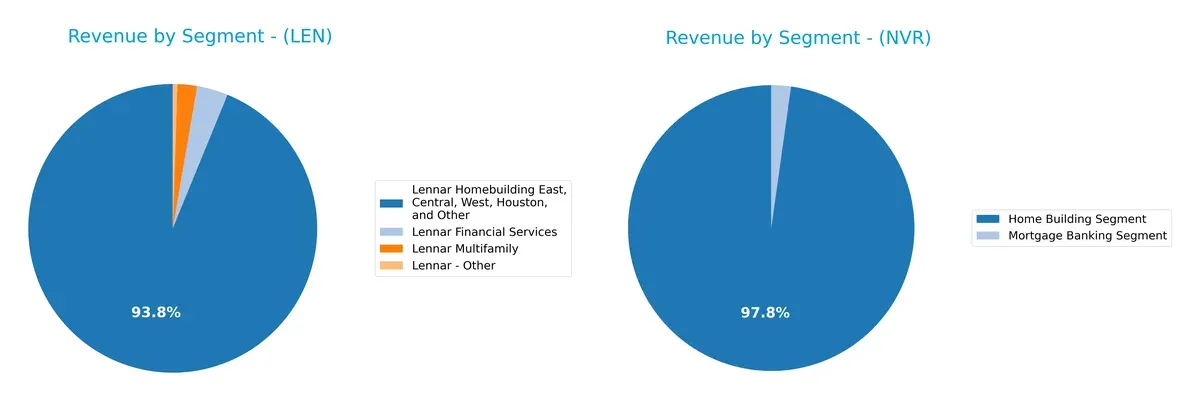
Lennar’s revenue dwarfs NVR’s, anchored by its $32.3B homebuilding segment and a $1.2B financial services arm, showcasing a diversified ecosystem. NVR pivots almost exclusively on its $10.3B homebuilding segment with a minor $230M mortgage banking unit. Lennar’s broad mix mitigates concentration risk, while NVR leans into homebuilding dominance, exposing it to cyclical swings but benefiting from focused operational scale.
Strengths and Weaknesses Comparison
This table compares the strengths and weaknesses of Lennar Corporation and NVR, Inc.:
LEN Strengths
- Diversified revenue streams including homebuilding, financial services, and multifamily segments
- Favorable debt-to-equity and interest coverage ratios
- Strong asset turnover and fixed asset turnover ratios
- Broad geographic presence across multiple U.S. regions
NVR Strengths
- Higher net margin reflecting strong profitability
- Favorable price-to-book ratio indicating undervaluation
- Favorable debt ratios and solid interest coverage
- Focused homebuilding operations with consistent revenue growth
LEN Weaknesses
- Unfavorable return on equity despite neutral ROIC
- Elevated current ratio signals possible liquidity management issues
- Neutral net margin limits profitability upside
- Moderate price-to-earnings ratio
NVR Weaknesses
- Zero reported ROE and ROIC raise profitability concerns
- Missing data on WACC limits cost of capital analysis
- Unfavorable current and quick ratios indicate liquidity risks
- Unfavorable asset turnover and fixed asset turnover ratios
- No dividend yield reduces income appeal
Overall, LEN benefits from diversified operations and solid financial leverage metrics, though profitability and liquidity warrant attention. NVR shows strong profitability but faces notable weaknesses in returns, liquidity, and asset efficiency. These contrasts suggest differing strategic focuses and risk profiles.
The Moat Duel: Analyzing Competitive Defensibility
A structural moat is the only safeguard preserving long-term profits against relentless competitive pressure and market erosion:
Lennar Corporation: Diversified Regional Scale Advantage
Lennar leverages scale across multiple U.S. regions, creating a cost advantage visible in moderate margins and diversified revenue streams. However, its declining ROIC signals rising pressure on profitability in 2026.
NVR, Inc.: Operational Efficiency and Selective Market Focus
NVR’s moat roots in operational efficiency and high-margin homebuilding in concentrated Mid-Atlantic and Mid-East markets. Despite limited geographic reach versus Lennar, it sustains stronger margin profiles, yet faces ROIC erosion challenges.
Scale Versus Efficiency: The Moat Face-Off
Lennar’s broader geographic footprint offers wider moat potential but suffers from value destruction trends. NVR’s tighter market focus yields deeper margin protection yet signals caution with declining ROIC. I see NVR better positioned to defend market share through operational discipline despite its narrower scope.
Which stock offers better returns?
The stock prices of Lennar Corporation and NVR, Inc. show contrasting movements over the past year, reflecting different market dynamics and investor sentiment.
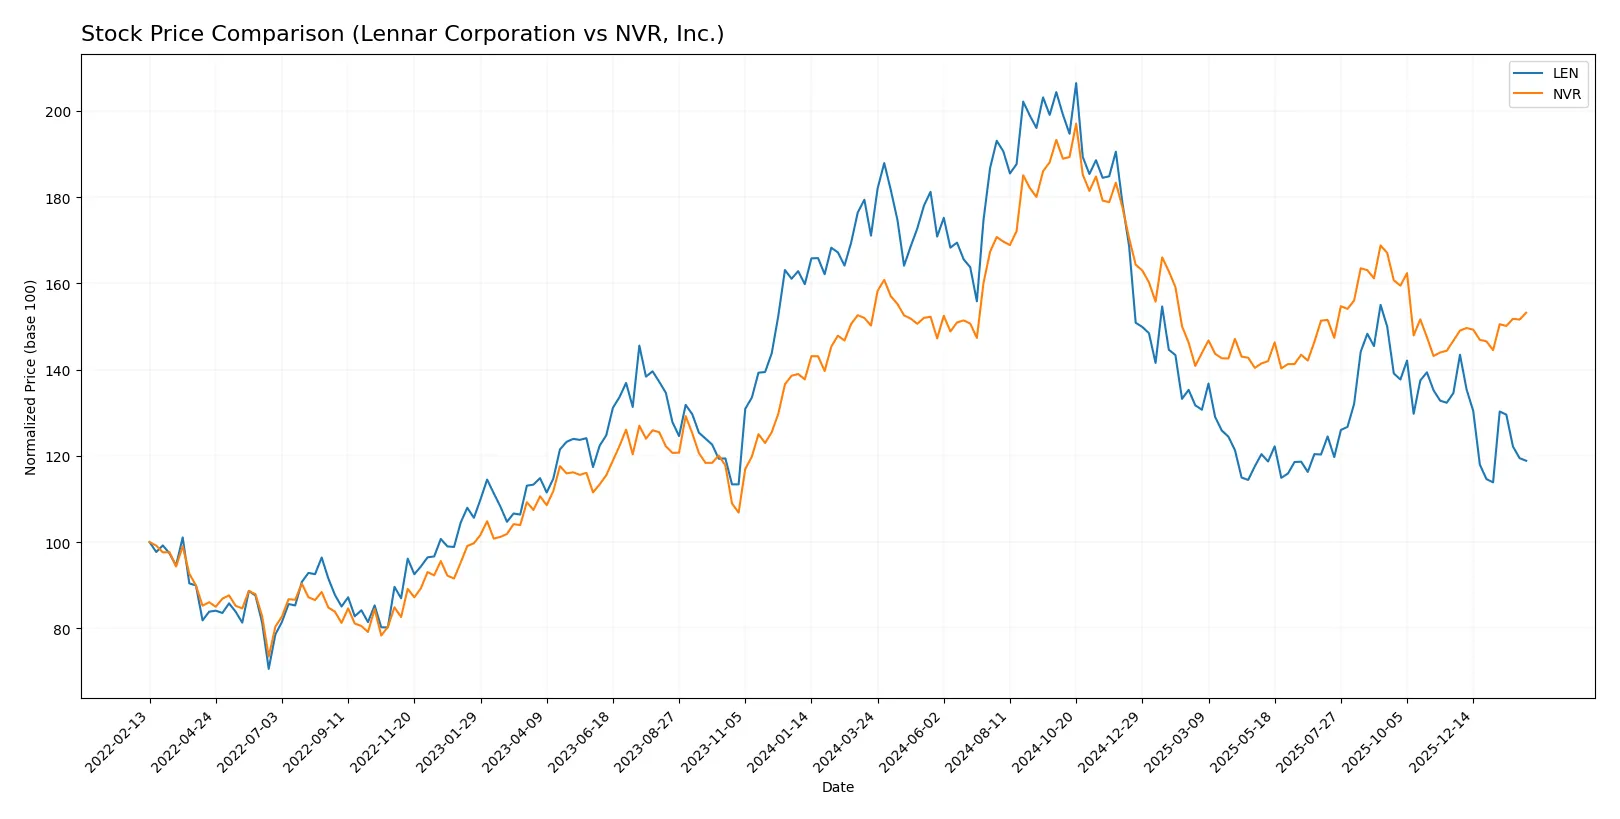
Trend Comparison
Lennar Corporation’s stock declined 30.51% over the past year, marking a bearish trend with deceleration and a high volatility of 25.93. The highest price hit 188.93, while the lowest fell to 104.22.
NVR, Inc.’s stock posted a 1.99% rise, indicating a bullish trend with acceleration despite extreme volatility at 726.33. Its price ranged from 7,066.39 to 9,924.4, showing strong upward momentum.
NVR delivered the highest market performance with a slight gain, contrasting Lennar’s significant loss, highlighting divergent investor confidence in their futures.
Target Prices
Analysts present a clear target price consensus for Lennar Corporation and NVR, Inc., reflecting confident expectations.
| Company | Target Low | Target High | Consensus |
|---|---|---|---|
| Lennar Corporation | 88 | 140 | 106.88 |
| NVR, Inc. | 8,350 | 9,022 | 8,686 |
Lennar’s consensus target of $106.88 is slightly below its current price of $108.8, suggesting limited upside. NVR’s target consensus of $8,686 significantly exceeds its current $7,716.79 share price, indicating robust growth expectations.

Don’t Let Luck Decide Your Entry Point
Optimize your entry points with our advanced ProRealTime indicators. You’ll get efficient buy signals with precise price targets for maximum performance. Start outperforming now!
How do institutions grade them?
Lennar Corporation Grades
Here are the recent grades from major institutions for Lennar Corporation:
| Grading Company | Action | New Grade | Date |
|---|---|---|---|
| Citigroup | Maintain | Neutral | 2026-01-08 |
| Citizens | Downgrade | Market Perform | 2026-01-07 |
| Wells Fargo | Maintain | Equal Weight | 2026-01-06 |
| UBS | Downgrade | Neutral | 2026-01-06 |
| Wells Fargo | Maintain | Equal Weight | 2025-12-18 |
| Keefe, Bruyette & Woods | Maintain | Market Perform | 2025-12-18 |
| B of A Securities | Downgrade | Underperform | 2025-12-18 |
| Evercore ISI Group | Downgrade | Underperform | 2025-12-18 |
| UBS | Maintain | Buy | 2025-12-18 |
| RBC Capital | Downgrade | Underperform | 2025-12-18 |
NVR, Inc. Grades
Below are the recent institutional grades for NVR, Inc.:
| Grading Company | Action | New Grade | Date |
|---|---|---|---|
| Zelman & Assoc | Upgrade | Hold | 2026-01-29 |
| UBS | Maintain | Neutral | 2026-01-06 |
| UBS | Maintain | Neutral | 2025-10-23 |
| B of A Securities | Maintain | Buy | 2025-10-10 |
| UBS | Maintain | Neutral | 2025-07-24 |
| JP Morgan | Maintain | Neutral | 2025-07-24 |
| UBS | Maintain | Neutral | 2025-04-23 |
| UBS | Maintain | Neutral | 2025-01-29 |
| JP Morgan | Maintain | Neutral | 2025-01-29 |
| UBS | Maintain | Neutral | 2025-01-08 |
Which company has the best grades?
NVR, Inc. holds a more favorable grade profile with consistent Neutral and Buy ratings and recent upgrades. Lennar shows multiple downgrades to Underperform, signaling cautious sentiment that may concern investors.
Risks specific to each company
The following categories identify the critical pressure points and systemic threats facing both firms in the 2026 market environment:
1. Market & Competition
Lennar Corporation
- Faces intense competition in regional U.S. markets with a broad product range targeting diverse buyer segments.
NVR, Inc.
- Operates in competitive mid-Atlantic and Eastern U.S. markets but with a narrower geographic focus.
2. Capital Structure & Debt
Lennar Corporation
- Maintains a conservative debt-to-equity ratio at 0.29, indicating moderate leverage and strong interest coverage.
NVR, Inc.
- Reports no debt, presenting a very low financial risk profile on leverage metrics.
3. Stock Volatility
Lennar Corporation
- Exhibits higher beta at 1.46, signaling greater sensitivity to market swings and cyclical risks.
NVR, Inc.
- Demonstrates lower beta near 1.01, implying more stable stock price movements relative to the market.
4. Regulatory & Legal
Lennar Corporation
- Subject to typical residential construction regulations and financing compliance across multiple states.
NVR, Inc.
- Faces similar regulatory frameworks, but concentrated in fewer states, potentially lowering regulatory complexity.
5. Supply Chain & Operations
Lennar Corporation
- Operates through multiple segments, increasing exposure to supply chain disruptions across varied regions.
NVR, Inc.
- More focused homebuilding operations reduce supply chain complexity but increase regional dependency risks.
6. ESG & Climate Transition
Lennar Corporation
- Gradual ESG integration with moderate focus on sustainability in large-scale development projects.
NVR, Inc.
- ESG data limited; risk of lagging peers in climate transition efforts.
7. Geopolitical Exposure
Lennar Corporation
- Primarily U.S.-focused, minimizing international geopolitical risks but vulnerable to domestic policy shifts.
NVR, Inc.
- Also U.S.-centric, with geographic concentration that could amplify localized economic or policy shocks.
Which company shows a better risk-adjusted profile?
Lennar’s moderate leverage and diversified operations balance its higher stock volatility risk. NVR’s zero debt and lower volatility reduce financial risk but expose it to concentrated geographic and operational dependencies. Lennar’s strong Altman Z-score (3.95) confirms financial resilience. NVR lacks updated Z-score data, adding uncertainty. Overall, Lennar presents a slightly better risk-adjusted profile given its financial stability and diversified footprint.
Final Verdict: Which stock to choose?
Lennar Corporation’s superpower lies in its robust balance sheet and strong liquidity position. It maintains a solid current ratio and manageable debt levels, providing a cushion in volatile markets. However, its declining profitability and value destruction signal a clear point of vigilance. Lennar suits investors seeking exposure in cyclical housing markets with an aggressive growth appetite.
NVR, Inc. stands out with a durable strategic moat driven by efficient asset utilization and impressive net margins. Its conservative leverage and consistent free cash flow add a layer of safety compared to Lennar. Though some metrics are incomplete, NVR fits well in growth-at-a-reasonable-price (GARP) portfolios favoring stability alongside growth.
If you prioritize capital preservation and consistent profitability, NVR offers better stability with its moat and margin profile. However, if you seek cyclical growth with a strong liquidity buffer and can tolerate profit pressure, Lennar might present compelling upside. Both require careful risk management given their sector’s sensitivity to economic cycles.
Disclaimer: Investment carries a risk of loss of initial capital. The past performance is not a reliable indicator of future results. Be sure to understand risks before making an investment decision.
Go Further
I encourage you to read the complete analyses of Lennar Corporation and NVR, Inc. to enhance your investment decisions: