Home > Comparison > Technology > WIT vs LDOS
The strategic rivalry between Wipro Limited and Leidos Holdings, Inc. shapes the evolution of the global technology services sector. Wipro operates as a diversified IT services and consulting powerhouse with a broad international reach. Leidos specializes in defense solutions and critical government IT services, focusing on high-stakes national security markets. This analysis contrasts their distinct operational models to identify which company offers superior risk-adjusted returns for a balanced, diversified portfolio.
Table of contents
Companies Overview
Wipro Limited and Leidos Holdings stand as pivotal players shaping the global IT services landscape with distinct market approaches.
Wipro Limited: Global IT Services and Consulting Powerhouse
Wipro Limited leads as an information technology services provider with a vast portfolio spanning IT consulting, digital strategy, and business process services. Its core revenue stems from IT services delivered worldwide, including cloud, analytics, and custom application development. In 2026, it sharpens focus on expanding digital transformation and cloud-based solutions across diverse industries, emphasizing innovation and scale in emerging markets.
Leidos Holdings, Inc.: Defense and Civil IT Solutions Specialist
Leidos dominates the defense and civil IT services sector, specializing in national security, health, and civil government markets. Its revenue engine relies on delivering integrated technology solutions ranging from cybersecurity to large-scale systems integration for U.S. government agencies. In 2026, Leidos prioritizes advanced defense solutions and health IT modernization, capitalizing on government contracts and technology-led mission support.
Strategic Collision: Similarities & Divergences
Wipro and Leidos embody contrasting philosophies: Wipro embraces a broad global IT services model targeting commercial sectors, while Leidos focuses on specialized government and defense contracts. Their competitive battleground lies in advanced technology integration and cybersecurity services, albeit addressing different clientele. Investors face distinct profiles: Wipro offers scale-driven growth across industries, Leidos delivers niche expertise tied to stable government spending.
Income Statement Comparison
This data dissects the core profitability and scalability of both corporate engines to reveal who dominates the bottom line:
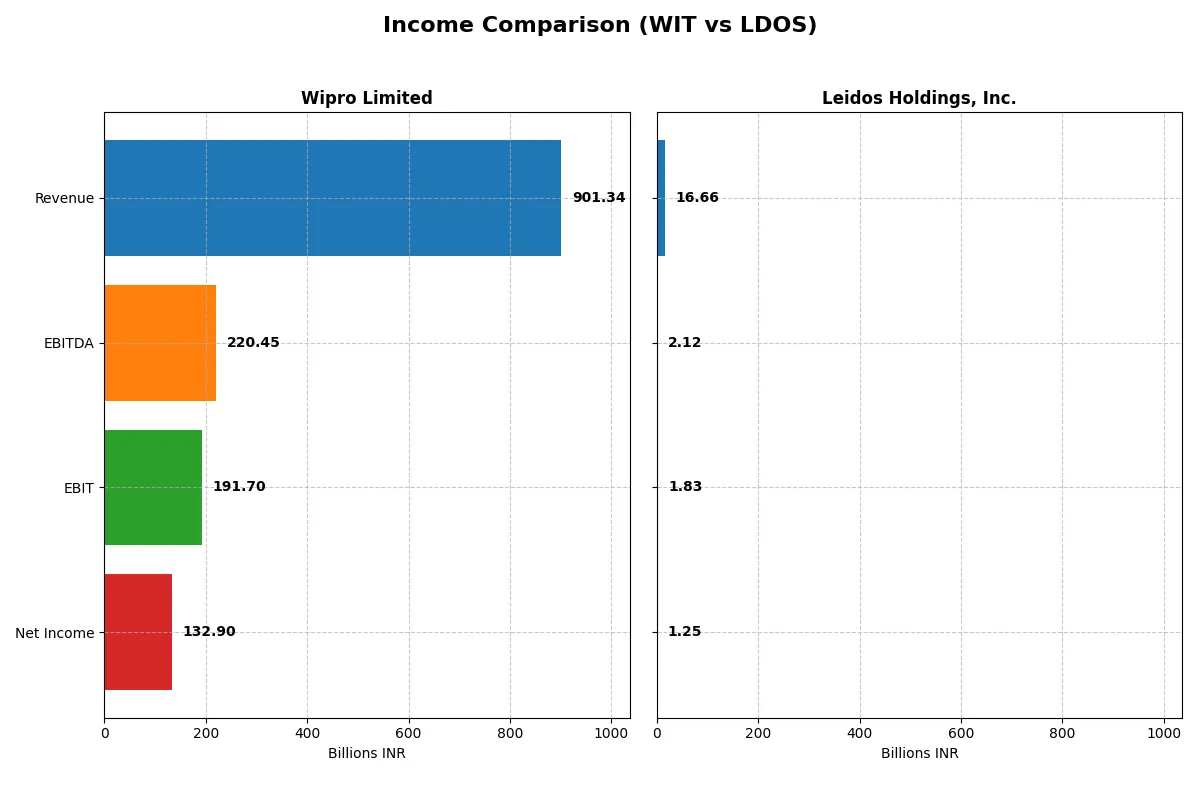
| Metric | Wipro Limited (WIT) | Leidos Holdings, Inc. (LDOS) |
|---|---|---|
| Revenue | 901.3B INR | 16.7B USD |
| Cost of Revenue | 625.1B INR | 13.9B USD |
| Operating Expenses | 122.7B INR | 971M USD |
| Gross Profit | 276.3B INR | 2.8B USD |
| EBITDA | 220.5B INR | 2.1B USD |
| EBIT | 191.7B INR | 1.8B USD |
| Interest Expense | 14.9B INR | 193M USD |
| Net Income | 132.9B INR | 1.3B USD |
| EPS | 12.56 INR | 9.36 USD |
| Fiscal Year | 2025 | 2024 |
Income Statement Analysis: The Bottom-Line Duel
This income statement comparison reveals how efficiently Wipro Limited and Leidos Holdings, Inc. convert revenue into profit and sustain margin strength.
Wipro Limited Analysis
Wipro’s revenue has grown 47% over five years but dipped slightly by 0.24% in the latest year. Gross profit and net income rose steadily, with a 3.14% gross profit increase and a 19.8% net margin improvement last year. The company maintains healthy gross (30.65%) and net margins (14.74%), reflecting strong operational efficiency and margin resilience.
Leidos Holdings, Inc. Analysis
Leidos posted a 35.5% revenue increase over five years and a 7.93% uptick in the last year. Its gross margin is lower at 16.79%, but EBIT (11%) and net margins (7.53%) remain favorable. Recent net income surged by nearly 484% and EPS by 540%, signaling accelerating profitability and operational leverage despite a moderate revenue scale.
Margin Strength vs. Earnings Momentum
Wipro commands superior margins and a larger revenue base, delivering consistent profitability with solid growth in net income and EPS. Leidos impresses with explosive net income and EPS growth, albeit from a smaller scale and thinner gross margins. Investors seeking stable margin power may favor Wipro, while those targeting rapid earnings momentum could find Leidos more attractive.
Financial Ratios Comparison
These vital ratios act as a diagnostic tool to expose the underlying fiscal health, valuation premiums, and capital efficiency of the companies compared below:
| Ratios | Wipro Limited (WIT) | Leidos Holdings, Inc. (LDOS) |
|---|---|---|
| ROE | 16.0% | 28.4% |
| ROIC | 10.5% | 13.9% |
| P/E | 20.6 | 15.7 |
| P/B | 3.3 | 4.5 |
| Current Ratio | 2.72 | 1.21 |
| Quick Ratio | 2.71 | 1.13 |
| D/E (Debt-to-Equity) | 0.23 | 1.20 |
| Debt-to-Assets | 15.0% | 40.4% |
| Interest Coverage | 10.3 | 9.5 |
| Asset Turnover | 0.70 | 1.27 |
| Fixed Asset Turnover | 8.48 | 10.7 |
| Payout ratio | 47.2% | 16.6% |
| Dividend yield | 2.29% | 1.05% |
| Fiscal Year | 2025 | 2024 |
Efficiency & Valuation Duel: The Vital Signs
Ratios serve as a company’s DNA, unveiling hidden risks and operational strengths that raw numbers alone cannot reveal.
Wipro Limited
Wipro posts a solid 16.04% ROE and a favorable 14.74% net margin, reflecting efficient profitability. Its P/E of 20.6 signals a neutral valuation, though a high P/B of 3.3 is less attractive. The company returns value with a 2.29% dividend yield, balancing shareholder payouts and reinvestment for growth.
Leidos Holdings, Inc.
Leidos delivers an impressive 28.42% ROE but a modest 7.53% net margin, indicating high shareholder returns despite lean profitability. Its P/E of 15.72 suggests a fair valuation, yet a 4.47 P/B and 1.2 debt-to-equity ratio flag leverage risks. Dividend yield stands at a moderate 1.05%, with steady reinvestment.
Operational Strength vs. Financial Leverage
Wipro offers a balanced risk profile with strong operational metrics and prudent leverage, while Leidos excels in ROE but carries higher debt risks. Investors seeking operational safety may prefer Wipro, whereas those targeting aggressive returns might consider Leidos’s growth potential.
Which one offers the Superior Shareholder Reward?
I compare Wipro Limited (WIT) and Leidos Holdings, Inc. (LDOS) on dividends, payout ratios, and buybacks. WIT yields 2.29% with a 47% payout ratio, supported by strong free cash flow coverage above 90%. Its buyback program is modest but consistent, emphasizing sustainable shareholder returns. LDOS yields 1.05% with a 16.6% payout ratio, also backed by solid free cash flow, but carries heavier debt and weaker operating margins. LDOS’ buybacks are less emphasized, reflecting caution amid leverage. I see Wipro’s balanced, well-covered dividends and steady buybacks as a more durable and attractive total return model in 2026.
Comparative Score Analysis: The Strategic Profile
The radar chart reveals the fundamental DNA and trade-offs of Wipro Limited and Leidos Holdings, Inc., highlighting their financial strengths and vulnerabilities side by side:
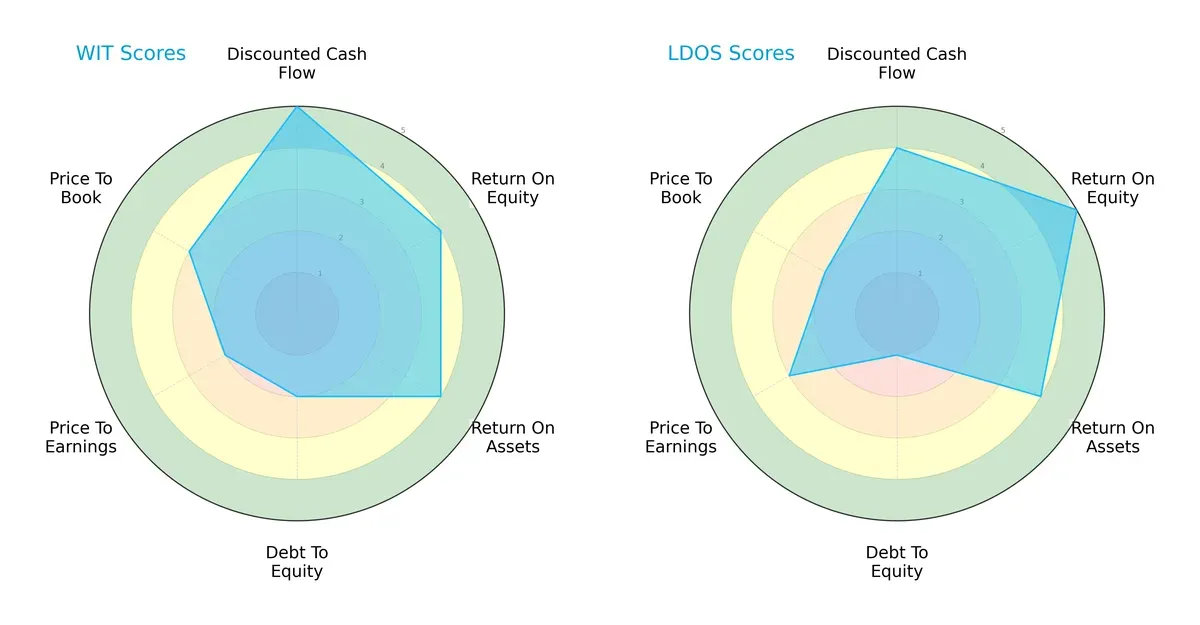
Wipro demonstrates a more balanced profile with strong discounted cash flow (5) and solid returns on equity (4) and assets (4). However, it carries moderate debt and valuation risks (scores 2 and 3). Leidos leans heavily on an exceptional ROE (5) but shows weaker debt management (1) and slightly less favorable valuation scores. Wipro’s diversified edge contrasts with Leidos’ reliance on operational efficiency.
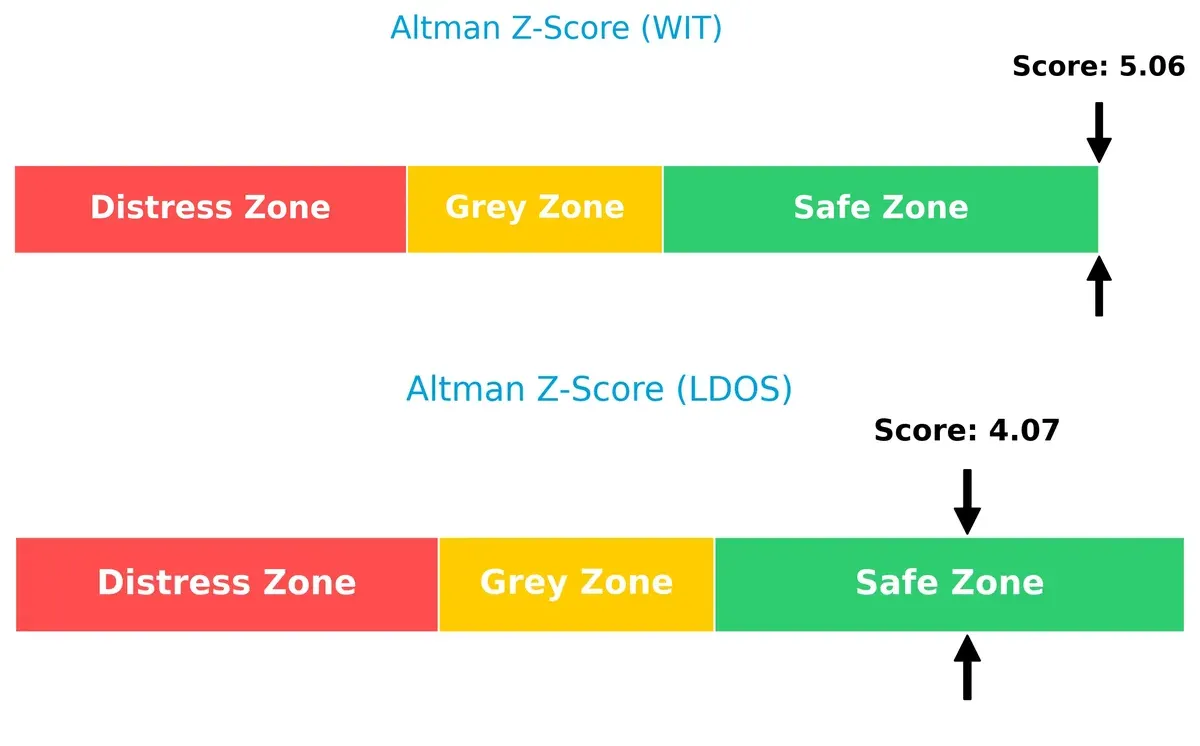
Bankruptcy Risk: Solvency Showdown
Wipro’s Altman Z-Score of 5.06 surpasses Leidos’ 4.07, both safely above the distress threshold, signaling robust long-term solvency in this cycle:
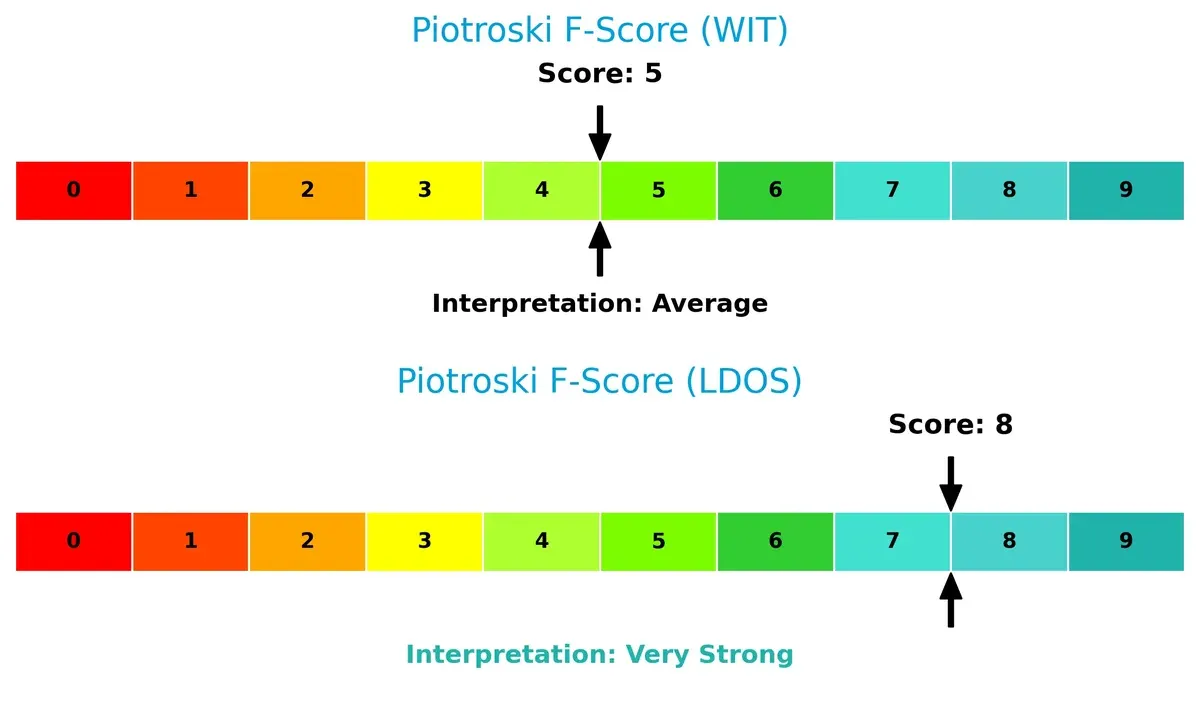
Financial Health: Quality of Operations
Leidos’ Piotroski F-Score of 8 indicates strong internal financial health, outperforming Wipro’s average score of 5. This suggests Leidos maintains superior operational quality and fewer red flags:
How are the two companies positioned?
This section dissects WIT and LDOS’s operational DNA by comparing revenue distribution and internal dynamics—strengths and weaknesses. The goal: confront their economic moats to identify which model offers the most resilient, sustainable competitive advantage today.
Revenue Segmentation: The Strategic Mix
This visual comparison dissects how Wipro Limited and Leidos Holdings diversify their income streams and where their primary sector bets lie:
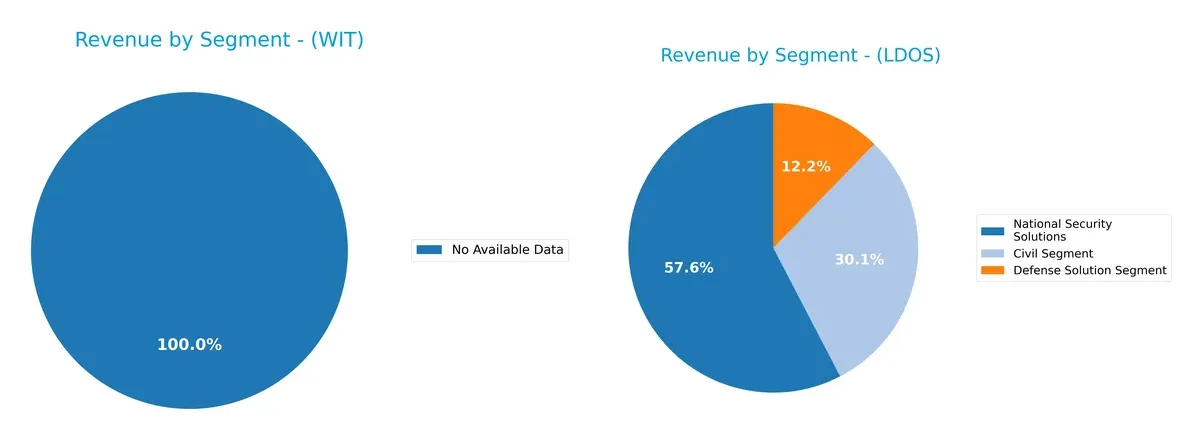
Wipro lacks segment data, so I cannot assess its revenue mix. Leidos anchors its revenue in National Security Solutions at $9.55B, with Civil and Defense segments at $5B and $2B respectively in 2024. This concentration signals a strong defense and government services moat, but also exposes Leidos to sector-specific risks. Its diversified Civil and Defense segments mitigate some dependency on a single government contract stream.
Strengths and Weaknesses Comparison
This table compares the Strengths and Weaknesses of Wipro Limited and Leidos Holdings, Inc.:
Wipro Limited Strengths
- Very favorable financial ratios with strong profitability
- Low debt-to-equity and debt-to-assets ratios signal financial stability
- High current and quick ratios indicate excellent liquidity
Leidos Holdings Strengths
- Favorable ROE and ROIC show efficient capital allocation
- Strong asset turnover and fixed asset turnover reflect operational efficiency
- Diversified revenue streams across multiple defense and civil segments
Wipro Limited Weaknesses
- Unfavorable price-to-book ratio suggests possible market undervaluation
- Neutral price-to-earnings ratio may limit growth expectations
- Neutral asset turnover points to moderate operational efficiency
Leidos Holdings Weaknesses
- High debt-to-equity ratio raises financial leverage concerns
- Neutral current ratio indicates moderate liquidity risk
- Unfavorable price-to-book ratio and lower dividend yield may reduce investor appeal
Wipro exhibits robust financial health and liquidity, supporting a conservative strategy. Leidos shows operational strength but carries higher leverage, which may influence risk management and capital structure decisions.
The Moat Duel: Analyzing Competitive Defensibility
A structural moat is the only reliable shield protecting long-term profits from relentless competition erosion. Here’s how two tech service leaders compare:
Wipro Limited: Cost Advantage with Margin Stability
Wipro leverages a cost advantage, reflected in steady 21% EBIT margins and 15% net margins. Despite a 25% ROIC decline trend, it remains value-creative. Expansion into cloud and digital advisory in 2026 may reinforce this moat.
Leidos Holdings, Inc.: Defense-Driven Economic Moat
Leidos commands a defense-centric moat, delivering a strong 7.9% ROIC premium over WACC with rising profitability. Its niche in national security and health markets fuels 11% EBIT margins and rapid earnings growth, suggesting moat deepening in 2026.
Cost Efficiency vs. Specialized Contractual Strength
Leidos holds the deeper moat, driven by durable ROIC growth and niche government contracts. Wipro creates value but faces pressure on profitability. Leidos is better positioned to defend market share amid evolving tech demands.
Which stock offers better returns?
The past year reveals contrasting dynamics: Wipro Limited’s stock declined steadily while Leidos Holdings, Inc. surged significantly, reflecting divergent investor sentiment and market momentum.
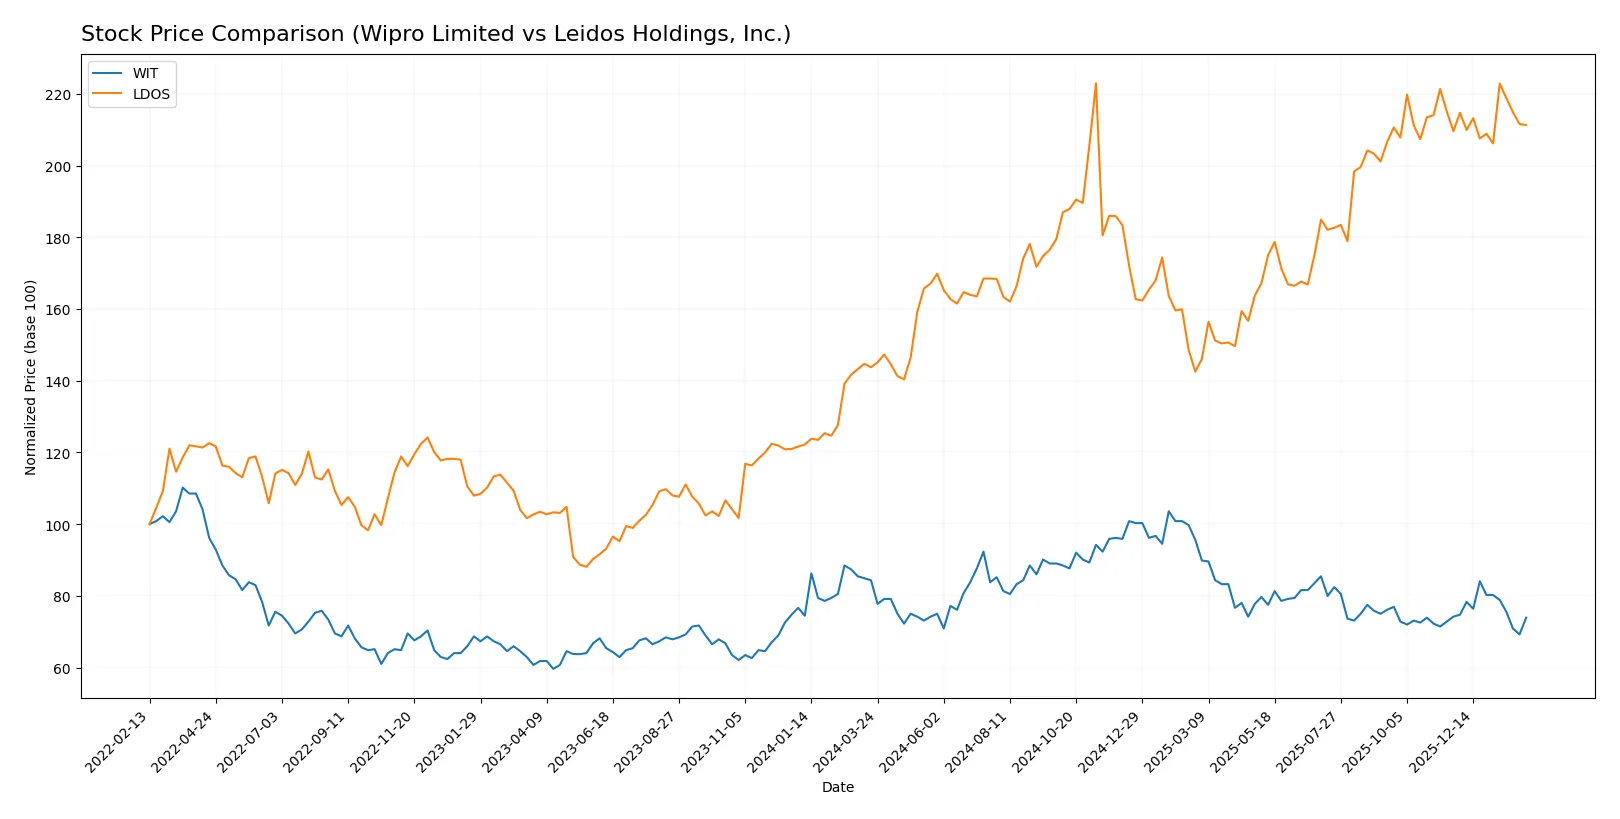
Trend Comparison
Wipro Limited’s stock fell 12.38% over the last 12 months, marking a clear bearish trend with deceleration and moderate volatility (std dev 0.31). The price peaked at 3.77 and bottomed at 2.52.
Leidos Holdings, Inc. gained 47.0% during the same period, indicating a strong bullish trend despite deceleration. Price volatility is high (std dev 20.65), with a high of 198.42 and a low of 124.91.
Leidos Holdings outperformed Wipro substantially, delivering the highest market return with a robust upward trajectory over the past year.
Target Prices
Analysts present a bullish consensus on both Wipro Limited and Leidos Holdings, Inc.
| Company | Target Low | Target High | Consensus |
|---|---|---|---|
| Wipro Limited | 7.0 | 7.7 | 7.35 |
| Leidos Holdings, Inc. | 204 | 230 | 219.8 |
Wipro’s target consensus exceeds its current $2.69 price, signaling strong upside potential. Leidos also trades well below its $188 current price, suggesting room for appreciation.

Don’t Let Luck Decide Your Entry Point
Optimize your entry points with our advanced ProRealTime indicators. You’ll get efficient buy signals with precise price targets for maximum performance. Start outperforming now!
How do institutions grade them?
The following tables summarize recent institutional grades for Wipro Limited and Leidos Holdings, Inc.:
Wipro Limited Grades
This table lists recent grade changes and actions for Wipro Limited by major institutions.
| Grading Company | Action | New Grade | Date |
|---|---|---|---|
| UBS | Upgrade | Neutral | 2025-01-02 |
| Wedbush | Maintain | Underperform | 2024-01-16 |
| JP Morgan | Maintain | Underweight | 2023-05-24 |
| Bernstein | Downgrade | Underperform | 2023-03-22 |
| Bernstein | Downgrade | Underperform | 2023-03-21 |
| Goldman Sachs | Upgrade | Buy | 2022-09-13 |
| Goldman Sachs | Upgrade | Buy | 2022-09-12 |
| Morgan Stanley | Downgrade | Underweight | 2022-07-14 |
| Morgan Stanley | Downgrade | Underweight | 2022-07-13 |
| Macquarie | Upgrade | Outperform | 2022-06-02 |
Leidos Holdings, Inc. Grades
This table shows recent institutional grades and changes for Leidos Holdings, Inc.
| Grading Company | Action | New Grade | Date |
|---|---|---|---|
| UBS | Maintain | Neutral | 2026-01-15 |
| Citigroup | Maintain | Buy | 2026-01-13 |
| Stifel | Downgrade | Hold | 2026-01-08 |
| B of A Securities | Maintain | Buy | 2025-11-07 |
| Truist Securities | Maintain | Buy | 2025-11-05 |
| UBS | Maintain | Neutral | 2025-11-05 |
| Cantor Fitzgerald | Maintain | Overweight | 2025-10-31 |
| Argus Research | Maintain | Buy | 2025-09-24 |
| RBC Capital | Upgrade | Outperform | 2025-09-04 |
| B of A Securities | Maintain | Buy | 2025-09-04 |
Which company has the best grades?
Leidos Holdings, Inc. consistently holds Buy or better grades, including recent upgrades to Outperform. Wipro Limited shows mixed grades with recent Neutral and Underperform ratings despite prior Buy upgrades. Investors may interpret Leidos as receiving stronger institutional confidence.
Risks specific to each company
The following categories identify the critical pressure points and systemic threats facing both firms in the 2026 market environment:
1. Market & Competition
Wipro Limited
- Faces intense competition in global IT services and digital transformation, with strong pressure from emerging tech firms.
Leidos Holdings, Inc.
- Operates in defense and civil markets with high barriers but must navigate competitive government contracts and fast tech evolution.
2. Capital Structure & Debt
Wipro Limited
- Maintains a low debt-to-equity ratio (0.23), indicating conservative leverage and solid financial stability.
Leidos Holdings, Inc.
- Carries higher leverage (debt-to-equity 1.2), increasing financial risk and interest burden despite strong coverage ratios.
3. Stock Volatility
Wipro Limited
- Exhibits low beta (0.555), reflecting lower volatility and defensive qualities in turbulent markets.
Leidos Holdings, Inc.
- Slightly higher beta (0.592) still suggests moderate volatility, aligned with its sector’s defense exposure.
4. Regulatory & Legal
Wipro Limited
- Must comply with diverse international regulations, particularly in India’s government contracts sector.
Leidos Holdings, Inc.
- Faces stringent U.S. defense regulations and export controls, with risks of compliance impacting contracts.
5. Supply Chain & Operations
Wipro Limited
- Global delivery model depends on stable offshore operations and technology infrastructure resilience.
Leidos Holdings, Inc.
- Relies on secure, timely delivery of complex defense systems, vulnerable to operational disruptions and cyber threats.
6. ESG & Climate Transition
Wipro Limited
- Increasing pressure to improve sustainability practices amid global client demand for green IT solutions.
Leidos Holdings, Inc.
- Focuses on environment and energy services, needing to balance defense priorities with evolving ESG standards.
7. Geopolitical Exposure
Wipro Limited
- Sensitive to geopolitical tensions affecting outsourcing and India-centric government business.
Leidos Holdings, Inc.
- Highly exposed to U.S. geopolitical defense alliances and global security dynamics influencing contract flow.
Which company shows a better risk-adjusted profile?
Wipro’s strongest risk is increasing global competition and dependence on India’s government contracts. Leidos faces significant financial risk from its high leverage and geopolitical defense exposure. Wipro’s low debt and stable liquidity grant it a more favorable risk-adjusted profile. Its Altman Z-score of 5.06 confirms robust financial health versus Leidos’s 4.07. The rising debt-to-equity ratio at Leidos signals caution despite its strong Piotroski score, justifying deeper scrutiny of its capital structure.
Final Verdict: Which stock to choose?
Wipro Limited’s superpower lies in its robust capital efficiency and strong balance sheet, reflected in its ability to generate consistent free cash flow. Its declining ROIC trend, however, remains a point of vigilance, signaling potential margin pressures ahead. This stock suits portfolios seeking steady, long-term growth with moderate risk tolerance.
Leidos Holdings boasts a durable competitive moat, backed by a rising ROIC and solid operational momentum. Its strategic advantage in defense and technology services offers recurring revenue stability. Relative to Wipro, Leidos carries higher debt, which investors should monitor. It fits well within GARP portfolios aiming for growth balanced with reasonable valuation.
If you prioritize resilient cash generation and financial stability, Wipro appears compelling due to its conservative leverage and favorable margin profile. However, if your focus is on stronger growth potential with an expanding competitive edge, Leidos offers better upside, albeit with elevated financial risk. Both present viable but distinct investment scenarios aligned with different risk appetites.
Disclaimer: Investment carries a risk of loss of initial capital. The past performance is not a reliable indicator of future results. Be sure to understand risks before making an investment decision.
Go Further
I encourage you to read the complete analyses of Wipro Limited and Leidos Holdings, Inc. to enhance your investment decisions: