In the dynamic semiconductor sector, Tower Semiconductor Ltd. (TSEM) and Lattice Semiconductor Corporation (LSCC) stand out as innovative players shaping the industry’s future. Tower focuses on analog and mixed-signal foundry services, while Lattice specializes in field programmable gate arrays and connectivity solutions. Their overlapping markets and distinct innovation strategies make this comparison essential. Join me as we analyze which company presents the most compelling investment opportunity for your portfolio.
Table of contents
Companies Overview
I will begin the comparison between Tower Semiconductor Ltd. and Lattice Semiconductor Corporation by providing an overview of these two companies and their main differences.
Tower Semiconductor Ltd. Overview
Tower Semiconductor Ltd. is an independent semiconductor foundry specializing in analog intensive mixed-signal semiconductor devices. It offers customizable process technologies like SiGe, BiCMOS, RF CMOS, and MEMS, serving diverse markets including automotive, industrial, aerospace, and medical devices. Founded in 1993 and headquartered in Migdal Haemek, Israel, Tower operates globally with a market cap of about 13.9B USD.
Lattice Semiconductor Corporation Overview
Lattice Semiconductor Corporation develops and sells semiconductor products, primarily field programmable gate arrays and video connectivity solutions. It serves original equipment manufacturers in communications, computing, consumer, industrial, and automotive markets. Incorporated in 1983 and based in Hillsboro, Oregon, Lattice has a market cap of approximately 11.7B USD and emphasizes technology licensing alongside product sales.
Key similarities and differences
Both companies operate in the semiconductor industry and trade on NASDAQ Global Select, focusing on technology innovation. Tower concentrates on foundry services and analog mixed-signal devices, while Lattice specializes in programmable gate arrays and IP licensing. Tower is larger by market capitalization and employee count, whereas Lattice has a higher beta, indicating greater stock price volatility.
Income Statement Comparison
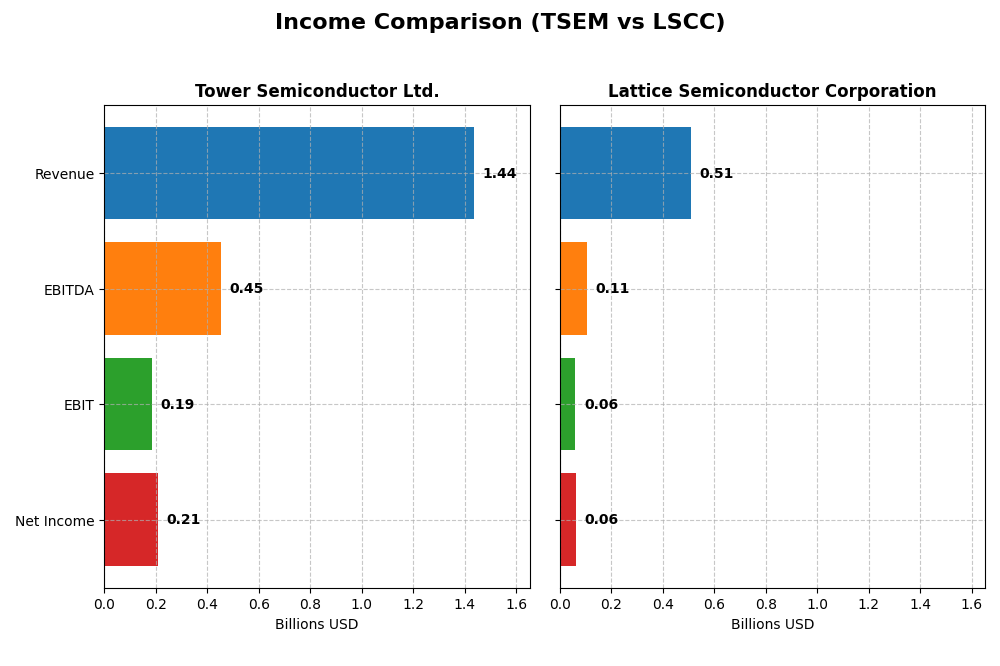
This table presents a side-by-side comparison of key income statement metrics for Tower Semiconductor Ltd. and Lattice Semiconductor Corporation for the fiscal year 2024.
| Metric | Tower Semiconductor Ltd. | Lattice Semiconductor Corporation |
|---|---|---|
| Market Cap | 13.9B | 11.7B |
| Revenue | 1.44B | 509M |
| EBITDA | 451M | 107M |
| EBIT | 185M | 61M |
| Net Income | 208M | 61M |
| EPS | 1.87 | 0.44 |
| Fiscal Year | 2024 | 2024 |
Income Statement Interpretations
Tower Semiconductor Ltd.
Tower Semiconductor’s revenue displayed a moderate overall growth of 13.47% from 2020 to 2024, with net income increasing significantly by 152.56% over the same period. Margins such as gross (23.64%) and net margin (14.47%) were consistently favorable. However, in 2024, revenue growth slowed to 0.94%, with declining gross profit and a sharp drop in EBIT, indicating margin compression and earnings pressure.
Lattice Semiconductor Corporation
Lattice Semiconductor experienced stronger revenue growth overall at 24.82% from 2020 to 2024, with net income rising 28.99%. Its gross margin remained very favorable at 66.82%, although net margin was slightly lower at 12.0%. The latest fiscal year saw a 30.9% revenue decline and a 71.67% drop in EBIT, highlighting a significant contraction in profitability and operational challenges.
Which one has the stronger fundamentals?
Both companies show favorable long-term income statement trends, but Tower Semiconductor demonstrates higher net income growth and margin expansion over five years. Lattice has a superior gross margin but suffered a sharper recent revenue and earnings decline. Overall, Tower Semiconductor’s fundamentals appear more resilient despite recent challenges, while Lattice faces greater short-term volatility.
Financial Ratios Comparison
The table below presents key financial ratios for Tower Semiconductor Ltd. (TSEM) and Lattice Semiconductor Corporation (LSCC) based on their most recent fiscal year data, allowing for a straightforward comparison.
| Ratios | Tower Semiconductor Ltd. (TSEM) | Lattice Semiconductor Corporation (LSCC) |
|---|---|---|
| ROE | 7.83% | 8.60% |
| ROIC | 6.41% | 4.59% |
| P/E | 27.54 | 132.74 |
| P/B | 2.16 | 11.41 |
| Current Ratio | 6.18 | 3.66 |
| Quick Ratio | 5.23 | 2.62 |
| D/E | 0.068 | 0.021 |
| Debt-to-Assets | 5.87% | 1.81% |
| Interest Coverage | 32.64 | 129.54 |
| Asset Turnover | 0.47 | 0.60 |
| Fixed Asset Turnover | 1.11 | 7.62 |
| Payout ratio | 0 | 0 |
| Dividend yield | 0 | 0 |
Interpretation of the Ratios
Tower Semiconductor Ltd.
Tower Semiconductor shows a mixed ratio profile with a slightly favorable overall rating. Its net margin of 14.47% is strong but return on equity at 7.83% is weak, suggesting moderate profitability. The company’s current ratio is unusually high at 6.18, which is unfavorable and may indicate excess liquidity. It does not pay dividends, likely prioritizing reinvestment or growth strategies over shareholder payouts.
Lattice Semiconductor Corporation
Lattice Semiconductor has a slightly unfavorable ratio profile overall, despite strong interest coverage and low debt levels. The net margin at 12.0% and return on equity at 8.6% are modest but overshadowed by a high PE ratio of 132.74 and a price-to-book ratio of 11.41, both unfavorable. Like Tower, Lattice does not pay dividends, possibly focusing on R&D and expansion instead.
Which one has the best ratios?
Comparing both, Tower Semiconductor’s ratios are marginally better overall with a slightly favorable rating, whereas Lattice Semiconductor faces more unfavorable metrics, especially valuation multiples. However, each company exhibits strengths and weaknesses, with neither standing out as definitively superior across all financial ratios.
Strategic Positioning
This section compares the strategic positioning of Tower Semiconductor Ltd. and Lattice Semiconductor Corporation, including Market position, Key segments, and Exposure to technological disruption:
Tower Semiconductor Ltd.
- Independent foundry with $13.9B market cap, moderate beta 0.88, serving diverse global markets.
- Serves multiple markets: consumer electronics, automotive, industrial, aerospace, and medical.
- Offers customizable semiconductor processes; no explicit disruption exposure detailed.
Lattice Semiconductor Corporation
- $11.7B market cap, higher beta 1.72, focused on FPGA products with global reach.
- Concentrated on FPGA families and video connectivity, mainly for communications and computing.
- Provides IP licensing and patent monetization, indicating some exposure to technological shifts.
Tower Semiconductor Ltd. vs Lattice Semiconductor Corporation Positioning
Tower Semiconductor takes a diversified approach across semiconductor manufacturing and various industries, while Lattice specializes in FPGA products and IP services. Tower’s broad market presence contrasts with Lattice’s focused business segments, reflecting different strategic scopes and operational scale.
Which has the best competitive advantage?
Tower Semiconductor shows a slightly unfavorable moat with growing profitability, whereas Lattice Semiconductor faces a very unfavorable moat with declining returns, indicating Tower currently maintains a relatively stronger competitive advantage.
Stock Comparison
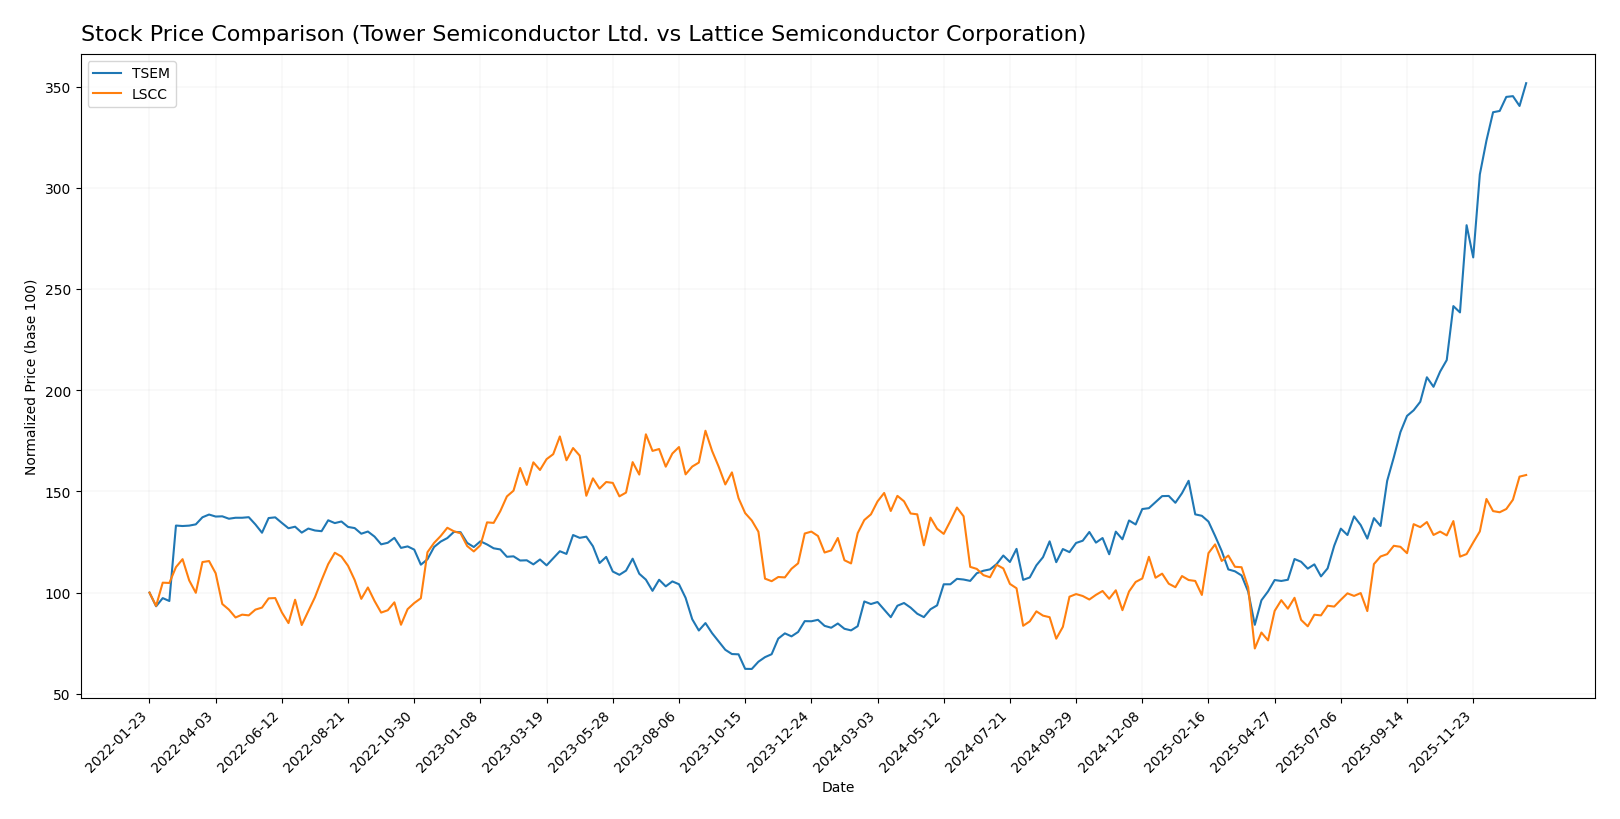
The stock price chart highlights robust bullish trends and notable price acceleration for both Tower Semiconductor Ltd. (TSEM) and Lattice Semiconductor Corporation (LSCC) over the past 12 months, reflecting dynamic trading activity.
Trend Analysis
Tower Semiconductor Ltd. (TSEM) exhibited a strong bullish trend with a 272.71% price increase over the past year, coupled with accelerating momentum and a high volatility level indicated by a 23.67 std deviation. The stock reached a peak of 124.0 and a low of 29.65.
Lattice Semiconductor Corporation (LSCC) also showed a bullish trend with a 14.02% gain in the same period, supported by acceleration but with lower volatility at an 11.01 std deviation. The stock’s high was 85.23 and low 39.03.
Comparing both, TSEM delivered the highest market performance with a substantially larger price increase and greater acceleration, surpassing LSCC in overall trend strength.
Target Prices
Analyst consensus on target prices for these semiconductor companies shows a balanced outlook with moderate upside potential.
| Company | Target High | Target Low | Consensus |
|---|---|---|---|
| Tower Semiconductor Ltd. | 125 | 66 | 96 |
| Lattice Semiconductor Corporation | 105 | 65 | 83 |
Tower Semiconductor’s consensus target price of 96 slightly undercuts its current price of 124, suggesting limited upside or potential overvaluation. Lattice Semiconductor’s consensus target of 83 is below its current trading price of 85.23, indicating cautious analyst expectations compared to market levels.
Analyst Opinions Comparison
This section compares analysts’ ratings and grades for Tower Semiconductor Ltd. (TSEM) and Lattice Semiconductor Corporation (LSCC):
Rating Comparison
TSEM Rating
- Rating: B+, classified as Very Favorable by analysts.
- Discounted Cash Flow Score: 3, indicating a moderate valuation assessment.
- ROE Score: 3, moderate efficiency in generating profit from equity.
- ROA Score: 4, favorable asset utilization for earnings.
- Debt To Equity Score: 4, favorable financial risk profile.
- Overall Score: 3, a moderate overall financial standing.
LSCC Rating
- Rating: B-, also classified as Very Favorable.
- Discounted Cash Flow Score: 3, showing a similar moderate valuation.
- ROE Score: 2, moderate but lower efficiency compared to TSEM.
- ROA Score: 3, moderate effectiveness in asset utilization.
- Debt To Equity Score: 4, also favorable, reflecting low leverage risk.
- Overall Score: 2, moderate but below TSEM’s overall score.
Which one is the best rated?
Based strictly on the provided data, TSEM is better rated overall with a higher general rating (B+ vs. B-) and stronger scores in return on equity, return on assets, and overall financial standing compared to LSCC.
Scores Comparison
The following table compares the Altman Z-Score and Piotroski Score for Tower Semiconductor Ltd. and Lattice Semiconductor Corporation:
TSEM Scores
- Altman Z-Score: 21.06, in safe zone indicating very low bankruptcy risk.
- Piotroski Score: 7, categorized as strong financial health.
LSCC Scores
- Altman Z-Score: 52.69, in safe zone indicating very low bankruptcy risk.
- Piotroski Score: 5, categorized as average financial health.
Which company has the best scores?
Based on the provided data, LSCC has a higher Altman Z-Score, suggesting stronger bankruptcy resilience, while TSEM has a higher Piotroski Score, indicating stronger overall financial health.
Grades Comparison
The following sections present the recent grades assigned by recognized grading companies for Tower Semiconductor Ltd. and Lattice Semiconductor Corporation:
Tower Semiconductor Ltd. Grades
This table summarizes the latest grades from established grading firms for Tower Semiconductor Ltd.:
| Grading Company | Action | New Grade | Date |
|---|---|---|---|
| Benchmark | Maintain | Buy | 2026-01-09 |
| Wedbush | Downgrade | Neutral | 2025-12-31 |
| Benchmark | Maintain | Buy | 2025-11-11 |
| Susquehanna | Maintain | Positive | 2025-11-11 |
| Wedbush | Maintain | Outperform | 2025-11-11 |
| Barclays | Maintain | Equal Weight | 2025-11-11 |
| Benchmark | Maintain | Buy | 2025-09-08 |
| Susquehanna | Maintain | Positive | 2025-08-05 |
| Benchmark | Maintain | Buy | 2025-08-05 |
| Benchmark | Maintain | Buy | 2025-08-04 |
Tower Semiconductor’s grades predominantly indicate a buy or positive outlook, with one notable downgrade to neutral by Wedbush near year-end 2025.
Lattice Semiconductor Corporation Grades
This table details recent grades assigned to Lattice Semiconductor Corporation by reputable grading companies:
| Grading Company | Action | New Grade | Date |
|---|---|---|---|
| Keybanc | Maintain | Overweight | 2026-01-13 |
| Stifel | Maintain | Buy | 2025-11-04 |
| Baird | Maintain | Outperform | 2025-11-04 |
| Needham | Maintain | Buy | 2025-11-04 |
| Rosenblatt | Maintain | Buy | 2025-11-04 |
| Benchmark | Maintain | Buy | 2025-11-04 |
| Susquehanna | Maintain | Positive | 2025-10-22 |
| Keybanc | Maintain | Overweight | 2025-09-30 |
| Needham | Maintain | Buy | 2025-09-22 |
| Benchmark | Maintain | Buy | 2025-09-11 |
Grades for Lattice Semiconductor show consistently strong buy and overweight recommendations with no downgrades.
Which company has the best grades?
Lattice Semiconductor Corporation has received more consistently positive grades, including multiple buy and overweight ratings, compared to Tower Semiconductor Ltd., which shows some mixed signals with a neutral downgrade. This suggests a stronger consensus positivity toward Lattice Semiconductor, potentially influencing investor confidence accordingly.
Strengths and Weaknesses
Below is a comparison table highlighting key strengths and weaknesses of Tower Semiconductor Ltd. (TSEM) and Lattice Semiconductor Corporation (LSCC) based on the most recent financial and operational data.
| Criterion | Tower Semiconductor Ltd. (TSEM) | Lattice Semiconductor Corporation (LSCC) |
|---|---|---|
| Diversification | Moderate; focused on semiconductor manufacturing with limited product range | Higher; diversified revenue streams including licensing, services, and product sales |
| Profitability | Moderate profitability with net margin at 14.47%, ROIC 6.41% (neutral) | Moderate profitability, net margin 12%, but declining ROIC at 4.59% (unfavorable) |
| Innovation | Growing ROIC trend suggests improving operational efficiency | Declining ROIC indicates challenges in maintaining competitive innovation |
| Global presence | Established global manufacturing footprint | Strong global sales and distribution network |
| Market Share | Niche player in specialty semiconductors | Larger market presence with significant distributor sales |
Key takeaways: TSEM demonstrates a slightly favorable financial profile with improving profitability despite currently shedding value, reflecting operational improvements. LSCC, while diversified and globally present, faces profitability and value destruction challenges with declining ROIC and high valuation multiples, warranting cautious consideration.
Risk Analysis
Below is a comparative table outlining key risks for Tower Semiconductor Ltd. (TSEM) and Lattice Semiconductor Corporation (LSCC) as of the most recent fiscal year:
| Metric | Tower Semiconductor Ltd. (TSEM) | Lattice Semiconductor Corporation (LSCC) |
|---|---|---|
| Market Risk | Moderate (Beta 0.88) | High (Beta 1.72) |
| Debt Level | Low (D/E 0.07, favorable) | Very Low (D/E 0.02, favorable) |
| Regulatory Risk | Moderate (Global manufacturing exposure) | Moderate (Technology IP licensing exposure) |
| Operational Risk | Moderate (Capacity and technology complexity) | Moderate (Smaller workforce, reliance on IP licensing) |
| Environmental Risk | Moderate (Manufacturing impact) | Low (Less capital-intensive manufacturing) |
| Geopolitical Risk | Elevated (Headquartered in Israel with global operations) | Moderate (US-based but global sales) |
The most impactful and likely risks relate to market volatility and regulatory factors. LSCC’s higher beta indicates greater price sensitivity to market swings, while TSEM faces geopolitical uncertainties due to its location and global supply chain. Both show low debt levels, reducing financial risk. Operationally, each company must manage technology complexity and supply chain risks carefully.
Which Stock to Choose?
Tower Semiconductor Ltd. (TSEM) shows favorable income statement metrics with a 14.47% net margin, though recent one-year profitability declined sharply. Its financial ratios are slightly favorable overall, supported by low debt and strong interest coverage, but with some weaknesses in ROE and valuation multiples. The company’s debt levels remain low, and its rating is very favorable (B+).
Lattice Semiconductor Corporation (LSCC) presents a strong gross margin of 66.82% and a favorable net margin of 12.0%, despite a significant one-year revenue decline. Financial ratios lean slightly unfavorable, mainly due to high valuation multiples and weaker returns on invested capital. Debt is minimal, and the rating is very favorable (B-), though with some caution on valuation.
For those prioritizing income statement strength and slightly favorable financial ratios, Tower Semiconductor may appear more attractive, especially with its improving profitability trend despite value destruction. Conversely, investors focusing on high gross margins and market capitalization might find Lattice Semiconductor suitable, although its declining profitability and very unfavorable moat suggest higher risk.
Disclaimer: Investment carries a risk of loss of initial capital. The past performance is not a reliable indicator of future results. Be sure to understand risks before making an investment decision.
Go Further
I encourage you to read the complete analyses of Tower Semiconductor Ltd. and Lattice Semiconductor Corporation to enhance your investment decisions: