Home > Comparison > Technology > TER vs LSCC
The strategic rivalry between Teradyne, Inc. and Lattice Semiconductor Corporation shapes the semiconductor industry’s future. Teradyne operates as a capital-intensive test equipment manufacturer with diversified segments, while Lattice focuses on programmable semiconductor products with a leaner model. This analysis explores their contrasting growth paths and capital structures to identify which offers superior risk-adjusted returns. I aim to clarify which firm better aligns with diversified portfolios seeking exposure to semiconductor innovation and stability.
Table of contents
Companies Overview
Teradyne and Lattice Semiconductor both hold pivotal roles in the semiconductor industry, shaping tech innovation globally.
Teradyne, Inc.: Leader in Automated Test Equipment
Teradyne dominates as a global provider of automatic test equipment for semiconductors and wireless devices. Its revenue streams stem from testing platforms for memory, analog, and wireless technologies. In 2026, Teradyne sharpens its focus on expanding industrial automation with collaborative robots and autonomous mobile systems, diversifying beyond core semiconductor testing.
Lattice Semiconductor Corporation: FPGA Innovator
Lattice Semiconductor specializes in field programmable gate arrays (FPGAs) and video connectivity products. It generates revenue through direct sales and licensing of IP cores across communications, consumer, and industrial markets. The company’s 2026 strategy emphasizes broadening its IP portfolio and enhancing embedded solutions for automotive and computing sectors.
Strategic Collision: Similarities & Divergences
Teradyne and Lattice both operate within semiconductors but contrast sharply: Teradyne excels in testing and automation hardware, while Lattice thrives on configurable chip solutions and IP licensing. Their primary battleground lies in serving diverse OEMs needing reliable semiconductor performance. Investors should note Teradyne’s capital-intensive model versus Lattice’s scalable IP-driven approach, reflecting distinct risk and growth profiles.
Income Statement Comparison
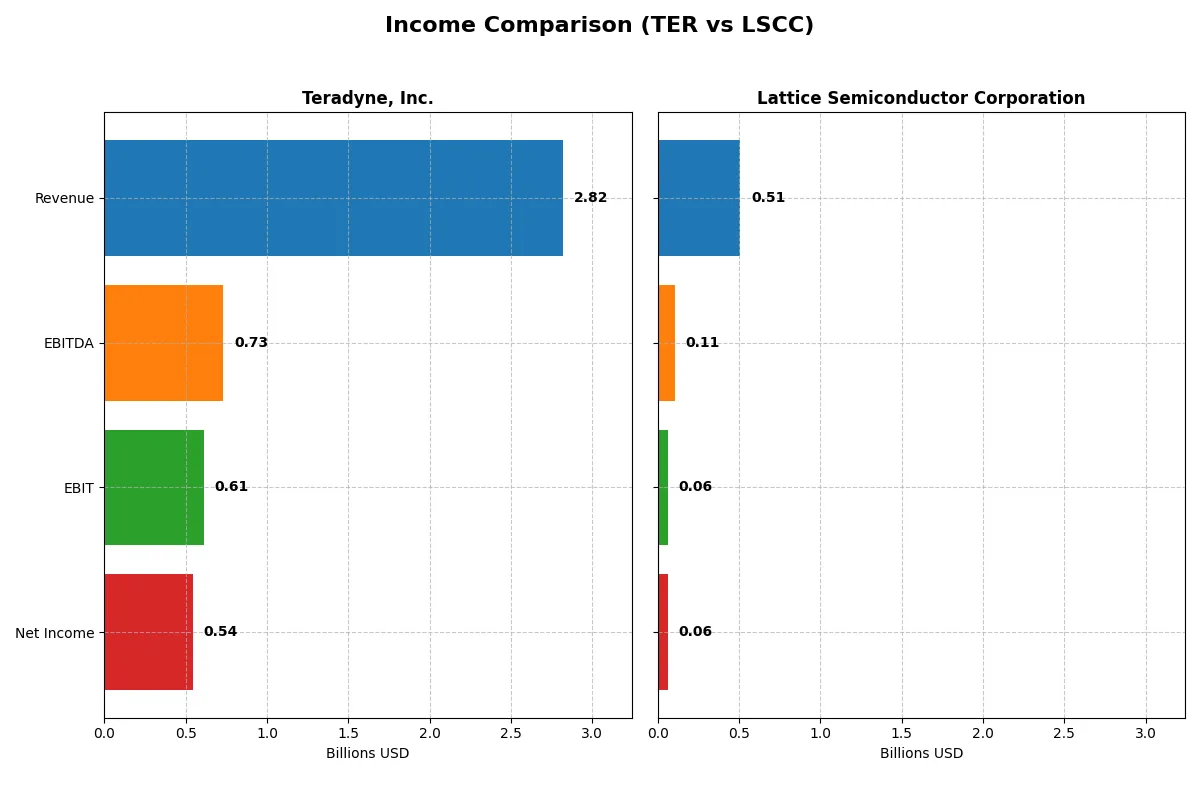
This data dissects the core profitability and scalability of both corporate engines to reveal who dominates the bottom line:
| Metric | Teradyne, Inc. (TER) | Lattice Semiconductor Corporation (LSCC) |
|---|---|---|
| Revenue | 2.82B | 509M |
| Cost of Revenue | 1.17B | 169M |
| Operating Expenses | 1.06B | 306M |
| Gross Profit | 1.65B | 340M |
| EBITDA | 732M | 107M |
| EBIT | 613M | 61M |
| Interest Expense | 3.6M | 0.3M |
| Net Income | 542M | 61M |
| EPS | 3.41 | 0.44 |
| Fiscal Year | 2024 | 2024 |
Income Statement Analysis: The Bottom-Line Duel
This income statement comparison reveals which company operates with greater efficiency and momentum in converting revenue into profit.
Teradyne, Inc. Analysis
Teradyne’s revenue fell 9.7% from 2020 to 2024 but grew 5.4% in 2024 alone, reflecting recent recovery. Net income also declined over five years but surged 21.6% in 2024, lifting net margin to a healthy 19.2%. Gross margin remains robust at 58.5%, and operating efficiency improved, signaling strong operational momentum.
Lattice Semiconductor Corporation Analysis
Lattice’s revenue increased 24.8% over five years but dropped sharply by 30.9% in 2024. Net income grew 29% overall but plunged 76% last year, compressing net margin to 12%. Despite a superior 66.8% gross margin, Lattice faces significant margin pressure from falling sales and rising operating expenses.
Margin Strength vs. Revenue Volatility
Teradyne shows steadier margin expansion and recent profit growth despite a long-term revenue decline. Lattice boasts higher gross margins but suffers from volatile revenue and steep net income contraction in 2024. Teradyne’s resilient profitability and improved efficiency offer a more stable profile, while Lattice’s sharp swings suggest higher risk for investors.
Financial Ratios Comparison
These vital ratios act as a diagnostic tool to expose the underlying fiscal health, valuation premiums, and capital efficiency of the companies compared below:
| Ratios | Teradyne, Inc. (TER) | Lattice Semiconductor Corporation (LSCC) |
|---|---|---|
| ROE | 19.2% | 8.6% |
| ROIC | 17.2% | 4.6% |
| P/E | 36.9x | 132.7x |
| P/B | 7.1x | 11.4x |
| Current Ratio | 2.91 | 3.66 |
| Quick Ratio | 1.84 | 2.62 |
| D/E | 0.03 | 0.02 |
| Debt-to-Assets | 2.1% | 1.8% |
| Interest Coverage | 166x | 130x |
| Asset Turnover | 0.76 | 0.60 |
| Fixed Asset Turnover | 4.88 | 7.62 |
| Payout ratio | 14.1% | 0% |
| Dividend yield | 0.38% | 0% |
| Fiscal Year | 2024 | 2024 |
Efficiency & Valuation Duel: The Vital Signs
Ratios act as a company’s DNA, revealing hidden risks and operational excellence that surface beyond headline numbers.
Teradyne, Inc.
Teradyne delivers strong profitability with a 19.24% ROE and 19.23% net margin, reflecting operational efficiency. Its valuation appears stretched, with a 36.93 P/E and 7.11 P/B ratio above sector averages. Shareholders receive a modest 0.38% dividend yield, while the company prioritizes reinvestment in R&D (16.3% of revenue) to fuel growth.
Lattice Semiconductor Corporation
Lattice Semiconductor posts weaker profitability, with an 8.6% ROE and 12.0% net margin, signaling operational challenges. The stock trades at a highly stretched 132.74 P/E and 11.41 P/B, reflecting elevated expectations. It pays no dividend, focusing heavily on R&D (31.3% of revenue) to drive future innovation and market positioning.
Premium Valuation vs. Operational Safety
Teradyne balances solid returns and cautious leverage despite a high valuation, while Lattice’s premium multiples contrast with weaker profitability. Teradyne suits investors seeking operational resilience; Lattice fits those embracing growth with higher risk tolerance.
Which one offers the Superior Shareholder Reward?
I see Teradyne, Inc. (TER) pays a modest 0.38% dividend yield with a sustainable 14% payout ratio, supported by strong free cash flow coverage (2.45x). TER also executes consistent buybacks, enhancing total returns. Lattice Semiconductor (LSCC) pays no dividend but funnels cash into growth and acquisitions, with a robust free cash flow conversion (85%). However, LSCC’s sky-high P/E and lack of buybacks raise valuation risks. Historically, TER’s balanced dividend and buyback model offers a more sustainable, attractive total shareholder reward in 2026.
Comparative Score Analysis: The Strategic Profile
The radar chart reveals the fundamental DNA and trade-offs of Teradyne and Lattice Semiconductor’s financial and valuation profiles:
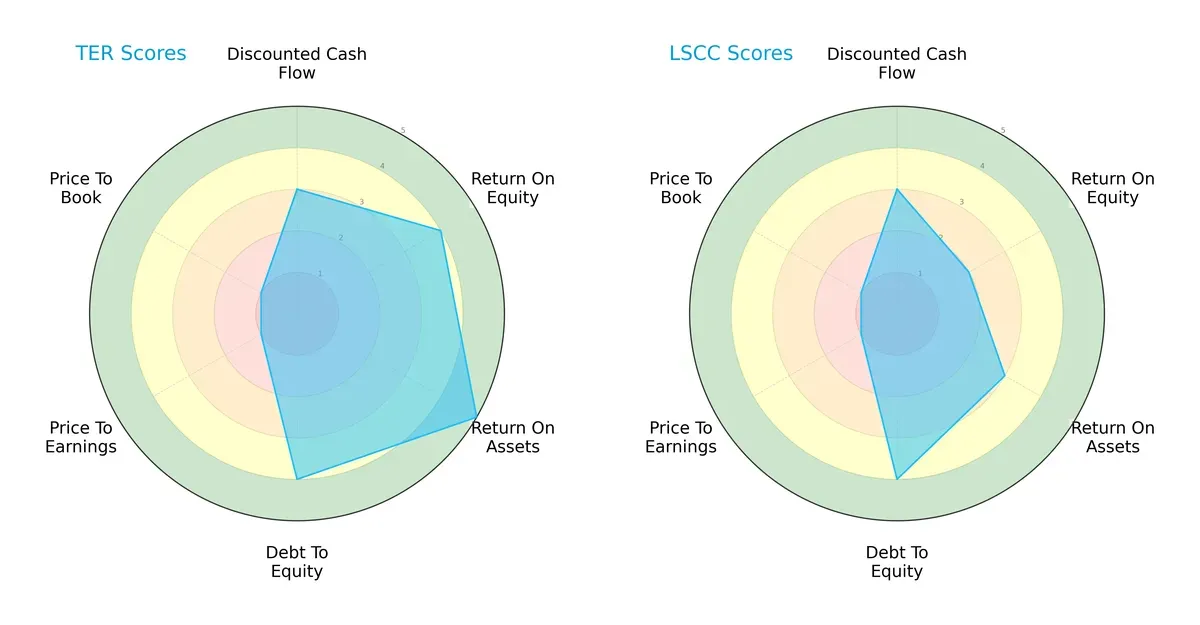
Teradyne shows stronger profitability metrics with a ROE score of 4 and ROA at 5, compared to Lattice’s more modest 2 and 3 respectively. Both companies maintain favorable debt-to-equity scores of 4, signaling balanced leverage. However, both suffer from very unfavorable valuation scores (PE and PB at 1), indicating potential overvaluation or market skepticism. Teradyne’s more balanced profile leverages operational efficiency, while Lattice depends more on moderate asset utilization without matching profitability strength.
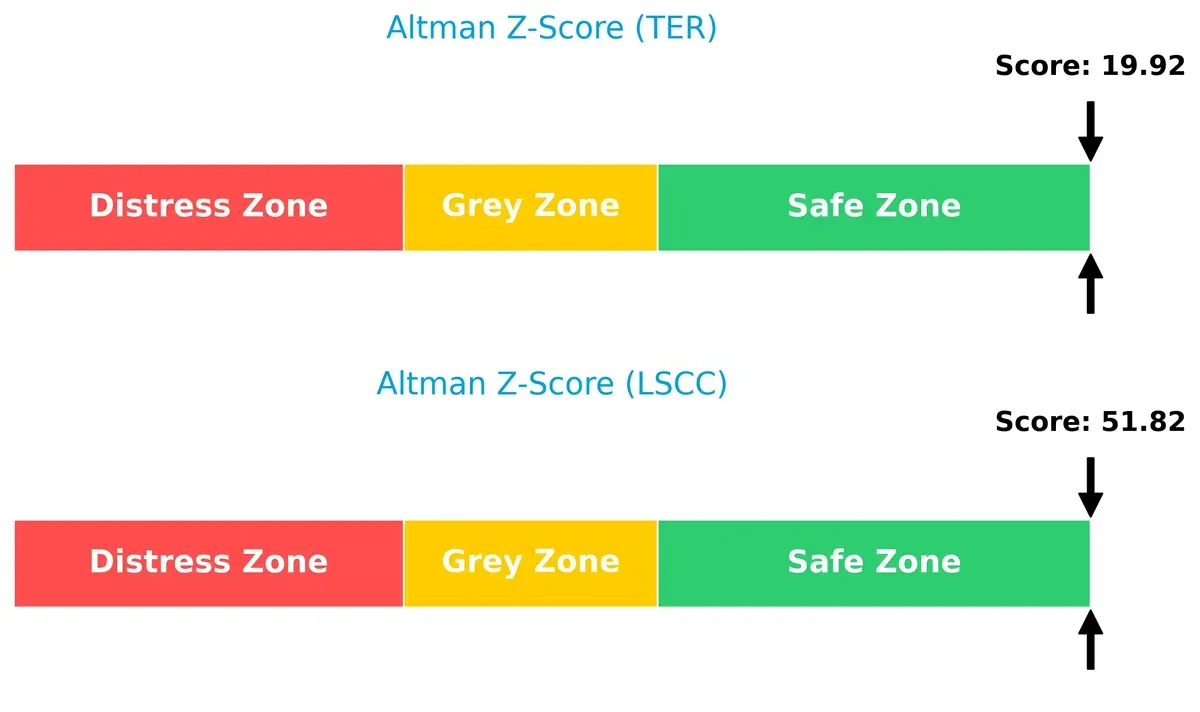
Bankruptcy Risk: Solvency Showdown
Teradyne’s Altman Z-Score of 19.9 versus Lattice’s 51.8 indicates both firms reside comfortably in the safe zone for long-term survival. This wide margin reflects extremely low bankruptcy risk and robust financial resilience in the current cycle:
Financial Health: Quality of Operations
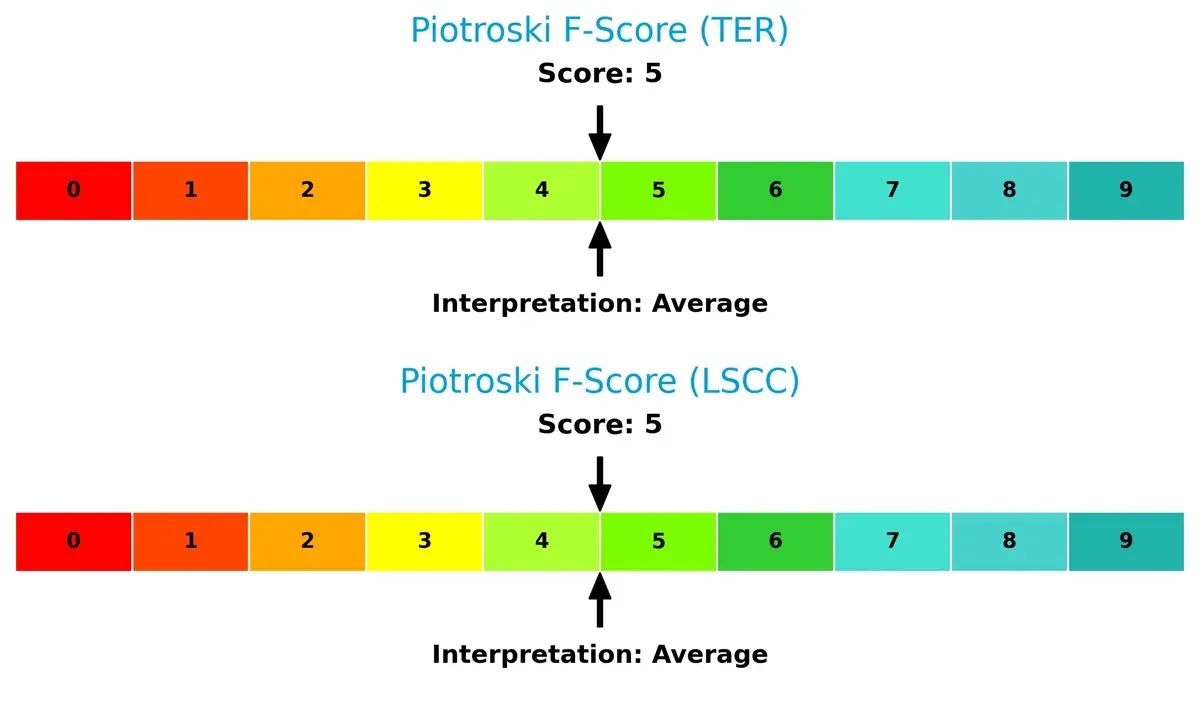
Both Teradyne and Lattice score 5 on the Piotroski F-Score, placing them at average financial health. Neither shows red flags, but this middling score suggests room for operational improvement and tighter internal controls:
How are the two companies positioned?
This section dissects TER and LSCC’s operational DNA by comparing revenue distribution and internal dynamics. The goal is to confront their economic moats and identify which model offers the most resilient competitive advantage today.
Revenue Segmentation: The Strategic Mix
The following visual comparison dissects how Teradyne, Inc. and Lattice Semiconductor Corporation diversify their income streams and where their primary sector bets lie:
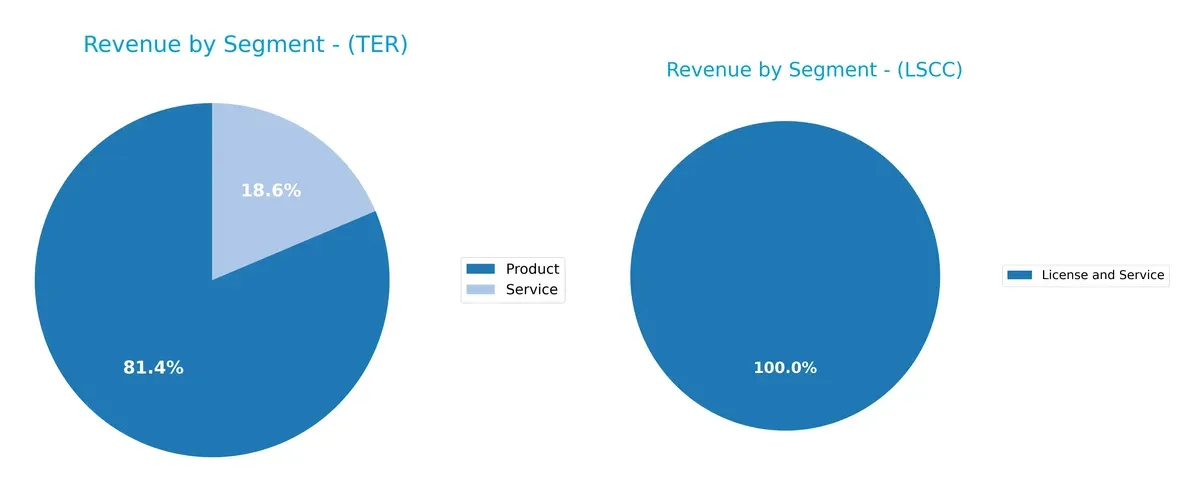
Teradyne anchors revenue in its Product segment with $2.3B in 2024, alongside a meaningful $525M Service stream, showing moderate diversification. Lattice Semiconductor relies heavily on Product Revenue, Distributors, which dwarfs its License and Service at $331M versus $17M in 2022. Teradyne’s mix reduces concentration risk and supports ecosystem lock-in, while Lattice’s reliance on distribution channels signals infrastructure dominance but higher exposure to distributor performance.
Strengths and Weaknesses Comparison
This table compares the Strengths and Weaknesses of Teradyne, Inc. and Lattice Semiconductor Corporation:
Teradyne Strengths
- Strong profitability with 19.23% net margin and 19.24% ROE
- Favorable leverage with low debt-to-assets at 2.07%
- Solid liquidity, current ratio at 2.91
- Global presence across Asia, Americas, and EMEA
- Balanced revenue from products and services
- High interest coverage ratio at 170.8
Lattice Semiconductor Strengths
- Moderate net margin at 12%
- Favorable quick ratio at 2.62 and low debt-to-assets at 1.81%
- Higher fixed asset turnover at 7.62
- Strong interest coverage at 228.11
- Diverse geographic revenue, notably Asia and Americas
Teradyne Weaknesses
- Elevated P/E of 36.93 and P/B of 7.11 signals expensive valuation
- WACC higher than ROIC at 12.41% vs. 17.25% (unfavorable)
- Dividend yield low at 0.38%
- Asset turnover neutral at 0.76
Lattice Semiconductor Weaknesses
- Low ROE at 8.6% and ROIC at 4.59% below WACC at 11.72%
- High P/E at 132.74 and P/B at 11.41 indicate overvaluation
- Current ratio unfavorable at 3.66 despite liquidity concerns
- Zero dividend yield
Teradyne’s strengths lie in profitability, liquidity, and geographic diversification, but valuation multiples suggest caution. Lattice Semiconductor shows solid liquidity and asset efficiency but struggles with profitability and valuation metrics, implying strategic challenges ahead.
The Moat Duel: Analyzing Competitive Defensibility
A structural moat is the only true shield protecting long-term profits from relentless competitive erosion. Let’s dissect the moats of these semiconductor players:
Teradyne, Inc.: Switching Costs Powerhouse
Teradyne’s moat stems from high switching costs embedded in its automated test equipment ecosystem. This drives stable 21.7% EBIT margins and 19.2% net margins. However, its declining ROIC signals pressure ahead. New industrial automation and wireless test segments could bolster resilience in 2026 if innovation accelerates.
Lattice Semiconductor Corporation: Niche IP Licensing Edge
Lattice’s moat is built on specialized IP licensing and FPGA technology, contrasting Teradyne’s asset-heavy model. Despite a favorable long-term revenue growth of 25%, recent sharp margin contractions and a negative ROIC versus WACC reflect weakening profitability. Expansion into emerging markets or disruptive tech could revive its competitive stance.
Switching Costs vs. IP Licensing: Who Defends Better?
Teradyne’s wider moat leverages entrenched client relationships and diversified product lines, providing stronger profit defense. Lattice’s niche IP moat is narrower and currently under strain. Overall, Teradyne stands better equipped to defend market share amid increasing sector competition.
Which stock offers better returns?
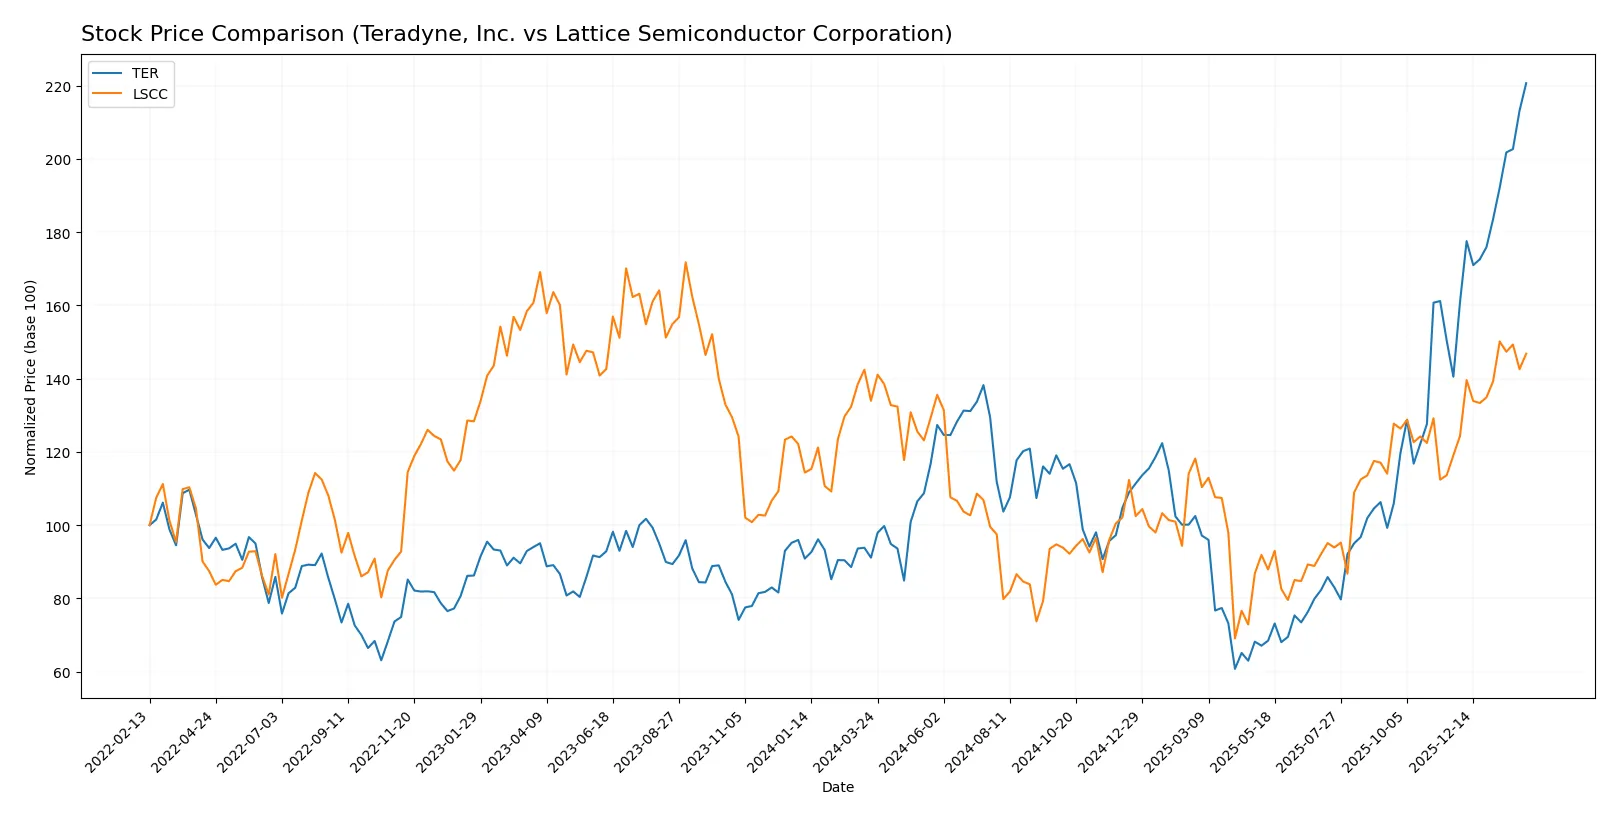
The past year reveals significant price gains for Teradyne, Inc. and steady growth for Lattice Semiconductor Corporation, with distinct trading volumes shaping their momentum.
Trend Comparison
Teradyne, Inc. shows a strong bullish trend with a 142.12% price increase over 12 months, marked by acceleration and high volatility. It hit a low of 68.72 and peaked at 249.53.
Lattice Semiconductor Corporation also follows a bullish path, rising 9.6% over the same period with accelerating momentum but lower volatility, ranging between 39.03 and 84.8.
Teradyne outperformed Lattice Semiconductor, delivering substantially higher returns and stronger volume-driven momentum in the past year.
Target Prices
Analysts present a clear target consensus for Teradyne, Inc. and Lattice Semiconductor Corporation.
| Company | Target Low | Target High | Consensus |
|---|---|---|---|
| Teradyne, Inc. | 136 | 280 | 230.17 |
| Lattice Semiconductor Corporation | 65 | 105 | 84.67 |
The consensus target for Teradyne sits slightly below its current price of $249.53, signaling cautious optimism. Lattice Semiconductor’s target consensus exceeds its current $82.91 price, indicating moderate upside potential.

Don’t Let Luck Decide Your Entry Point
Optimize your entry points with our advanced ProRealTime indicators. You’ll get efficient buy signals with precise price targets for maximum performance. Start outperforming now!
How do institutions grade them?
The following tables summarize recent institutional grades for Teradyne, Inc. and Lattice Semiconductor Corporation:
Teradyne, Inc. Grades
Institutional grades and rating actions for Teradyne, Inc. from leading financial firms:
| Grading Company | Action | New Grade | Date |
|---|---|---|---|
| Cantor Fitzgerald | Maintain | Overweight | 2026-02-02 |
| Stifel | Maintain | Buy | 2026-01-30 |
| UBS | Maintain | Buy | 2026-01-26 |
| B of A Securities | Maintain | Buy | 2026-01-22 |
| Stifel | Maintain | Buy | 2026-01-14 |
| B of A Securities | Maintain | Buy | 2026-01-13 |
| Goldman Sachs | Upgrade | Buy | 2025-12-16 |
| Stifel | Upgrade | Buy | 2025-12-02 |
| Citigroup | Maintain | Buy | 2025-11-12 |
| JP Morgan | Maintain | Neutral | 2025-10-30 |
Lattice Semiconductor Corporation Grades
Institutional grades and rating actions for Lattice Semiconductor Corporation from respected firms:
| Grading Company | Action | New Grade | Date |
|---|---|---|---|
| Susquehanna | Maintain | Positive | 2026-01-22 |
| Keybanc | Maintain | Overweight | 2026-01-13 |
| Baird | Maintain | Outperform | 2025-11-04 |
| Rosenblatt | Maintain | Buy | 2025-11-04 |
| Benchmark | Maintain | Buy | 2025-11-04 |
| Stifel | Maintain | Buy | 2025-11-04 |
| Needham | Maintain | Buy | 2025-11-04 |
| Susquehanna | Maintain | Positive | 2025-10-22 |
| Keybanc | Maintain | Overweight | 2025-09-30 |
| Needham | Maintain | Buy | 2025-09-22 |
Which company has the best grades?
Both companies receive predominantly positive and buy ratings. Teradyne features multiple upgrades to Buy from Sell or Hold recently. Lattice shows consistent Buy/Outperform grades with no downgrades. Teradyne’s upgrades may signal improving outlook; Lattice’s steady buy ratings reflect stable confidence. Investors should weigh these signals within broader market context.
Risks specific to each company
The following categories identify the critical pressure points and systemic threats facing both firms in the 2026 market environment:
1. Market & Competition
Teradyne, Inc.
- Operates in diverse semiconductor testing and automation segments, facing intense competition but benefits from scale and product breadth.
Lattice Semiconductor Corporation
- Focuses on niche FPGA markets with growing competition from larger semiconductor firms and evolving technology demands.
2. Capital Structure & Debt
Teradyne, Inc.
- Maintains a very low debt-to-equity ratio (0.03), signaling strong financial stability and low leverage risk.
Lattice Semiconductor Corporation
- Also has low debt (0.02 D/E), indicating prudent capital structure and manageable financial risk.
3. Stock Volatility
Teradyne, Inc.
- Exhibits higher beta (1.82), implying greater sensitivity to market swings and elevated volatility risk.
Lattice Semiconductor Corporation
- Slightly lower beta (1.67) suggests marginally less volatility but still above market average.
4. Regulatory & Legal
Teradyne, Inc.
- Subject to global trade regulations and export controls impacting semiconductor test equipment sales.
Lattice Semiconductor Corporation
- Faces regulatory scrutiny in semiconductor IP and licensing, plus trade tensions affecting global sales.
5. Supply Chain & Operations
Teradyne, Inc.
- Complex global supply chain with risks from component shortages and geopolitical disruptions.
Lattice Semiconductor Corporation
- Heavily reliant on third-party manufacturers and distributors, exposing it to supply chain volatility.
6. ESG & Climate Transition
Teradyne, Inc.
- Increasing pressure to enhance sustainability in manufacturing and automation products.
Lattice Semiconductor Corporation
- Must address ESG concerns while managing energy-efficient semiconductor designs and IP licensing.
7. Geopolitical Exposure
Teradyne, Inc.
- Exposure to US-China trade tensions and international market volatility due to global operations.
Lattice Semiconductor Corporation
- Similarly affected by geopolitical risks given its global customer base and supply chain dependencies.
Which company shows a better risk-adjusted profile?
Teradyne’s strongest risk is market volatility, amplified by its high beta and premium valuation multiples. Lattice faces significant challenges from competitive pressure and valuation risk, reflected in its weaker profitability and elevated P/E ratio. Teradyne’s robust capital structure and diversified segments offer a more balanced risk-adjusted profile. Recent data show Teradyne’s interest coverage ratio at 170.8, underscoring financial resilience. Lattice’s stretched valuation at a P/E of 132.7 raises valuation risks despite solid operational metrics. Overall, Teradyne presents a safer risk-return tradeoff in 2026’s uncertain semiconductor market.
Final Verdict: Which stock to choose?
Teradyne, Inc. wields unmatched operational efficiency and a robust free cash flow engine that sustains its value creation despite a slight decline in profitability. Its high valuation multiples suggest a premium, making it a point of vigilance. This stock suits portfolios targeting aggressive growth with tolerance for cyclical swings.
Lattice Semiconductor Corporation’s strategic moat centers on its niche semiconductor R&D and innovation, delivering recurring revenue safety. It offers a more conservative risk profile compared to Teradyne, given its solid liquidity and lower leverage. This company fits well in GARP portfolios seeking growth tempered by valuation discipline.
If you prioritize consistent value creation and operational excellence, Teradyne outshines as the compelling choice due to its superior cash generation and market leadership. However, if you seek growth potential with a stronger focus on innovation and relative safety, Lattice Semiconductor offers better stability despite its current profitability challenges. Both scenarios require careful monitoring of valuation and industry cyclicality.
Disclaimer: Investment carries a risk of loss of initial capital. The past performance is not a reliable indicator of future results. Be sure to understand risks before making an investment decision.
Go Further
I encourage you to read the complete analyses of Teradyne, Inc. and Lattice Semiconductor Corporation to enhance your investment decisions: