In the rapidly evolving semiconductor industry, Qnity Electronics, Inc. (Q) and Lattice Semiconductor Corporation (LSCC) stand out as dynamic players shaping advanced electronic materials and programmable chip technologies. Both companies compete in overlapping markets with distinct innovation strategies, making them compelling choices for tech investors. This article will analyze their strengths and risks to help you decide which stock deserves a place in your investment portfolio.
Table of contents
Companies Overview
I will begin the comparison between Qnity Electronics and Lattice Semiconductor by providing an overview of these two companies and their main differences.
Qnity Electronics Overview
Qnity Electronics, Inc. specializes in electronic solutions and materials essential for semiconductor chip manufacturing and advanced electronic materials. Formerly known as Novus SpinCo 1, the company rebranded in April 2025 and is headquartered in Wilmington, Delaware. It operates within the semiconductor industry, positioning itself as a provider of critical components for chip production.
Lattice Semiconductor Overview
Lattice Semiconductor Corporation develops and markets semiconductor products globally, focusing on field programmable gate arrays and video connectivity application-specific products. Established in 1983 and based in Hillsboro, Oregon, it serves original equipment manufacturers across communications, computing, consumer, industrial, and automotive sectors. Lattice also generates revenue from IP licensing and patent monetization.
Key similarities and differences
Both companies operate in the semiconductor sector and offer specialized electronic components, but their business models differ. Qnity Electronics focuses on materials for chip manufacturing, while Lattice Semiconductor emphasizes programmable gate arrays and IP licensing. Lattice has a longer market presence and a more diversified geographical footprint, whereas Qnity is a newer entity with a narrower product scope.
Income Statement Comparison
The table below presents a factual comparison of key income statement metrics for Qnity Electronics, Inc. and Lattice Semiconductor Corporation for the fiscal year 2024.
| Metric | Qnity Electronics, Inc. | Lattice Semiconductor Corporation |
|---|---|---|
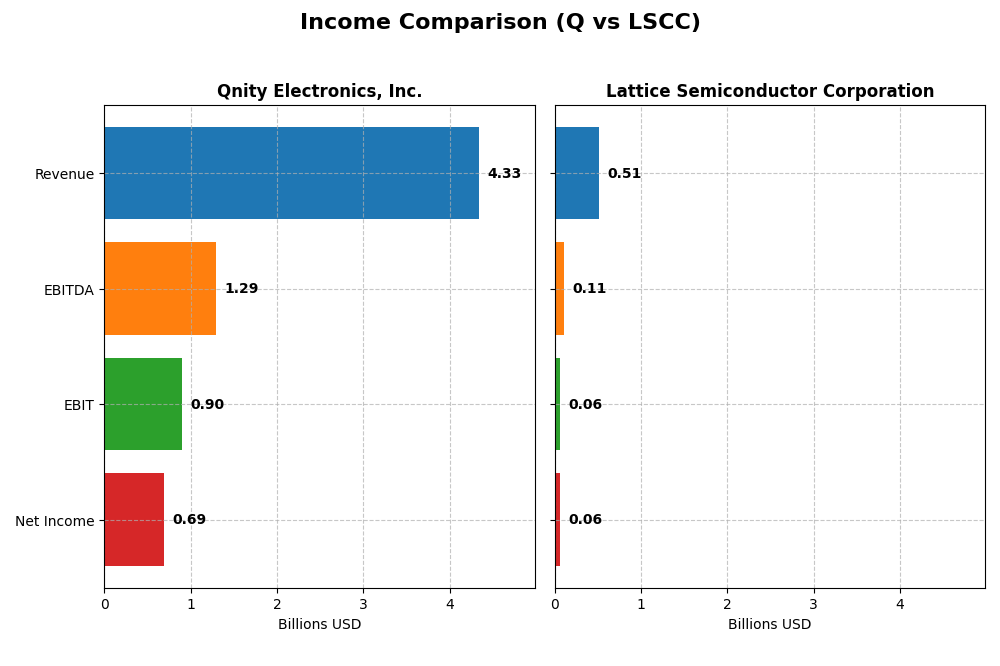
| Market Cap | 19.5B | 11.7B |
| Revenue | 4.34B | 509.4M |
| EBITDA | 1.29B | 107M |
| EBIT | 898M | 60.7M |
| Net Income | 693M | 61.1M |
| EPS | 3.31 | 0.44 |
| Fiscal Year | 2024 | 2024 |
Income Statement Interpretations
Qnity Electronics, Inc.
Qnity Electronics saw a revenue decline of 8.83% from 2022 to 2024, with net income decreasing by 10.47% over the same period. Margins remained relatively stable, with a gross margin of 46.11% and a net margin near 16% in 2024. The latest fiscal year showed a 7.43% revenue increase and strong net income growth of 27.23%, highlighting improved profitability despite an overall downward trend.
Lattice Semiconductor Corporation
Lattice Semiconductor exhibited a 24.82% revenue increase and a 28.99% rise in net income from 2020 to 2024. Margins are robust, with a gross margin of 66.82% and a net margin at 12% in 2024. However, the most recent year saw a sharp 30.9% revenue decline and a 65.85% drop in net margin, signaling operational challenges despite favorable long-term growth.
Which one has the stronger fundamentals?
Both companies maintain favorable overall income statement evaluations, yet Qnity Electronics displays stronger margin stability and recent profitability improvements. Lattice Semiconductor benefits from significant long-term growth but faces steep short-term declines impacting margins and earnings. Hence, Qnity’s fundamentals appear more resilient in the latest fiscal context, while Lattice’s strength lies in its overall growth trajectory.
Financial Ratios Comparison
The table below presents a side-by-side comparison of key financial ratios for Qnity Electronics, Inc. (Q) and Lattice Semiconductor Corporation (LSCC) based on their most recent fiscal year data from 2024.
| Ratios | Qnity Electronics, Inc. (Q) | Lattice Semiconductor Corporation (LSCC) |
|---|---|---|
| ROE | 6.51% | 8.60% |
| ROIC | 5.92% | 4.59% |
| P/E | 28.8 | 132.7 |
| P/B | 1.88 | 11.41 |
| Current Ratio | 1.77 | 3.66 |
| Quick Ratio | 1.06 | 2.62 |
| D/E (Debt to Equity) | 0.018 | 0.021 |
| Debt-to-Assets | 1.56% | 1.81% |
| Interest Coverage | 3.03 | 129.54 |
| Asset Turnover | 0.35 | 0.60 |
| Fixed Asset Turnover | 2.59 | 7.62 |
| Payout ratio | 0 | 0 |
| Dividend yield | 0% | 0% |
Interpretation of the Ratios
Qnity Electronics, Inc.
Qnity Electronics shows a mix of strong and weak financial ratios. Its net margin is favorable at 16%, but return on equity is relatively low at 6.5%, flagged as unfavorable. The company maintains a solid current ratio of 1.77 and low debt levels, which are positive. It pays a small dividend of $0.06, though the dividend yield is negligible, suggesting cautious shareholder returns without aggressive payouts or buybacks.
Lattice Semiconductor Corporation
Lattice Semiconductor presents a varied ratio profile with several unfavorable metrics, including a high P/E of 133 and elevated price-to-book ratio of 11.41, hinting at overvaluation concerns. Its quick ratio is favorable at 2.62, and interest coverage is excellent at 228.11. The company does not pay dividends, likely reflecting a reinvestment strategy to support its significant R&D spending.
Which one has the best ratios?
Qnity Electronics and Lattice Semiconductor both have 42.86% favorable ratios, but Qnity’s overall profile is slightly more positive due to fewer unfavorable metrics and a balanced capital structure. Lattice’s high valuation multiples and unfavorable current ratio weigh on its standing. Thus, Qnity holds a slightly favorable edge in ratio quality.
Strategic Positioning
This section compares the strategic positioning of Qnity Electronics, Inc. (Q) and Lattice Semiconductor Corporation (LSCC) in terms of market position, key segments, and exposure to technological disruption:
Q
- New York Stock Exchange-listed with a $19.5B market cap, no beta, and stable trading.
- Focuses on electronic solutions and materials for semiconductor chip manufacturing.
- No explicit data on technological disruption exposure available.
LSCC
- NASDAQ-listed with a $11.7B market cap, beta of 1.72, indicating higher market volatility exposure.
- Develops and sells semiconductor products, including FPGAs, video connectivity, and IP licensing.
- Operates in multiple regions with diversified product offerings, potentially exposed to tech shifts.
Q vs LSCC Positioning
Q’s strategic approach centers on electronic materials with a large market cap but limited segment detail, suggesting a concentrated focus. LSCC offers diversified semiconductor products and licensing, serving global OEMs, but faces higher market volatility and declining profitability trends.
Which has the best competitive advantage?
Q maintains stable profitability without a demonstrated competitive advantage, while LSCC is losing value with declining ROIC, indicating Q currently holds a more neutral and sustainable competitive position based on MOAT evaluation.
Stock Comparison
The stock price movements of Qnity Electronics, Inc. and Lattice Semiconductor Corporation reveal contrasting dynamics over the past year, with Qnity showing relative stability and Lattice demonstrating significant bullish momentum.
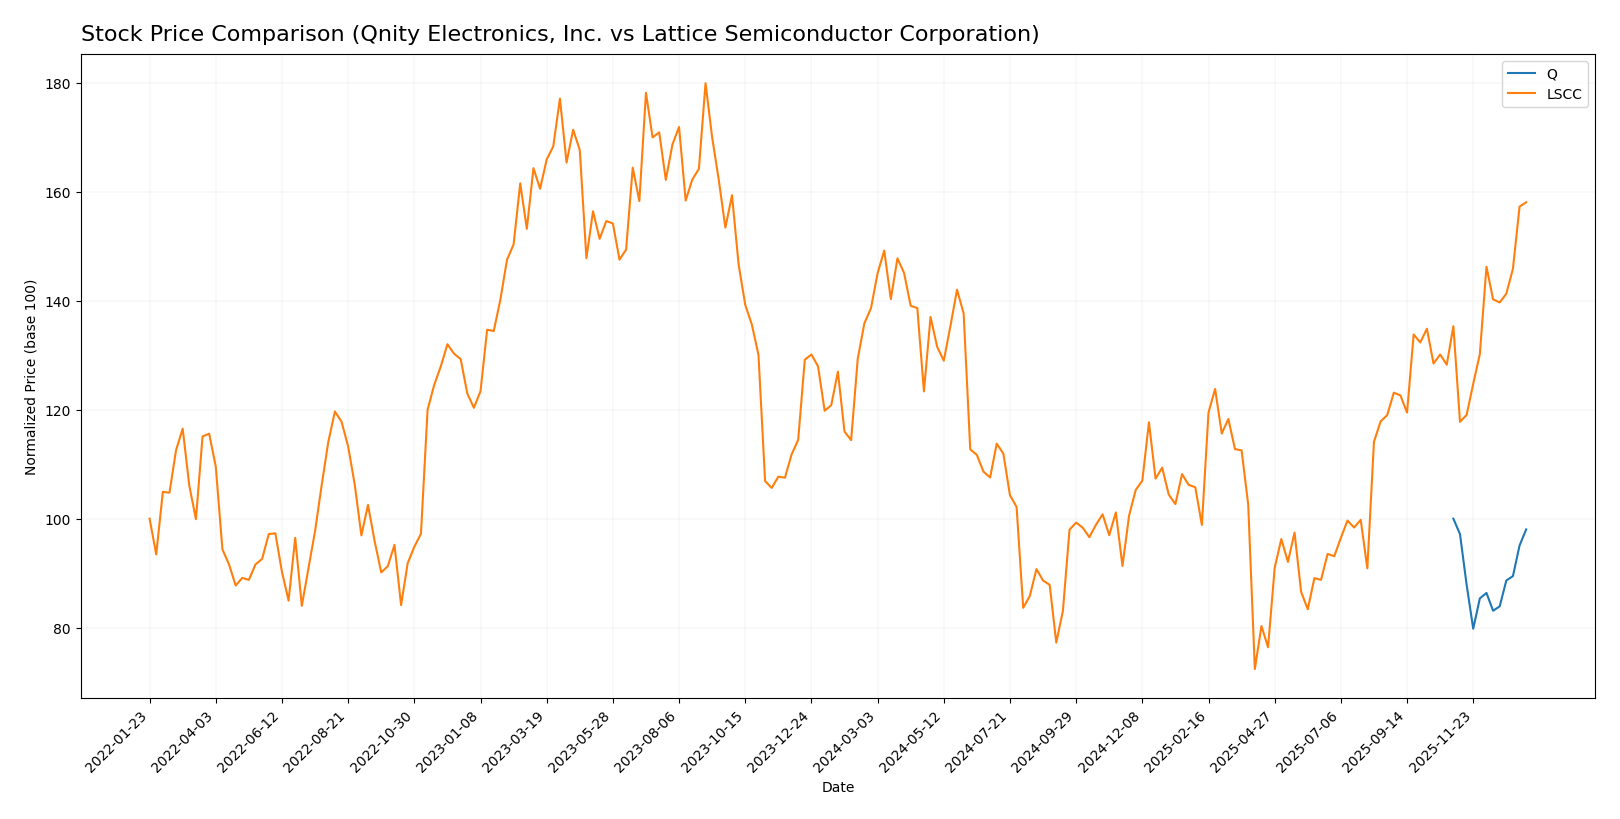
Trend Analysis
Qnity Electronics, Inc. experienced a slight bearish trend over the past 12 months with a -1.98% price change, stable acceleration, and prices ranging between 75.8 and 95.0. Volatility measured by standard deviation was moderate at 5.94.
Lattice Semiconductor Corporation showed a strong bullish trend with a 14.02% price increase and accelerating momentum. Its price fluctuated widely from 39.03 to 85.23, with higher volatility reflected by an 11.01 standard deviation.
Comparing both, Lattice Semiconductor delivered the highest market performance with a clear bullish trend, while Qnity Electronics remained nearly flat with a slight bearish tendency.
Target Prices
Analysts present a clear target price consensus for Qnity Electronics, Inc. and Lattice Semiconductor Corporation.
| Company | Target High | Target Low | Consensus |
|---|---|---|---|
| Qnity Electronics, Inc. | 117 | 92 | 105.89 |
| Lattice Semiconductor Corporation | 105 | 65 | 83 |
The target consensus for Qnity Electronics at 105.89 suggests moderate upside potential from its current price of 93.12. For Lattice Semiconductor, the consensus target of 83 is slightly below its current price of 85.23, indicating cautious analyst expectations.
Analyst Opinions Comparison
This section compares analysts’ ratings and grades for Qnity Electronics, Inc. (Q) and Lattice Semiconductor Corporation (LSCC):
Rating Comparison
Q Rating
- Rating: B+, considered Very Favorable by analysts.
- Discounted Cash Flow Score: 4, indicating a Favorable valuation outlook.
- ROE Score: 3, showing Moderate efficiency in generating profit from equity.
- ROA Score: 4, Favorable asset utilization for earnings.
- Debt To Equity Score: 3, Moderate financial risk level.
- Overall Score: 3, Moderate overall financial standing.
LSCC Rating
- Rating: B-, also considered Very Favorable by analysts.
- Discounted Cash Flow Score: 3, indicating a Moderate valuation outlook.
- ROE Score: 2, showing Moderate but lower efficiency in profit generation.
- ROA Score: 3, Moderate asset utilization efficiency.
- Debt To Equity Score: 4, Favorable lower financial risk.
- Overall Score: 2, Moderate overall financial standing but lower than Q.
Which one is the best rated?
Based strictly on the provided data, Q holds a higher rating (B+) and scores better in discounted cash flow, ROE, ROA, and overall score compared to LSCC. LSCC outperforms Q only in debt-to-equity ratio.
Scores Comparison
The scores comparison between Qnity Electronics, Inc. and Lattice Semiconductor Corporation is as follows:
Q Scores
- Altman Z-Score: Not provided.
- Piotroski Score: Not provided.
LSCC Scores
- Altman Z-Score: 52.69, indicating a safe financial zone.
- Piotroski Score: 5, indicating average financial strength.
Which company has the best scores?
Only Lattice Semiconductor Corporation has available scores, showing a very high Altman Z-Score in the safe zone and an average Piotroski Score. Qnity Electronics, Inc. has no scores provided for comparison.
Grades Comparison
Here is the comparison of recent grades and ratings for Qnity Electronics, Inc. and Lattice Semiconductor Corporation:
Qnity Electronics, Inc. Grades
The following table shows recent grades from reputable grading companies for Qnity Electronics, Inc.:
| Grading Company | Action | New Grade | Date |
|---|---|---|---|
| RBC Capital | Maintain | Outperform | 2025-11-25 |
| Mizuho | Maintain | Outperform | 2025-11-20 |
Overall, Qnity Electronics has maintained an “Outperform” rating from both grading companies, indicating a stable positive outlook.
Lattice Semiconductor Corporation Grades
The following table displays recent grades from recognized grading companies for Lattice Semiconductor Corporation:
| Grading Company | Action | New Grade | Date |
|---|---|---|---|
| Keybanc | Maintain | Overweight | 2026-01-13 |
| Stifel | Maintain | Buy | 2025-11-04 |
| Baird | Maintain | Outperform | 2025-11-04 |
| Needham | Maintain | Buy | 2025-11-04 |
| Rosenblatt | Maintain | Buy | 2025-11-04 |
| Benchmark | Maintain | Buy | 2025-11-04 |
| Susquehanna | Maintain | Positive | 2025-10-22 |
| Keybanc | Maintain | Overweight | 2025-09-30 |
| Needham | Maintain | Buy | 2025-09-22 |
| Benchmark | Maintain | Buy | 2025-09-11 |
Lattice Semiconductor shows a consistent pattern of “Buy,” “Outperform,” and “Overweight” grades across multiple reputable firms, reflecting a broadly positive consensus.
Which company has the best grades?
Lattice Semiconductor Corporation has received more numerous and consistently positive grades compared to Qnity Electronics, Inc., which has fewer but stable “Outperform” ratings. This broader positive consensus for Lattice may suggest stronger analyst confidence, potentially impacting investor sentiment towards more favorable expectations.
Strengths and Weaknesses
Below is a comparison table summarizing the key strengths and weaknesses of Qnity Electronics, Inc. (Q) and Lattice Semiconductor Corporation (LSCC) based on their latest financial and strategic data.
| Criterion | Qnity Electronics, Inc. (Q) | Lattice Semiconductor Corporation (LSCC) |
|---|---|---|
| Diversification | Moderate product range; no detailed revenue segmentation available | Focused on semiconductor products with significant licensing and service revenue, showing some diversification |
| Profitability | Net margin 16%, ROIC 5.9%, stable but no competitive advantage | Net margin 12%, ROIC 4.6%, declining profitability and value destruction |
| Innovation | Neutral innovation outlook; stable ROIC trend | Innovation concerns with declining ROIC and unfavorable valuation ratios |
| Global presence | Solid financial health with favorable liquidity ratios; presence details limited | Strong asset turnover and fixed asset efficiency; good interest coverage |
| Market Share | Stable but no clear economic moat; slightly favorable ratio profile | Very unfavorable moat status; high valuation multiples suggest risk |
Key takeaways: Qnity Electronics shows stable profitability and solid financial footing but lacks a clear competitive moat. Lattice Semiconductor faces profitability challenges and value destruction, despite operational strengths and liquidity. Investors should weigh Q’s stability against LSCC’s higher risk profile.
Risk Analysis
Below is a table summarizing the primary risks associated with Qnity Electronics, Inc. (Q) and Lattice Semiconductor Corporation (LSCC) as of 2026:
| Metric | Qnity Electronics, Inc. (Q) | Lattice Semiconductor Corporation (LSCC) |
|---|---|---|
| Market Risk | Low beta (0), stable trading range; moderate market exposure | High beta (1.716) indicates higher volatility and market sensitivity |
| Debt Level | Very low debt-to-equity (0.02), low debt-to-assets (1.56%) | Low debt-to-equity (0.02), low debt-to-assets (1.81%) but higher interest coverage |
| Regulatory Risk | Moderate, US-based semiconductor manufacturer | Moderate, global operations with exposure to international regulations |
| Operational Risk | Limited operational data due to recent IPO in 2025 | Established operations with 1,110 employees and diversified product lines |
| Environmental Risk | No significant disclosures; semiconductor materials can pose environmental concerns | Exposure to manufacturing environmental regulations in multiple regions |
| Geopolitical Risk | US-focused, less exposure to geopolitical fluctuations | Higher exposure due to global sales in Asia, Europe, Americas |
In 2026, Qnity Electronics shows lower market risk with a stable financial structure and minimal debt, but limited operational history increases uncertainty. Lattice Semiconductor faces higher market volatility and geopolitical risks due to its global footprint, along with elevated valuation risks indicated by unfavorable price-to-earnings and price-to-book ratios. Investors should weigh Q’s emerging presence against LSCC’s established but more volatile profile.
Which Stock to Choose?
Qnity Electronics, Inc. (Q) shows a slightly favorable financial ratio profile with a 15.99% net margin and a 6.51% ROE, supported by low debt levels (D/E 0.02) and a strong current ratio of 1.77. Its income statement is favorable with positive recent growth, but its ROIC suggests stable profitability without a clear competitive advantage. The company holds a very favorable B+ rating.
Lattice Semiconductor Corporation (LSCC) presents a mixed picture with a favorable net margin of 12.0% but several unfavorable ratios, including a high P/E of 132.74 and an elevated WACC of 11.86%. Its income statement is favorable overall despite recent declines, yet its ROIC is declining and well below WACC, indicating value destruction. The firm’s rating is also very favorable at B-, though with more moderate scores.
Investors seeking stability and a company with a balanced income growth and financial ratios might view Qnity Electronics as more favorable, while those with a tolerance for volatility and a focus on potential turnaround or growth opportunities could find Lattice Semiconductor’s profile indicative of higher risk but possible upside. The ratings and moat evaluations imply differing risk-reward profiles aligned with these investor preferences.
Disclaimer: Investment carries a risk of loss of initial capital. The past performance is not a reliable indicator of future results. Be sure to understand risks before making an investment decision.
Go Further
I encourage you to read the complete analyses of Qnity Electronics, Inc. and Lattice Semiconductor Corporation to enhance your investment decisions: